
ABSTRACT
Recent studies show that a combination mode (C-mode) represents the seasonally modulated dynamics of ENSO, which plays an important role in maintaining the western North Pacific anomalous anticyclone. This C-mode could obviously influence the East Asian climate, especially since the contribution of ENSO to southern China’s precipitation has weakened since the late 1990s. This paper evaluates whether the C-mode and its influences on precipitation over southern China can be realistically described by the climate model ECHAM5/MPI-OM. The authors find that the model is able to reproduce the spatial and temporal variability of the C-mode and the asymmetric responses of air–sea variations in the tropical Pacific. The model also reveals the observed significant effects of the C-mode on the wintertime and springtime rainfall over southern China during El Niño events. The findings have implications for ECHAM5/MPI-OM being a valuable tool for simulating and predicting the C-mode-related seasonal precipitation over southern China.
GRAPHICAL ABSTRACT
摘要
对东亚气候年际变率的研究仍存在许多值得探寻之处。已有研究表明,产生于ENSO年际变率和暖池年循环相互作用的C-mode与东亚气候异常变化的关系密切,特别是自20世纪90年代以来,ENSO对中国南方降水的贡献减弱,而C-mode的影响则在2000年后凸显出来。本文利用600年长时间模拟结果评估了气候模式ECHAM5/MPI-OM对C-mode及其对华南季节降水影响的模拟。结果表明该模式能够再现C-mode的时空特征以及热带海气对其的非对称响应。同时也能较好地抓住C-mode影响华南冬春季降水异常的时空结构。这将有助于进一步利用ECHAM5/MPI-OM来模 拟和预测与C-mode相关的华南季节降水异常变化。
1. Introduction
Stemming from large-scale air–sea interactions, ENSO is the most prevalent interannual variability phenomenon and its influence can be felt around the globe (Ropelewski and Halpert Citation1987; Philander, Rogério Dos Santos, and Alex Soares de Souza Citation1990; Neelin et al. Citation1998; Trenberth and Caron Citation2000; Alexander et al. Citation2002). Previous studies have revealed that the meridional antisymmetric ENSO combination mode (C-mode) results from the nonlinear atmospheric interaction between ENSO variability and the SST annual cycle. It shows a significant variability of near-annual combination time periods of approximately 10 months as well as a stronger one of approximately 15 months (Stuecker et al. Citation2013). Furthermore, the C-mode illustrates meridional antisymmetric patterns related to the equator both in the atmosphere and in SST anomalies (Du et al. Citation2009; Stuecker et al. Citation2013, Citation2015).
Previous studies suggest that this C-mode, occurring most dominantly during strong El Niño, is of great significance in terminating the El Niño life period along with the rapid southward movement of westerly anomalies (Vecchi Citation2005; Vecchi and Harrison Citation2003; Lengaigne et al. Citation2006; Stuecker et al. Citation2013). Moreover, it also has an essential role in developing and maintaining the anomalous western North Pacific anticyclone (WNPAC) (Stuecker et al. Citation2015). The WNPAC can cause a stronger transport of water vapor towards East Asia and significantly affect anomalies of East Asian precipitation (Zhang, Min, and Su Citation2017). Owing to its importance in ENSO seasonally modulated dynamics and its influence on East Asian climate-related ENSO, it is crucial to evaluate the simulation of the C-mode by models.
Many examinations have been conducted to assess the performance of models in simulating the C-mode (Weisheimer et al. Citation2009; Li et al. Citation2016; Zhang et al. Citation2016a). For example, Ren et al. (Citation2016) proposed that most models in CMIP5 can capture the dimensional distribution of the C-mode, but only half of them are able to capture the spectral peak near the annual cycle. Even increasing the horizontal resolution cannot improve the accuracy of the C-mode simulation, according to Wan, Ren, and Wu (Citation2018). It is currently not clear which characteristics of models contribute a realistic C-mode simulation. The main purpose of this study is to examine the atmospheric and oceanic response of the C-mode and its influences on the southern China precipitation simulated by ECHAM5/MPI-OM.
2. Model and datasets
The ECHAM5/MPI-OM coupled climate model consists of ECHAM5.4 at T63 spectral resolution (1.875° × 1.875°) as the atmospheric part and MPI-OM as the oceanic part. The model simulates the mean state and does not request a flux adjustment to maintain a stable climate. For more information about the model, see Marsland et al. (Citation2003), Jungclaus et al. (Citation2006), and Wolff, Maier-Reimer, and Legutke (Citation1997). The model shows good performance in climate prediction at seasonal to decadal timescales (Keenlyside et al. Citation2005; Keenlyside et al. Citation2008) and can reproduce similar realistic aspects of climate variability such as ENSO and the Pacific Decadal Oscillation (Oldenborgh, Philip, and Collins Citation2005; Zheng Citation2014; Luo, Zheng, and Zhu Citation2017).
A 600-year pre-industrial climate control was performed, and the analysis concentrated on prominent climate variables such as surface wind, SST, and SLP over the tropical Pacific. For comparison, we used monthly surface wind, SLP, and precipitation from NCEP–NCAR (1961–2010) (Kalnay et al. Citation1996). The dataset of the SST anomalies (1961–2010) is the same as that in Wan, Ren, and Wu (Citation2018).
In this work, we first performed an EOF analysis on the surface wind anomalies, followed by linear regression. In addition, we applied composite and spectral analysis in the same way as that in Stuecker et al. (Citation2013) and Zhang et al. (Citation2016b). The winter of the El Niño developing phase was defined as December–January–February (DJF(0)), and the decaying months in the following spring were defined as March–April–May (MAM(1)).
3. Results
3.1. Dimensional distribution of the C-mode in the simulation
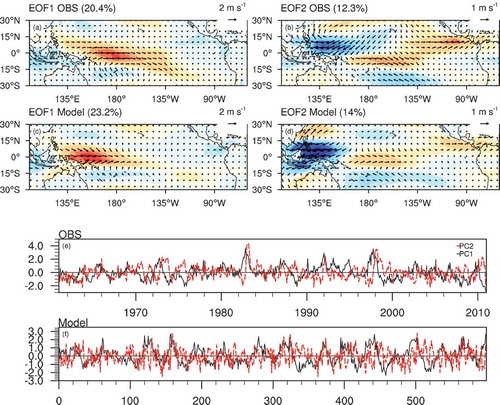
We conducted EOF analysis on the surface wind anomaly over the Pacific (10°S–10°N, 100°E–60°W). The results reveal that the first EOF (EOF1) comprises the tropically quasi-symmetric surface wind anomalies over the western-central Pacific that are related to ENSO and feature the anomalous Walker circulation. Specifically, the westerly wind anomalies in the model extend into the western Pacific slightly too far compared to the observation. Moreover, the first principle component (PC1; ENSO signal) of the model describes a significant interannual variability, and each peak of PC1 corresponds to an El Niño event ( and ).
Figure 1. The leading two EOF patterns of surface wind modes. Panels (a–d) show the wind anomalies (units: m s−1) over the tropical Pacific from (a, b) observed and (c, d) simulated data obtained by an EOF decomposition. The shading indicates the regressed zonal wind anomalies. Panels (e, f) are the normalized PCs for observations and the model.
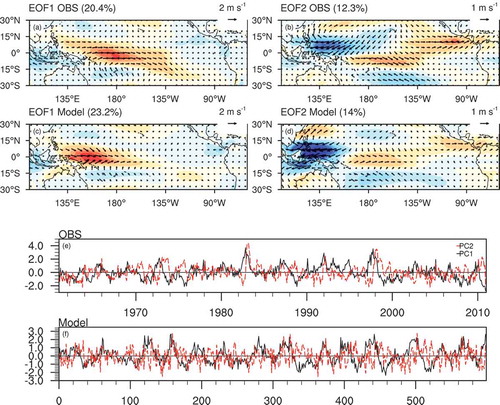
In combination with the positive phase of the second principle component (PC2; C-mode signal), the second EOF (EOF2) catches the WNPAC and the central South Pacific anomalous cyclone and features the atmospheric structure of the C-mode, which is in good agreement with the observation. This meridional antisymmetric wind pattern of the C-mode is generated from the annual cycle of SST and ENSO variability (Stuecker et al. Citation2013). It is worth noting that the WNPAC in the model moves slightly too far westward compared to that in the observation.
3.2. Asymmetric SST and SLP response of the C-mode in the simulation
We regressed the SST anomalies as well as the SLP anomalies onto PC1 and PC2 in the simulation validated by the observation (). The dimensional patterns of SST and SLP associated with the first pattern (ENSO mode) as well as the second pattern (C-mode) are successfully described by the model. However, the simulated warm center associated with ENSO over the tropical central-eastern Pacific is larger and spreads to the western Pacific in contrast to the observation. A previous study described the structure of the SST anomaly over the tropical Pacific and explained that it was quite realistic; however, its reach into the western Pacific was slightly too far away (Zheng Citation2014). Similarly, the simulated warm center associated with the C-mode over the tropical eastern Pacific is larger as well ()), which is partly attributable to the stronger simulation of this ENSO mode. Previous work noted that models with better performance in simulating realistic ENSO are more likely to reproduce the C-mode more realistically (Ren et al. Citation2016). However, ECHAM5/MPI-OM tends to emphasize the warm SST anomaly in the western Pacific (Zheng Citation2014), which is largely responsible for the warm center associated with the C-mode over the tropical eastern Pacific.
Figure 2. SST (shading; units: °C) and SLP (contours; units: mb) anomalies regressed onto (a, b) PC1 and (c, d) PC2 for (a, c) observation and (b, d) the model (right). Values exceeding the 95% confidence level are displayed.
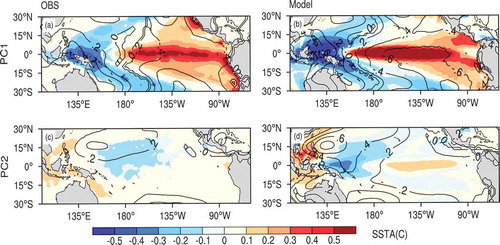
At the same time, the simulation of SLP in both first two modes is stronger than that in the observation. Considering the meridional coarse resolution in the tropical ocean, the atmospheric role is prevailing in controlling major features of interannual SST variability, as in previous work (Gualdi et al. Citation2003; Guilyardi et al. Citation2004), which shapes the important characteristics of the interannual SLP variability.
3.3. Phase-locking and power spectrum
As shown in previous studies, the C-mode takes an essential part in the rapid transition of strong El Niño (Vecchi Citation2005; Vecchi and Harrison Citation2003; Lengaigne et al. Citation2006) and in establishing the WNPAC (Wang, Wu, and Lukas Citation1999; Stuecker et al. Citation2013). Hence, the composite seasonal evolution of ENSO and the C-mode are illustrated in ). The El Niño events were selected following the same principle as shown in previous work (Zheng Citation2014). The composite analysis of El Niño events describes a seasonal evolution of a typical El Niño event, which develops in spring or summer, reaches a peak in autumn or winter, and decays in the following spring. Different from ENSO, the C-mode is negative in the El Niño developing autumn and then suddenly turns to positive, causing the peak to arrive in late winter or early spring and the decay in summer or early fall together with the El Niño mature stage (McGregor et al. Citation2012). Furthermore, the peak phase of the C-mode is consistent with ENSO, causing a delay of approximately two or three months compared with ENSO and showing a shorter cycle (Stuecker et al. Citation2013, Citation2015). The simulated C-mode resembles the observations well.
Figure 3. (a) PC1 (solid) and PC2 (dashed) composites of seasonal evolution in El Niño events for observation (black) and the model (red). (b, c) Power spectrum for (b) observation and (c) the model. The dashed black/red lines indicate the 95% confidence interval for PC1/PC2. The grey rectangles indicate the near-annual combination tone frequency bands.
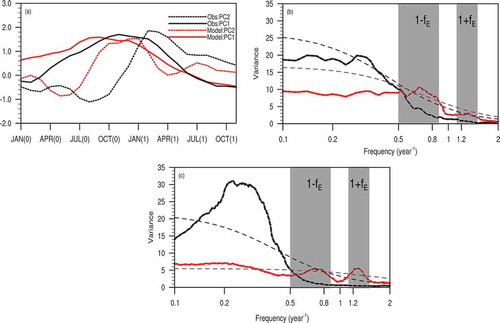
To further explain the connection between ENSO and the C-mode in the model, we calculated the power spectrum ( and ). The spectral peaks of ENSO reveal obvious variability mainly in the interannual period of 2–8 years, as shown in previous studies (Stuecker et al. Citation2013). Moreover, the spectral peaks of PC2 (C-mode signal) at frequencies 1 − fE or 1 + fE (1 denotes the annual frequency and fE the frequency band of ENSO varying from 1/2 yr−1 to 1/8 yr−1) are characteristic of the C-mode that stems from the interaction between ENSO and the annual cycle (Stuecker et al. Citation2013). However, the peak frequency bands of the C-mode in the longer periods in the model overlap with ENSO, which is likely because the simulated ENSO mode is imperfect.
3.4. Simulated C-mode influences on seasonal precipitation over Southern China
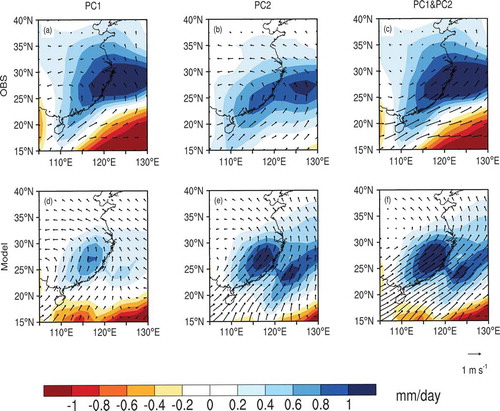
Previous studies have revealed that ENSO has played a limited role in winter precipitation anomalies over southern China since the late 1990s (Geng et al. Citation2017; Jia and Ge Citation2017; Xu et al. Citation2018). In addition, the yearly air–sea interaction is critical in capturing the climate anomalies over East Asia related to ENSO, especially the seasonal precipitation anomalies over China associated with the C-mode (Li, Zhang, and He Citation2016; Zhang et al. Citation2016b). While Zhang et al. (Citation2016b) and Li, Zhang, and He (Citation2016) recommended that the C-Mode has a positive influence on spring precipitation in southern China, the decadal variation in this positive influence has been less well studied. Therefore, we checked the ability of ECHAM5/MPI-OM to reproduce the ENSO-related seasonal rainfall over southern China. Using the ENSO signal alone can partially reconstruct precipitation anomalies in southern China ()), and when including the influence of the C-mode the winter rainfall over southern China can be better disclosed by the model ()). However, regardless of whether the ENSO or C-mode signal is used alone or together, the model is unable to reproduce the precise winter precipitation for southern China but appears to be able to reproduce it for the Yangtze River Valley (-), because of the westward movement of both the simulated ENSO and the C-mode ( and ). In the following spring, the positive precipitation anomalies extend from southern China to East China ()). When we consider the ENSO signal alone, only a small part of the positive precipitation anomalies appears in the east. Including the C-mode can significantly improve the reconstruction of rainfall in East China ()). Notably, the large-value areas with positive precipitation anomalies in the model obviously move westward, likely attributable to the simulated ENSO and the C-mode both moving westward. Hence, these results indicate that wintertime and springtime rainfall in southern China related to ENSO can be relatively realistic demonstrated by applying the ECHAM5/MPI-OM outputs.
Figure 4. Precipitation (color shading; units: mm d−1) and 850-hPa wind (vectors; units: m s−1) anomalies during winter using linear regression for observation with (a) PC1, (b) PC2, and (c) both PC1 and PC2. (d–f) As in (a–c) but for the model.
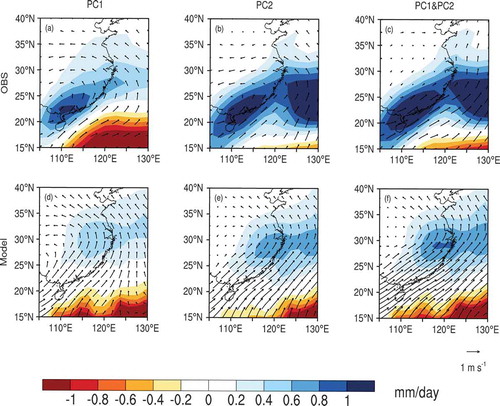
Figure 5. Precipitation (color shading; units: mm d−1) and 850-hPa wind (vectors; units: m s−1) anomalies during the following spring using linear regression for observation with (a) PC1, (b) PC2, and (c) both PC1 and PC2. (d–f) As in (a–c) but for the model.
4. Conclusions and discussion
In this paper we discuss the C-mode and its influences on seasonal precipitation over southern China as simulated by ECHAM5/MPI-OM. The results reveal that ECHAM5/MPI-OM can catch the dimensional distribution of ENSO as well as the C-mode associated with atmospheric and oceanic anomalies; however, the simulated ENSO mode moves slightly westward, which contributes dominantly to the behavior in simulating the C-mode, and the wintertime and springtime precipitation over southern China moving westward. In addition, this climate model not only can capture the rapid transition of the C-mode during late winter but also its spectral peaks near the annual cycle. However, the model reproduces the unreasonable power spectra in longer periods of the C-mode, perhaps because the performance of the ENSO mode is not ideal in the model.
This C-mode is of great value both in the termination of large El Niño events and in the development of the WNPAC, which also has a crucial part in the advance of ENSO-related climate anomalies, particularly related to East Asian seasonal precipitation. In addition, our work suggests that the C-mode is crucial in affecting wintertime and springtime rainfall over southern China during El Niño events, which are relatively realistically described by ECHAM5/MPI-OM. Improving the skill of simulating and predicting the seasonal precipitation anomalies over southern China related to the C-mode is of great importance to deepening our understanding of the mechanisms of East Asian seasonal precipitation. To achieve such a goal, it is essential to improve the ability of the model to replicate the precipitation climatology and the basic ENSO variability (Wan, Ren, and Wu Citation2018). For example, a more comprehensive initialization and a better availability of observations could be good choices to enhance the performance of the model to reproduce practical ENSO predictions (Zheng, Zhu, and Zhang Citation2007; Zheng et al. Citation2009; Zhu et al. Citation2013).
Disclosure statement
No potential conflict of interest was reported by the authors.
Additional information
Funding
References
- Alexander, M. A., I. Bladé, M. Newman, J. R. Lanzante, N.-C. Lau, and J. D. Scott. 2002. “The Atmospheric Bridge: The Influence of ENSO Teleconnections on Air-Sea Interaction over the Global Oceans.” Journal of Climate 15 (16): 2205–2231. doi:10.1175/1520-0442(2002)015<2205:TABTIO>2.0.CO;2.
- Du, Y., S. Xie, G. Huang, and K. Hu. 2009. “Role of Air–Sea Interaction in the Long Persistence of El Niño–Induced North Indian Ocean Warming.” Journal of Climate 22 (8): 2023–2038. doi:10.1175/2008jcli2590.1.
- Geng, X., W. Zhang, M. F. Stuecker, P. Liu, -F.-F. Jin, and G. Tan. 2017. “Decadal Modulation of the ENSO-East Asian Winter Monsoon Relationship by the Atlantic Multidecadal Oscillation.” Climate Dynamics 49: 1–14. doi:10.1007/s00382-016-3465-0.
- Gualdi, S., A. Navarra, E. Guilyardi, and P. Delecluse. 2003. “Assessment of the Tropical Indo-Pacific Climate in the SINTEX CGCM.” Annales geophysicae 46 :1–26. doi:10.4401/ag-3385.
- Guilyardi, E., S. Gualdi, J. Slingo, A. Navarra, P. Delecluse, J. Cole, G. Madec, M. Roberts, M. Latif, and L. Terray. 2004. “Representing El Niño in Coupled Ocean Atmosphere GCMs: The Dominant Role of the Atmospheric Component.” Journal of Climate 17 (24): 4623–4629. doi:10.1175/JCLI-3260.1.
- Jia, X., and J. Ge. 2017. “Interdecadal Changes in the Relationship between ENSO, EAWM, and the Wintertime Precipitation over China at the End of the Twentieth Century.” Journal of Climate 30 (6): 1923–1937. doi:10.1175/JCLI-D-16-0422.1.
- Jungclaus, J. H., N. Keenlyside, M. Botzet, H. Haak, J. J. Luo, M. Latif, J. Marotzke, U. Mikolajewicz, and E. Roeckner. 2006. “Ocean Circulation and Tropical Variability in the Coupled Model ECHAM5/MPI-OM.” Journal of Climate 19 (16): 3952–3972. doi:10.1175/JCLI3827.1.
- Kalnay, E., M. Kanamitsu, R. Kistler, W. Collins, D. Deaven, L. Gandin, M. Iredell, S. Saha, G. White, and J. Woollen. 1996. “The NCEP/NCAR 40-Year Reanalysis Project.” Bulletin of the American Meteorological Society 77 (3): 437–472. doi:10.1175/1520-0477(1996)077<0437:TNYRP>2.0.CO;2.
- Keenlyside, N., M Latif, M. Botzet, and J. Jungclaus. 2005. “A Coupled Method for Initialising ENSO Forecasts Using SST.” Tellus 57A :340–356. doi:10.1111/j.1600-0870.2005.00107.x.
- Keenlyside, N. S., M. Latif, J. Jungclaus, L. Kornblueh, and E. Roeckner. 2008. “Advancing Decadal-Scale Climate Prediction in the North Atlantic Sector.” Nature 453 (7191): 84–88. doi:10.1038/nature06921.
- Lengaigne, M., J.-P. Boulanger, C. Menkes, and H. Spencer. 2006. “Influence of the Seasonal Cycle on the Termination of El Niño Events in a Coupled General Circulation Model.” Journal of Climate 19 (9): 1850–1868. doi:10.1175/jcli3706.1.
- Li, H., W. Zhang, and J. He. 2016. “Influences of ENSO and Its Combination Mode on Seasonal Precipitation over Eastern China.” Acta Meteorologica Sinica 74 (3): 322–334.
- Li, H., W. Zhang, J. He, and Y. Wang. 2016. “Influence of SST Annual Cycle on Local Air-Sea Processes during El Niño Events.” Acta Oceanologica Sinica 38 (1): 56–68.
- Luo, H., F. Zheng, and J. Zhu. 2017. “Evaluation of Oceanic Surface Observation for Reproducing the Upper Ocean Structure in ECHAM5/MPI‐OM.” Journal of Geophysical Research Oceans 122 (12): 9695–9711. doi:10.1002/2017JC013413.
- Marsland, S. J., H. Haak, J. H. Jungclaus, M. Latif, and F. Röske. 2003. “The Max-Planck-Institute Global Ocean/Sea Ice Model with Orthogonal Curvilinear Coordinates.” Ocean Modelling 5 (2): 91–127. doi:10.1016/S1463-5003(02)00015-X.
- McGregor, S., A. Timmermann, N. Schneider, M. F. Stuecker, and M. H. England. 2012. “The Effect of the South Pacific Convergence Zone on the Termination of El Niño Events and the Meridional Asymmetry of ENSO.” Journal of Climate 25 (16): 5566–5586. doi:10.1175/JCLI-D-11-00332.1.
- Neelin, J. D., D. S. Battisti, A. C. Hirst, -F.-F. Jin, Y. Wakata, T. Yamagata, and S. E. Zebiak. 1998. “ENSO Theory.” Journal of Geophysical Research Oceans 103 (C7): 14261–14290. doi:10.1029/97JC03424.
- Oldenborgh, G. J. V., S. Y. Philip, and M. Collins. 2005. “El Niño in a Changing Climate: A Multi-Model Study.” Ocean Science 1 (2): 81–95. doi:10.5194/os-1-81-2005.
- Philander, S. G., A. Rogério Dos Santos, and E. A. Alex Soares de Souza. 1990. “El-Nino, La Nina and the Southern Oscillation.” International Geophysics Series 46: 293. doi:10.1017/CBO9781107415324.004.
- Ren, H., J. Zuo, F. Jin, and M. F. Stuecker. 2016. “ENSO and Annual Cycle Interaction: The Combination Mode Representation in CMIP5 Models.” Climate Dynamics 46: 3753–3765. doi:10.1007/s00382-015-2802-z.
- Ropelewski, C. F., and M. S. Halpert. 1987. “Global and Regional Scale Precipitation Patterns Associated with the El Niño/Southern Oscillation.” Monthly Weather Review 115 (8): 1606–1626. doi:10.1175/1520-0493(1987)115<1606:GARSPP>2.0.CO;2.
- Stuecker, M. F., -F.-F. Jin, A. Timmermann, and S. McGregor. 2015. “Combination Mode Dynamics of the Anomalous Northwest Pacific Anticyclone.” Journal of Climate 28 (3): 1093–1111. doi:10.1175/JCLI-D-14-00225.1.
- Stuecker, M. F., A. Timmermann, F. Jin, S. McGregor, and H.-L. Ren. 2013. “A Combination Mode of the Annual Cycle and the El Nino/Southern Oscillation.” Nature Geoscience 6 (7): 540–544. doi:10.1038/ngeo1826.
- Trenberth, K. E., and J. M. Caron. 2000. “The Southern Oscillation Revisited: Sea Level Pressures, Surface Temperatures, and Precipitation.” Journal of Climate 13 (24): 4358–4365. doi:10.1175/1520-0442(2000)013<4358:tsorsl>2.0.co;2.
- Vecchi, G. A. 2005. “The Termination of the 1997 98 El Niño. Part II: Mechanisms of Atmospheric Change.” Journal of Climate 19 (12): 2647–2664. doi:10.1175/JCLI3780.1.
- Vecchi, G. A., and D. E. Harrison. 2003. “On the Termination of the 2002–03 El Niño Event.” Geophysical Research Letters 30 (18): 1–4. doi:10.1029/2003GL017564.
- Wan, J., H. Ren, and P. Wu. 2018. “Representation of the ENSO Combination Mode and Its Asymmetric SST Response in Different Resolutions of HadGEM3.” Advances in Atmospheric Sciences 35 (8): 1063–1076. doi:10.1007/s00376-018-7285-5.
- Wang, B., R. Wu, and R. Lukas. 1999. “Role of the Western North Pacific Wind Variation in Thermocline Adjustment and ENSO Phase Transition.” Journal of the Meteorological Society of Japan 77: 1–16. doi:10.2151/jmsj1965.77.1_1.
- Weisheimer, A., F. J. Doblas-Reyes, T. N. Palmer, A. Alessandri, A. Arribas, M. Déqué, N. Keenlyside, M. Macvean, A. Navarra, and P. Rogel. 2009. “ENSEMBLES: A New Multi‐Model Ensemble for Seasonal‐To‐Annual predictions—Skill and Progress beyond DEMETER in Forecasting Tropical Pacific SSTs.” Geophysical Research Letters 36 (21): 147–148. doi:10.1029/2009gl040896.
- Wolff, J.-O., E. Maier-Reimer, and S. Legutke. 1997. “The Hamburg Ocean Primitive Equation Model HOPE.” Technical Report 13, German Climate Computer Cernter (DKRZ), Hamburg, 98 pp.
- Xu, K., Q. Huang, C. Y. Tam, W. Wang, S. Chen, and C. Zhu. 2018. “Roles of Tropical SST Patterns during Two Types of ENSO in Modulating Wintertime Rainfall over Southern China.” Climate Dynamics 1–16. doi:10.1007/s00382-018-4170-y.
- Zhang, R., Q. Min, and J. Su. 2017. “Impact of El Niño on Atmospheric Circulations over East Asia and Rainfall in China: Role of the Anomalous Western North Pacific Anticyclone.” Science China Earth Sciences 60 (6): 1124–1132. doi:10.1007/s11430-016-9026-x.
- Zhang, W., F. Jin, M. F. Stuecker, A. T. Wittenberg, A. Timmermann, H.-L. Ren, J.-S. Kug, W. Cai, and M. Cane. 2016a. “Unraveling El Nino’s Impact on the East Asian Monsoon and Yangtze River Summer Flooding.” Geophysical Research Letters 43 (21): 11375–11382. doi:10.1002/2016gl071190.
- Zhang, W., H. Li, M. F. Stuecker, F. Jin, and A. G. Turner. 2016b. “A New Understanding of El Niño’s Impact over East Asia: Dominance of the ENSO Combination Mode.” Journal of Climate 29 (12): 4347–4359. doi:10.1175/JCLI-D-15-0104.1.
- Zheng, F. 2014. “ENSO Variability Simulated by a Coupled General Circulation Model:ECHAM5/MPI-OM.” Atmospheric & Oceanic Science Letters 7 (5): 471–475. doi:10.3878/j.issn.1674-2834.14.0014.
- Zheng, F., J. Zhu, H. Wang, and R. H. Zhang. 2009. “Ensemble Hindcasts of ENSO Events over the past 120 Years Using a Large Number of Ensembles.” Advances in Atmospheric Sciences 26 (2): 359–372. doi:10.1007/s00376-009-0359-7.
- Zheng, F., J. Zhu, and R. Zhang. 2007. “Impact of Altimetry Data on ENSO Ensemble Initializations and Predictions.” Geophysical Research Letters 34 (13): 256–260. doi:10.1029/2007gl030451.
- Zhu, J., B. Huang, M. A. Balmaseda, J. L. Kinter, P. Peng, -Z.-Z. Hu, and L. Marx. 2013. “Improved Reliability of ENSO Hindcasts with Multi-Ocean Analyses Ensemble Initialization.” Climate Dynamics 41 (9–10): 2785–2795. doi:10.1007/s00382-013-1965-8.