
 ?Mathematical formulae have been encoded as MathML and are displayed in this HTML version using MathJax in order to improve their display. Uncheck the box to turn MathJax off. This feature requires Javascript. Click on a formula to zoom.
ABSTRACT
The number concentrations and drop size distributions (DSDs) of warm-rain hydrometeors play an important role in the simulation of microphysical processes. To evaluate the performance of the WDM6 scheme, which predicts the cloud number concentration (Nc) explicitly in aspects of warm-rain hydrometeors number concentrations and DSDs, the simulation of the WDM6 scheme is compared with airborne observations of a flight trial, as well as with the simulations of the Thompson scheme and Morrison scheme. Results show that the WDM6 scheme produces smaller (larger) cloud (rain) number concentrations and wider cloud DSDs compared to the observations, with the largest biases at upper levels of stratiform cloud (SC). The Thompson scheme and the Morrison scheme, both of which set the Nc as a constant, compare better to the observations than the WDM6 scheme in aspects of Nc and DSD. Sensitivity tests of the initial cloud condensation nuclei (CCN) number concentration (CCN0) of the WDM6 scheme show that a better choice of the initial CCN0 may improve the simulation of convective cloud but helps little in terms of SC. The simulation of rain number concentration and DSD is not sensitive to the CCN0 in the WDM6 scheme.
GRAPHICAL ABSTRACT
摘要
暖云粒子数浓度及粒子谱对微物理过程的模拟有着重要影响,不同于许多微物理方案,WDM6方案显示预报云滴数浓度。为评估其模拟效果,本文对比了WDM6方案与Thompson方案、Morrison方案在一次飞机观测试验中的模拟结果。结果表明:相比于观测结果,WDM6方案模拟云(雨)滴数浓度偏小(大),云滴谱较宽,特别是对于层状云中上部的模拟偏差较大。尽管Thompson方案和Morrison方案将云滴数浓度设置为常数,但这两种方案的云滴数浓度及云滴谱却更接近于观测。对于WDM6方案初始云凝结核数目(CCN0)的敏感性试验表明,改变CCN0能够改进WDM6方案对于对流云的模拟,但对于层状云的模拟结果影响较小。
1. Introduction
Instead of only predicting mixing ratios of cloud hydrometeors in single-moment bulk microphysics schemes (Kessler Citation1969; Tao, Simpson, and McCumber Citation1989; Chen and Sun Citation2002), double-moment schemes (Reisner, Rasmussen, and Bruintjes Citation1998; Cohard and Pinty Citation2000; Seifert and Beheng Citation2001) also predict number concentrations of hydrometeors. The prediction of mixing ratios and number concentrations at the same time in double-moment schemes provides flexibility in the description of drop size distribution (DSD) and the ability to reproduce size-sorting (Milbrandt and Yau Citation2005a). The number concentrations and DSDs of warm-rain particles play an important role in the simulation of microphysical processes and the macrophysical properties of weather systems. Ferrier, Tao, and Simpson (Citation1995) and Li et al. (Citation2009) claimed that the evaporation rate affected by the rain number concentration (Nr) is decisive in the difference in downdraft and storm structure simulation. Lim and Hong (Citation2010) and Morrison, Thompson, and Tatarskii (Citation2009) also found that the simulation of trailing stratiform precipitation was mainly influenced by Nr and the corresponding evaporation rate in an idealized 2D squall line case. The cloud number concentration (Nc) affects both warm-rain and cold-rain microphysical processes. Typically, an increase in Nc leads to a narrower cloud DSD and smaller mean diameter of cloud droplets. This inhibits the autoconversion and delays the onset of precipitation, and meanwhile, more cloud droplets can be transferred to upper levels to intensify cold-rain processes (Rosenfeld et al. Citation2008; Fan et al. Citation2016).
Lim and Hong (Citation2010) developed the WDM6 scheme, which was claimed to outperform its single-moment counterpart (Hong and Lim Citation2006) in both idealized and real case simulations (Hong et al. Citation2010; Lim and Hong Citation2010). Some double-moment schemes, such as the Thompson scheme (Thompson et al. Citation2008) and the Morrison scheme (Morrison, Thompson, and Tatarskii Citation2009), set Nc as a constant. Different from these schemes, WDM6 predicts the Nc and has been used to study the effects of aerosol on the simulation of weather systems (Lim and Hong Citation2010; Lim et al. Citation2011; Dong, Xu, and Luo Citation2012). Meanwhile, the WDM5 scheme and the newly released WDM7 scheme in the Weather Forecasting and Research (WRF) model are similar to the WDM6 scheme in the calculation of warm-rain hydrometeors. However, little attention has been devoted to the accuracy of Nc simulation in these schemes.
In this study, the warm-rain hydrometeor number concentrations and DSDs simulated by the WDM6 scheme are compared with airborne observations of a flight trial, as well as the simulations of the widely tested Thompson and Morrison schemes, to evaluate the performance of the WDM6 scheme. The paper is organized as follows: Section 2 describes the flight trial and model configuration. Comparisons of warm-rain hydrometeor number concentrations and DSDs, along with the results of sensitivity tests of initial cloud condensation nuclei (CCN) number concentration (CCN0) of the WDM6 scheme, are presented in section 3. A summary of the present findings and suggestions for future work is given in the final section.
2. Description of the flight trial and model configuration
2.1 Flight trial description
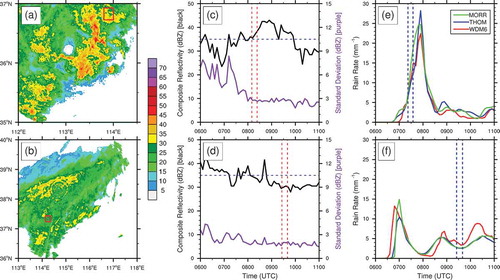
A flight trial was conducted on 22 May 2017 in Hebei Province, China, with five periods of observation mainly concentrated in the area of 2–7 km in height and −20°C to 10°C in temperature. Three airborne DSD probes (a cloud droplet probe (CDP), cloud imaging probe (CIP) and high-volume precipitation spectrometer (HVPS)), along with an aircraft-integrated meteorological measurement system (AIMMS-20) recording environmental information such as geolocation, height, temperature, etc., were used during the flight trial. Details of the instruments are shown in . The locations of the second and fourth periods of observation are presented in and ), marked by the red boxes along with the radar composite reflectivity. The second period of observation was regarded as the observation of a convective cloud (CC), since the radar composite reflectivity was over 30 dBZ in most parts, with the maximum exceeding 35 dBZ, which could be taken as the threshold of a convective echo. The fourth period of observation, with a uniform reflectivity of 20 dBZ, was regarded as the observation of a stratiform cloud (SC).
Table 1. Description of instruments used in the flight trial.
Figure 1. Observed radar composite reflectivity and simulated rain rate: (a, b) composite reflectivity, with the red box marking the location of the observation; (c, d) time series of maximum and standard deviation of observed composite reflectivity, in which the dashed red lines represent the start time and end time of the observation; (e, f) time series of the simulated rain rate, in which the dashed blue lines represent the start time and end time of the model output used for comparison. The first and second rows represent the results of the convective cloud and stratiform cloud, respectively.
2.2 Model configuration
The model used in this study was the WRF model, version 3.6, the model configuration of which is presented in . The microphysics schemes used in this study included the WDM6 scheme, the Thompson scheme and the Morrison scheme. Detailed description of these schemes can be found in Lim and Hong (Citation2010), Thompson et al. (Citation2008), and Morrison, Thompson, and Tatarskii (Citation2009), respectively. The activation of CCN in the WDM6 scheme follows Twomey (Citation1959):
Table 2. Model configuration.
Here, na is activated CCN0 (NCCN) and S is supersaturation; C is the total CCN; k is a parameter that can be devised from observations and is set to 0.6 in this case (Khairoutdinov and Kogan Citation2000). The CCN0 of the WDM6 scheme was set to 103 cm−3 at a supersaturation of 0.48% (Smax), and thus Equation (1) could be written as
at the beginning of the simulation. The Nc was set to 300 cm−3 in both the Thompson scheme and the Morrison scheme, as recommended for continental systems. The time series of simulated rain rate was compared with that of the reflectivity and model output of 48 min before the convective observation was used for the comparison, since the reflectivity indicated that the CC was in the developing stage.
3. Results and discussion
3.1 Comparisons with observations and other schemes
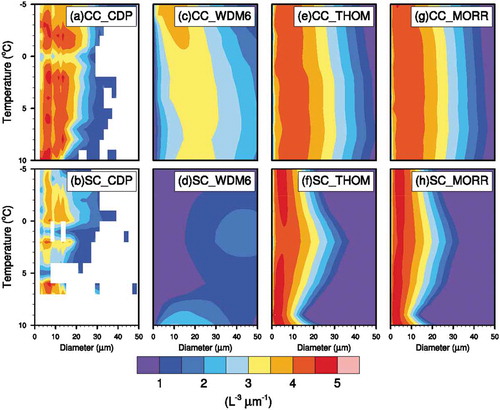
The observed and simulated cloud DSDs are presented in . The plane’s movement during the observation period would have mainly been a spiral pattern while ascending or descending. As a result, the plane could have been outside of the clouds some of the time, leading to discontinuity in the observations, as shown in and ). Generally, an aerosol-aware scheme should be more sophisticated and do a better job than microphysics schemes with a constant droplet number concentration. However, the results of the WDM6 scheme are distinct from the observations and the other two schemes, especially in the SC. The cloud DSDs of the WDM6 scheme are wider than observed. Most cloud droplets have a diameter of 10–30 μm in the WDM6 scheme simulation, while most are concentrated within 5–20 μm in the observation. The cloud DSDs of the WDM6 scheme noticeably broaden above 7°C, which is not observed or simulated by the other two schemes in the SC. The relatively poor performance of the WDM6 scheme might be because of the use of the somewhat simplistic Twomey’s CCN activation formula, in which the activated NCCN is only determined by the supersaturation. In fact, the supersaturation in contact with CCN, which relies on the vertical velocity, temperature, pressure, etc., is usually not well predicted at grid scale in 3D mesoscale models (Cohard and Pinty Citation2000). Clearer illustrations are shown in ). Generally, the Thompson scheme and the Morrison scheme are consistent with each other in both the CC and SC, though the cloud DSDs of the Morrison scheme are slightly narrower. The Thompson (Morrison) scheme compares well with the observation in the CC and is larger in magnitude at upper levels and narrower at lower levels, as shown in and ), in the SC. Note that this study is mainly focused on the warm parts of clouds, since the DSD probes used on the flight could not distinguish between liquid particles and ice particles.
Figure 2. Contours of cloud DSD. The first and second rows represent the results of the convective cloud (CC) and stratiform cloud (SC), respectively. Columns 1–4 respresent the results based on observation (cloud droplet probe), the WDM6 simulation, the Thompson simulation, and the Morrison simulation, respectively.
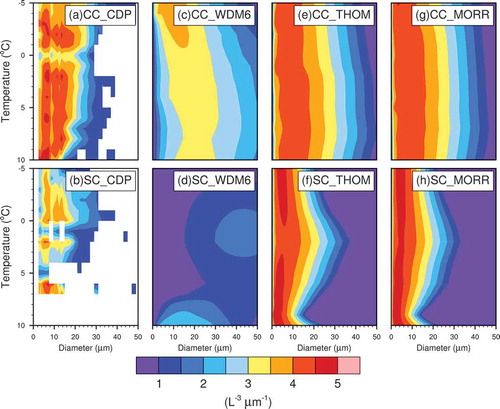
Figure 3. Observed and simulated cloud DSDs and number concentrations: (a, b) cloud DSD of the convective cloud (CC) and stratiform cloud (SC) at 3°C, respectively; (c, d) cloud DSD of the CC and SC at 7°C, respectively; (e, f) cloud number concentration (Nc) of the CC and SC, respectively.
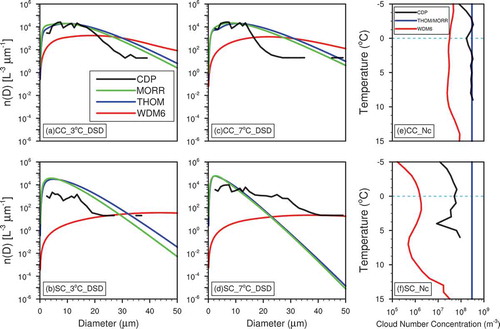
The Nc results shown in and ) provide a similar conclusion as from the cloud DSD results. The WDM6 scheme underestimates Nc, especially in the SC. The extremely low Nc of the WDM6 scheme in the SC above 7°C corresponds to the extremely wide cloud DSD. The constant Nc set in the Thompson scheme and the Morrison scheme is reasonable in the CC and approximately five times larger in the SC compared to the observations.
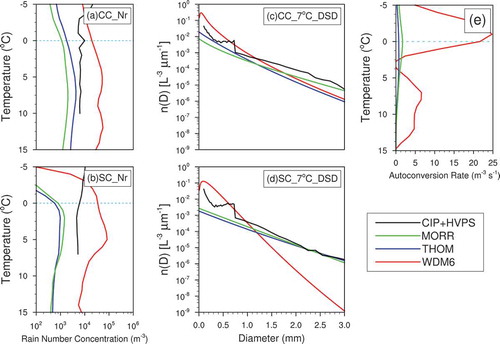
The observed and simulated Nr and rain DSDs at 7°C are presented in . The 7°C level was chosen since the rain DSD observation near the melting layer may be affected by unmelted ice particles, thus becoming less accurate. The WDM6 scheme overestimates, while the other two schemes underestimate, the Nr compared to the observations. The observations of rain DSDs are composed of the CIP observations of 100–750 μm and the HVPS observations of 750–3000 μm, considering their best measuring ranges. The Nr of the Thompson (Morrison) scheme is smaller in the SC than the CC, which is consistent with many observations and model simulations (Ferrier, Tao, and Simpson Citation1995; Tokay and Short Citation1996; Gong, Liu, and Li Citation1997; Morrison, Thompson, and Tatarskii Citation2009), though the difference between different clouds for this flight trial is small. The Thompson scheme and Morrison scheme underestimate the quantity of small raindrops in both the SC and CC compared to the WDM6 scheme, possibly because of the underestimation of autoconversion processes (shown in )) owing to the overestimation of Nc. On the contrary, the WDM6 scheme produces notably fewer large raindrops in the SC.
Figure 4. Observed and simulated rain number concentration (Nr) and rain DSD, together with the average autoconversion rate: (a, b) Nr of the convective cloud (CC) and stratiform cloud (SC), respectively; (c, d) rain DSD at 7°C of the CC and SC, respectively; (e) autoconversion rate of Nr averaged during the total simulation period in domain 3.
3.2 Sensitivity tests of the initial CCN0 of the WDM6 scheme
As mentioned by several researchers (Khain, Rosenfeld, and Pokrovsky Citation2005; Cheng, Wang, and Chen Citation2010; Fan et al. Citation2012), an increase in the NCCN will lead to a larger Nc and a narrower cloud DSD. The NCCN observed in North China lies mostly between 103 and 104 cm−3, with a maximum value exceeding 4 × 104 cm−3 at a supersaturation of 0.4%–0.6% (Shi and Duan Citation2007; Wang et al. Citation2013). Here, four experiments with different CCN0 values of 103, 5 × 10³, 104, and 105 cm−3 were conducted to examine if the smaller Nc and narrower cloud DSD produced by the WDM6 scheme is caused by an inappropriate selection of CCN0.
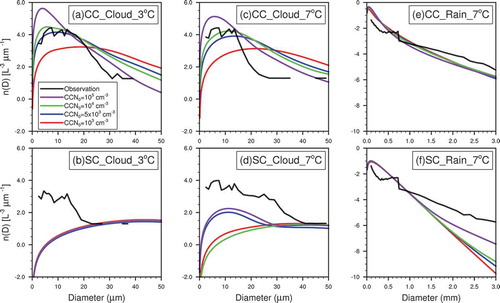
The average profiles of simulated Nc and Nr in the CC, SC, and whole of domain 3 (D03), using the WDM6 scheme with different CCN0, are shown in . The results show that an increase in CCN0 leads to an increase in the domain-average Nc, while the responses of the Nc vary with cloud type. At SC upper levels, Nc is still substantially underestimated, even if the CCN0 is increased 100-fold, which could also be limited by the prediction of supersaturation. As a result, an increase in the CCN0 is unable to improve the cloud DSD in the SC. In the CC, both the Nc and cloud DSDs agree better with the observations when the CCN0 is set to 104 cm−3 as shown in and, although this value is within the range of NCCN observation, more case studies are needed for a more comprehensive evaluation of the best CCN0 to select. Nr varies little when the CCN0 is increased from 103 to 105 cm−3, which is consistent with the findings of Lim and Hong (Citation2010).
Figure 5. Average cloud number concentration (Nc) and rain number concentration (Nr) under a differing initial CCN number concentration (CCN0) in different areas. The first and second rows represent Nc and Nr, respectively. Columns 1–3 show the average for the convective cloud (CC), stratiform cloud (SC), and domain 3, respectively.
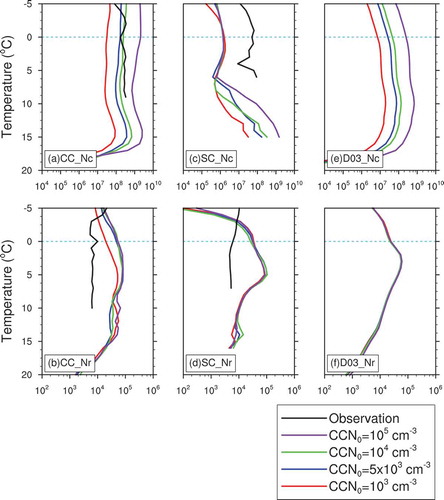
Figure 6. Cloud and rain DSDs of different cloud types and levels: (a, b) cloud DSDs of the convective cloud (CC) and stratiform cloud (SC) at 3°C, respectively; (c, d) cloud DSDs of the CC and SC at 7°C, respectively; (e, f) rain DSDs of the CC and SC at 7°C, respectively.
4. Summary and future work
In this study, the performance of the WDM6 scheme in the simulation of warm-rain hydrometeor Nc and DSD is compared with airborne observations from a flight trial and other two double-moment bulk schemes.
The results show that the WDM6 scheme underestimates (overestimates) the cloud (rain) number concentration. The Nc is predicted in the WDM6 scheme, while it is set as a constant in the Thompson scheme and Morrison scheme. The WDM6 scheme performs worse than the Thompson scheme and Morrison scheme in aspects of Nc and DSD compared to the airborne observations. Sensitivity tests of the initial CCN0 in the WDM6 scheme indicate that changing the initial CCN0 provides a possible way to improve the simulation of Nc and DSD in CC, whereas it does not help much in SC simulation.
Unfortunately, the observations of this flight trial, covering only a small part of the clouds in both time and space, were discontinuous in height. As a result, our comparisons were restricted to certain specific levels. In future work, more observations from other sources, such as conventional surface observations, surface distrometers, and dual-polarization radar, should be used to obtain a more comprehensive conclusion. The Nc simulated by the WDM6 scheme is expected to be more accurate because it is predicted explicitly, but the present results indicate that more efforts are needed to improve its performance. In future work, other aerosol-aware microphysics schemes (i.e. Milbrandt and Yau Citation2005b; Thompson and Eidhammer Citation2014) using different CCN activation formula will also be evaluated.
Acknowledgments
The authors thank the anonymous reviewers for their constructive comments.
Disclosure statement
No potential conflict of interest was reported by the authors.
Additional information
Funding
References
- Chen, S.-H., and W.-Y. Sun. 2002. “A One-dimensional Time Dependent Cloud Model.” Journal of the Meteorological Society of Japan. Ser. II. 80 (1): 99–118. doi:10.2151/jmsj.80.99.
- Cheng, C.-T., W.-C. Wang, and J.-P. Chen. 2010. “Simulation of the Effects of Increasing Cloud Condensation Nuclei on Mixed-phase Clouds and Precipitation of a Front System.” Atmospheric Research 96 (2): 461–476. doi:10.1016/j.atmosres.2010.02.005.
- Cohard, J.-M., and J.-P. Pinty. 2000. “A Comprehensive Two-moment Warm Microphysical Bulk Scheme. I: Description and Tests.” Quarterly Journal of the Royal Meteorological Society 126 (566): 1815–1842. doi:10.1002/qj.49712656613.
- Dong, H., H. Xu, and Y. Luo. 2012. “Effects of Cloud Condensation Nuclei Concentration on Precipitation in Convection Permitting Simulations of a Squall Line Using WRF Model: Sensitivity to Cloud Microphysical Schemes.” Chinese Journal of Atmospheric Sciences (in Chinese) 36 (1): 145–169. doi:10.3878/j.issn.1006-9895.2012.01.12.
- Fan, J., L. R. Leung, Z. Li, H. Morrison, H. Chen, Y. Zhou, Y. Qian, and Y. Wang. 2012. “Aerosol Impacts on Clouds and Precipitation in Eastern China: Results from Bin and Bulk Microphysics.” Journal of Geophysical Research: Atmospheres 117: D16. doi:10.1029/2011JD016537.
- Fan, J., Y. Wang, D. Rosenfeld, and X. Liu. 2016. “Review of Aerosol–Cloud Interactions: Mechanisms, Significance, and Challenges.” Journal of the Atmospheric Sciences 73 (11): 4221–4252. doi:10.1175/JAS-D-16-0037.1.
- Ferrier, B. S., W.-K. Tao, and J. Simpson. 1995. “A Double-moment Multiple-phase Four-class Bulk Ice Scheme. Part II: Simulations of Convective Storms in Different Large-scale Environments and Comparisons with Other Bulk Parameterizations.” Journal of the Atmospheric Sciences 52 (8): 1001–1033. doi:10.1175/1520-0469(1995)052<1001:ADMMPF>2.0.CO;2.
- Gong, F., J. Liu, and Z. Li. 1997. “Study of the Raindrop Size Distributions for Three Types of Precipitation.” Chinese Journal of Atmospheric Sciences (in Chinese) 21 (5): 607–614. doi:10.3878/j.issn.1006-9895.1997.05.12.
- Hong, S.-Y., and J.-O. J. Lim. 2006. “The WRF Single-moment 6-class Microphysics Scheme (WSM6).” Journal of the Korean Meteorological Society 42 (2): 129–151.
- Hong, S.-Y., K.-S.-S. Lim, Y.-H. Lee, J.-C. Ha, H.-W. Kim, S.-J. Ham, and J. Dudhia. 2010. “Evaluation of the WRF Double-Moment 6-class Microphysics Scheme for Precipitating Convection.” Advances in Meteorology 2010: 10. doi:10.1155/2010/707253.
- Kessler, E. 1969. On the Distribution and Continuity of Water Substance in Atmospheric Circulations, 1–84. Springer. doi:10.1007/978-1-935704-36-2_1.
- Khain, A., D. Rosenfeld, and A. Pokrovsky. 2005. “Aerosol Impact on the Dynamics and Microphysics of Deep Convective Clouds.” Quarterly Journal of the Royal Meteorological Society 131 (611): 2639–2663. doi:10.1256/qj.04.62.
- Khairoutdinov, M., and Y. Kogan. 2000. “A New Cloud Physics Parameterization in A Large-Eddy Simulation Model of Marine Stratocumulus.” Monthly Weather Review 128 (1): 229–243. doi:10.1175/1520-0493(2000)128<0229:ANCPPI>2.0.CO;2.
- Li, X., W.-K. Tao, A. P. Khain, J. Simpson, and D. E. Johnson. 2009. “Sensitivity of a Cloud-resolving Model to Bulk and Explicit Bin Microphysical Schemes. Part II: Cloud Microphysics and Storm Dynamics Interactions.” Journal of the Atmospheric Sciences 66 (1): 22–40. doi:10.1175/2008JAS2647.1.
- Lim, K.-S.-S., and S.-Y. Hong. 2010. “Development of an Effective Double-Moment Cloud Microphysics Scheme with Prognostic Cloud Condensation Nuclei (CCN) for Weather and Climate Models.” Monthly Weather Review 138 (5): 1587–1612. doi:10.1175/2009MWR2968.1.
- Lim, K. S. S., S. Y. Hong, S. S. Yum, J. Dudhia, and J. B. Klemp. 2011. “Aerosol Effects on the Development of a Supercell Storm in a Double-moment Bulk-cloud Microphysics Scheme.” Journal of Geophysical Research: Atmospheres 116: D2. doi:10.1029/2010JD014128.
- Milbrandt, J. A., and M. K. Yau. 2005a. “A Multimoment Bulk Microphysics Parameterization. Part I: Analysis of the Role of the Spectral Shape Parameter.” Journal of the Atmospheric Sciences 62 (9): 3051–3064. doi:10.1175/JAS3534.1.
- Milbrandt, J. A., and M. K. Yau. 2005b. “A Multimoment Bulk Microphysics Parameterization. Part II: A Proposed Three-Moment Closure and Scheme Description.” Journal of the Atmospheric Sciences 62 (9): 3065–3081. doi:10.1175/JAS3535.1.
- Morrison, H., G. Thompson, and V. Tatarskii. 2009. “Impact of Cloud Microphysics on the Development of Trailing Stratiform Precipitation in a Simulated Squall Line: Comparison of One- and Two-Moment Schemes.” Monthly Weather Review 137 (3): 991–1007. doi:10.1175/2008MWR2556.1.
- Reisner, J., R. M. Rasmussen, and R. T. Bruintjes. 1998. “Explicit Forecasting of Supercooled Liquid Water in Winter Storms Using the MM5 Mesoscale Model.” Quarterly Journal of the Royal Meteorological Society 124 (548): 1071–1107. doi:10.1002/qj.49712454804.
- Rosenfeld, D., U. Lohmann, G. B. Raga, C. D. Dowd, M. Kulmala, S. Fuzzi, A. Reissell, and M. O. Andreae. 2008. “Flood or Drought: How Do Aerosols Affect Precipitation?” Science 321 (5894): 1309. doi:10.1126/science.1160606.
- Seifert, A., and K. D. Beheng. 2001. “A Double-moment Parameterization for Simulating Autoconversion, Accretion and Selfcollection.” Atmospheric Research 59-60: 265–281. doi:10.1016/S0169-8095(01)00126-0.
- Shi, L., and Y. Duan. 2007. “Obervations of Cloud Condensation Nuclei in North China.” Acta Meteorologica Sinica (in Chinese) 65 (4): 644–652. doi:10.11676/qxxb2007.059.
- Tao, W.-K., J. Simpson, and M. McCumber. 1989. “An Ice-water Saturation Adjustment.” Monthly Weather Review 117 (1): 231–235. doi:10.1175/1520-0493(1989)117<0231:AIWSA>2.0.CO;2.
- Thompson, G., and T. Eidhammer. 2014. “A Study of Aerosol Impacts on Clouds and Precipitation Development in A Large Winter Cyclone.” Journal of the Atmospheric Sciences 71 (10): 3636–3658. doi:10.1175/JAS-D-13-0305.1.
- Thompson, G., P. R. Field, R. M. Rasmussen, and W. D. Hall. 2008. “Explicit Forecasts of Winter Precipitation Using an Improved Bulk Microphysics Scheme. Part II: Implementation of a New Snow Parameterization.” Monthly Weather Review 136 (12): 5095–5115. doi:10.1175/2008MWR2387.1.
- Tokay, A., and D. A. Short. 1996. “Evidence from Tropical Raindrop Spectra of the Origin of Rain from Stratiform versus Convective Clouds.” Journal of Applied Meteorology 35 (3): 355–371. doi:10.1175/1520-0450(1996)035<0355:EFTRSO>2.0.CO;2.
- Twomey, S. 1959. “The Nuclei of Natural Cloud Formation Part II: The Supersaturation in Natural Clouds and the Variation of Cloud Droplet Concentration.” Geofisica Pura E Applicata 43 (1): 243–249. doi:10.1007/BF01993560.
- Wang, Z. B., M. Hu, J. Y. Sun, Z. J. Wu, D. L. Yue, X. J. Shen, and Y. M. Zhang. 2013. “Atmospheric Chemistry and Physics Characteristics of Regional New Particle Formation in Urban and Regional Background Environments in the North China Plain.” Atmospheric Chemistry and Physics 13 (24): 12495–12506. doi:10.5194/acp-13-12495-2013.