
ABSTRACT
The summer western North Pacific subtropical high (WNPSH) has large influences on the East Asian summer climate. Many studies have focused on the projected changes in the WNPSH, but little is known about the changes under different global warming targets, such as 1.5°C and 2.0°C. This study investigates the changes in the WNPSH under six global warming targets (1.5°C, 2.0°C, 2.5°C, 3.0°C, 3.5°C, and 4.0°C) in both the mid- and lower troposphere, using the outputs of CMIP5 model in historical simulations and under Representative Concentration Pathway 8.5. The projected changes in the WNPSH, which is measured by multiple variables, show that it changes little under the 1.5°C target in the mid-troposphere, but weakens and retreats approximately 2.5° in longitude under the 2.0°C target. It tends to linearly weaken with warming greater than 2.5°C and shifts eastward by approximately 6.0° in longitude by the 4.0°C target. Meanwhile, the WNPSH intensifies and extends westward under the 1.5°C target in the lower troposphere, but changes little with warming rising from 1.5°C to 2.0°C. It is projected to extend westward by approximately 2.0° in longitude by the 4.0°C target.
Graphical Abstract
摘要
西北太平洋副热带高压(简称西太副高)是影响东亚夏季天气气候的关键环流系统。本文利用CMIP5的历史气候模拟试验和RCP8.5路径下的未来气候变化预估试验数据,采用扰动位势高度, 流函数等多种变量描述西太副高,分析了西太副高在6个全球变暖阈值(1.5℃, 2.0℃, 2.5℃, 3.0℃, 3.5℃和4.0℃)下相对于当代气候的变化情况。在对流层中层(500 hPa),西太副高在1.5℃阈值下几乎没有变化,而在2.0℃阈值下迅速减弱并东退约2.5°。当升温大于2.5℃时,西太副高呈线性减弱趋势,在4.0℃阈值下将东退约6.0°。在对流层低层(850 hPa),西太副高在1.5℃阈值下增强西伸,但在升温到2.0℃的过程中变化不大。当变暖达到4.0℃阈值时,西太副高将西伸约2.0°。
关键词:
1. Introduction
The western North Pacific subtropical high (WNPSH) is a dominant component of the East Asian summer (June–July–August) monsoon and anchors the subtropical rain belt on its northwestern flank. Its intensity, shape, and location consequently have a large influence on the East Asian summer precipitation (Lu Citation2002; Ren, Yang, and Sun Citation2013). An anomalous WNPSH causes widespread disasters over East Asia, such as floods, drought and heat waves (Lu, Li, and Ryu Citation2008; Wang, Xiang, and Lee Citation2013). Thus, the future behavior of the summer WNPSH under global warming is of great concern.
There are some uncertainties in the projected changes in the WNPSH under global warming. The CMIP3 future warming scenarios agreed on the strengthening of the WNPSH, which is depicted by the streamfunction at 925 hPa (Li et al. Citation2012). Liu et al. (Citation2014) investigated the location of the 5880-gpm contour line and found the WNPSH is projected to enlarge in all the pathways in CMIP5. However, the lower-troposphere circulation indicates that the projected WNPSH experiences weak changes in the future (He and Zhou Citation2015). He et al. (Citation2015) claimed that the WNPSH tends to weaken and retreat eastward in the mid-troposphere by analyzing the eddy geopotential height and eddy streamfunction field at 500 hPa. Huang, Li, and Wang (Citation2016) suggested that the WNPSH, as depicted by the eddy geopotential height at 850 hPa, will be relatively weak during the mid-21st century. It appears that different variables lead to different results.
Moreover, the possible responses of the WNPSH to different warming targets have received less attention. The Paris Agreement aims to maintain the rise in global temperature well below 2.0°C above the preindustrial level and to pursue efforts to limit this even further to 1.5°C. It is expected that warming targets of even 4.0°C–5.0°C will be reached by the end of the 21st century under a high emission scenario (Xu et al. Citation2017; Fu, Lu, and Guo Citation2018; Wang, Jiang, and Lang Citation2018). Therefore, the projected changes in the WNPSH under six global warming targets (1.5°C, 2.0°C, 2.5°C, 3.0°C, 3.5°C, and 4.0°C) are investigated in this study.
2. Data and methods
We analyzed the results of 29 CMIP5 models for their historical climate simulation (HIST, 1850–2005) and future climate projection under Representative Concentration Pathway 8.5 (RCP8.5, 2006–2100) (Riahi et al. Citation2011). Only one realization of the ensembles is selected for each model. All simulations have been interpolated onto a common 2.5° × 2.5° grid to enable the multi-model ensemble (MME) and median analyses. lists some key information about the models.
Table 1. Basic information of the CMIP5 models used in this study and their global warming target times.
Following the 1.5°C Special Report (IPCC Citation2018), 51-year (1850–1900) global mean surface temperature (GMST) is used as the quasi-preindustrial baseline, and the 20-year (1986–2005) NCEP reanalysis data and simulations of HIST are used to depict the observed and simulated present climate, respectively. The warming is defined as the GMST anomaly relative to the average of the preindustrial baseline. An 11-year moving mean of the anomalous GMST is used to identify the time when the global warming reaches the target. When the time is determined for a model, the 11-year (five years before and after) mean is referred to as the climatic state under the warming target. Under a warming target, the MME result is obtained by simply averaging the climatic state in the individual models with equivalent weight. The projected change is calculated by the difference of variables under the warming target and in the present climate.
The eddy geopotential height is used instead of the traditional geopotential height to measure the WNPSH (Huang and Li Citation2015; He et al. Citation2015, Citation2018), which is because the traditional geopotential height systematically increases with increasing temperature (Lu, Li, and Ryu Citation2008) and more than 80% of its increase is attributable to zonally uniform warming (He et al. Citation2018). The eddy geopotential height at 500 hPa (referred to as H′500 hereafter) is calculated by subtracting the zonal belt mean height between 0° and 40°N from the geopotential height (He et al. Citation2018). The WNPSH is also depicted by the geopotential height at 850 hPa (Lu Citation2002; Lu, Li, and Ryu Citation2008; Fu Citation2013). The eddy geopotential height at 850 hPa (referred to as H′850 hereafter) is calculated by subtracting the zonal mean height from the geopotential height (Huang, Li, and Wang Citation2016).
Several WNPSH indices (WNPSHIs) are defined to facilitate the estimation of the changes in the WNPSH. Similar to the indices defined by the China Meteorological Administration, in the region of (0°–60°N, 90°–180°E), the number of grid points with H′500 (H′850) ≥ 0.0 is defined as the area index; the accumulated value of the H′500 and H′850 at each grid point within the 0-gpm contour line is defined as the intensity index; and the minimum longitude of the 0-gpm contour line is defined as the west point index. Additionally, the area-averaged eddy streamfunction over (10°–30°N, 120°–180°E) at 500 hPa is defined as the ESF500 index, following He et al. (Citation2015). At 850 hPa, the summer mean relative vorticity anomalies averaged over (15°–27.5°N, 125°–150°E) is defined as RV850, following Lu, Li, and Ryu (Citation2008); the difference in the zonal wind between (25°–35°N, 120°–150°E) and (10°–20°N, 130°–150°E) is defined as Ua850, following He et al. (Citation2015).
3. Results
3.1 Model evaluation
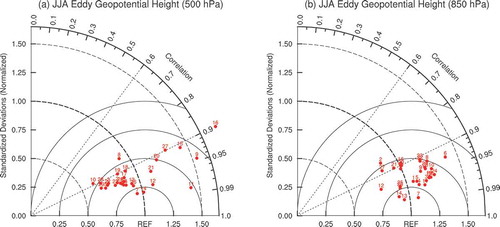
Agreement between the model-simulated and observed H′500 and H′850 over the western North Pacific (WNP; 0–40°N, 90°–180°E) is evaluated using Taylor diagrams (Taylor Citation2001) (). Many models can reproduce the spatial pattern of H′500 in the observations, and some models are unable to sufficiently simulate the spatial pattern ()). Almost all models have spatial correlation coefficients with observations larger than 0.90. Nearly all models (except FGOALS-g2 and GISS-E2-R) have normalized standard deviations (NSDs) between 0.50 and 1.50. The root-mean-square errors (RMSEs) exceed 0.50 in six models (CSIRO-Mk3-6-0, FGOALS-g2, FGOALS-s2, GISS-E2-H, GISS-E2-R, and MRI-CGCM3). Additionally, the H′500 is very weak over the WNP in BCC-CSM1-1 and BCC-CSM1-1-M compared to the observations (figure not shown for brevity). As evident from our findings, the models simulate the H′850 better than the H′500 ()). Except for CanESM2, nearly all models have correlation coefficients larger than 0.90, NSDs between 0.75 and 1.25, and RMSEs lower than 0.50, which clearly suggest that these model-simulated H′850 results strongly resemble the observations.
Figure 1. Taylor diagrams of (a) H′500 and (b) H′850 over the WNP (0°–40°N, 90°–180°E) between the NCEP reanalysis data and CMIP5 model outputs of HIST during the period of 1986–2005.
In the meantime, the warming exceeds 4.0°C in more than two-thirds of the models from 2066 (IPSL-CM5A-LR) to 2095 (NorESM1-M) (), which is consistent with the results in Wang, Jiang, and Lang (Citation2018). Global warming of 4.0°C does not occur in seven models (FGOALS-g2, GFDL-ESM2G, GFDL-ESM2M, GISS-E2-H, GISS-E2-R, MIROC5, and MRI-CGCM3), which are therefore not applied in the following investigations. Three models (BCC-CSM1-1-M, BNU-ESM, and FGOALS-s2), which project the 1.5°C target before the year 2010, are also excluded.
Therefore, the outputs of 16 models (CESM1-CAM5, CCSM4, CNRM-CM5, FIO-ESM, GFDL-CM3, HadGEM2-AO, HadGEM2-CC, HadGEM2-ES, IPSL-CM5A-LR, IPSL-CM5A-MR, MIROC-ESM-CHEM, MIROC-ESM, MPI-ESM-LR, MPI-ESM-MR, NorESM1-ME, and NorESM1-M) are used in the following analyses.
3.2 Projected changes in the WNPSH at 500 hPa
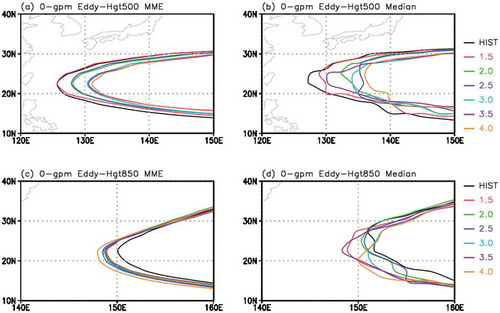
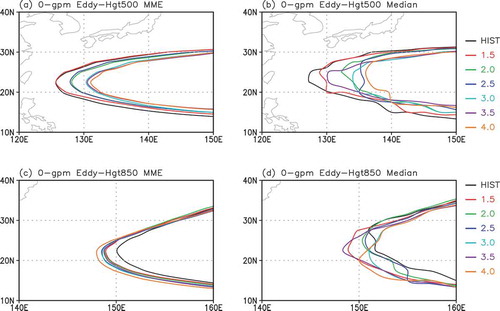
The WNPSH is projected to clearly weaken and retreat eastward at 500 hPa under the six global warming targets ()). Under the 1.5°C warming target, the shift of the MME 0-gpm contour line is relatively weak ()). It retreats quickly from the 1.5°C to 2.0°C warming target by approximately 2.5° in longitude. The WNPSH also experiences a rapid decrease from the 2.5°C to 3.0°C warming target. Under the 4.0°C warming target, the MME 0-gpm contour line shifts eastward evidently by approximately 6.0° in longitude. Generally, the multi-model median changes show the same tendency as that in the MME ()).
Figure 2. (a) The MME 0-gpm contour lines of H′500 in HIST and under six global warming targets, which are indicated by different colors. (b) As in (a), but for the multi-model median results. (c, d) As in (a, b), but for H′850. The MME result under each warming target is obtained by averaging the state in the individual models under the same warming target. Units: gpm.
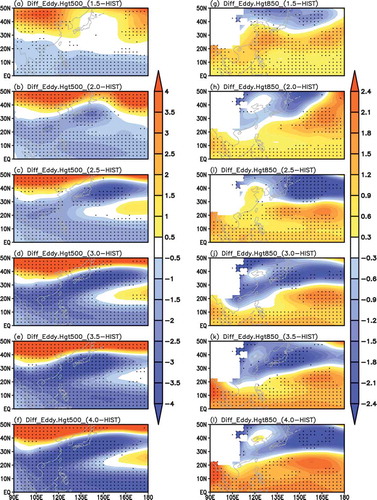
The changes in the spatial pattern of H′500 show that the projected WNPSH weakens slightly at its southern flank and intensifies slightly at its northern flank under the 1.5°C warming target ()). Under the 2.0°C target, the H′500 over the WNP decreases evidently and the increase in H′500 mainly occurs north of 40°N ()), indicating a more remarkable weakened WNPSH. With warming greater than 2.5°C, a clear decrease in H′500 occurs at the western and northern flanks of the WNPSH, which intensifies with the rise in the warming targets. There is also a slight increase in the core region of the WNPSH ()). Additionally, all the evident changes agree in more than two-thirds of the models.
Figure 3. MME projected changes in (a–f) H′500 and (g–l) H′850 under the six global warming targets relative to the present climate (1986–2005). Black dots indicate that more than two-thirds of the models show the same tendency. Units: gpm.
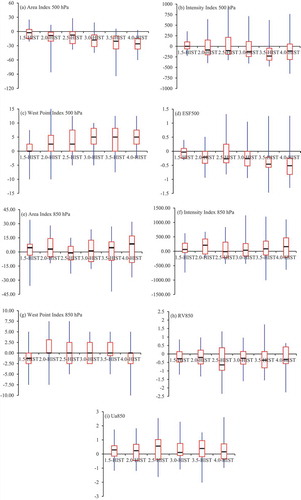
The weakened trend of the WNPSH in the mid-troposphere can be further certified by the changes in the WNPSHIs defined by different variables ()). The area is projected to decrease ()), the intensity is projected to decay ()), the western point is projected to retreat eastward ()), and the circulation is projected to decelerate ()). The decrease shows an approximately linear trend with the rise in the warming target. The weakened WNPSH is projected in more than approximately three-quarters of the models.
Figure 4. Boxplots of the projected changes in (a) area, (b) intensity, (c) west point, and (d) ESF indices at 500 hPa. (e–g) As in (a–c), but at 850 hPa. Panels (h) and (i) show the changes in RV850 and Ua850 index, respectively. Black short lines indicate the multi-model median of the changes in the individual models, red boxes indicate the lower and upper quartiles of the changes, and blue lines indicate the minimum and maximum.
3.3 Projected changes in the WNPSH at 850 hPa
In the lower troposphere, the WNPSH tends to intensify and extend westward ()), showing an opposite tendency in comparison with that in the mid-troposphere. The MME 0-gpm contour line experiences a clear westward shift from present to the 1.5°C global warming target. However, the extension is very weak from the 1.5°C to 3.5°C global warming target. The WNPSH is projected to extend westward by approximately 2.0° in longitude from present to the 4.0°C warming target, showing a weaker change amplitude in comparison with that at 500 hPa. The strengthened WNPSH can also be found in the multi-model median changes ()). The reverse change in the WNPSH in the mid- and lower troposphere bears high similarity to the results of He et al. (Citation2015), who reported that the WNPSH would weaken in the mid-troposphere but remain unchanged in the lower troposphere.
The spatial pattern of the projected changes in H′850 clearly shows that the WNPSH tends to intensify in more than two-thirds of the models ()). Under the 1.5°C global warming target, the H′850 intensifies clearly over East Asia and the WNP and decays over northeastern Asia north of approximately 40°N ()). Under the 2.0°C warming target, the increase of H′850 mainly occurs over the core region of the WNPSH east of 150°E, and the decrease appears over the North Pacific ()). It is found that similar changes in H′850 also appear under warmer targets and their amplitudes increase with the rising of the warming targets ()).
The changes in various WNPSHIs further show that, in the lower troposphere, the area of the WNPSH is projected to increase ()), the intensity is projected to intensify ()), the west point is projected to extend westward ()), and the circulation is projected to strengthen ()). However, the changes are less evident compared with the changes at 500 hPa. Most of the projected changes agree only in more than half but less than three-quarters of the models, indicating a relatively large inter-model uncertainty in comparison with that in the mid-troposphere.
4. Summary and discussion
The projected changes in the WNPSH under six global warming targets (1.5°C, 2.0°C, 2.5°C, 3.0°C, 3.5°C, and 4.0°C) in both the mid- and lower troposphere are investigated using the outputs of 29 CMIP5 models in HIST and under RCP8.5. We first select 16 models that have global warming reaching 4.0°C by the end of 21st century and have the highest skills in reproducing the present-day H′500 and H′850.
It is found that the projected WNPSH varies oppositely in the mid- and lower troposphere. Generally, in the mid-troposphere, the projected WNPSH changes little under the 1.5°C warming target but retreats rapidly under the 2.0°C target. With warming greater than 2.5°C, the WNPSH is projected to weaken and retreat eastward evidently. The area of the WNPSH tends to decrease, the intensity tends to decay, the west point tends to retreat eastward, and the circulation tends to decelerate. These results are consistent in more than approximately three-quarters of the models.
Meanwhile, the WNPSH intensifies and extends westward clearly under the 1.5°C warming target in the lower troposphere, but changes little from the 1.5°C to 2.0°C target. Generally, the projected area is likely to increase, the intensity is projected to intensify, and the circulation is projected to be strengthened under higher warming targets. These changes agree in more than half but less than three-quarters of the models, indicating a relatively large inter-model uncertainty.
The meridional temperature gradient has been reported to be the dominant factor for the WNPSH in the mid-troposphere (He et al. Citation2015). Following that study, we also investigate the changes in the temperature gradient under different global warming targets. The results show that a strong meridional temperature gradient exists at the northern flank of the WNPSH, but almost consistent warming exists at the same level at the southern flank ()). This pattern would result in decreased westerly winds in the mid-troposphere ()), which contribute to the weakened WNPSH.
Figure 5. (a) Latitude–height profile of MME projected changes in temperature average within 120°–180°E under the 4.0°C warming target. All the changes are consistent in more than two-thirds of the models. Units: °C. (b) As in (a), bur for zonal wind. Shading indicates that more than two-thirds of the models show the same tendency (units: m s−1). (c) Boxplots of the projected changes in the SST gradient between the tropical Indian Ocean and the tropical western Pacific (units: °C). Black short lines indicate the multi-model median of the changes in the individual models, red boxes indicate the lower and upper quartiles of the changes, and blue lines indicate the minimum and maximum.
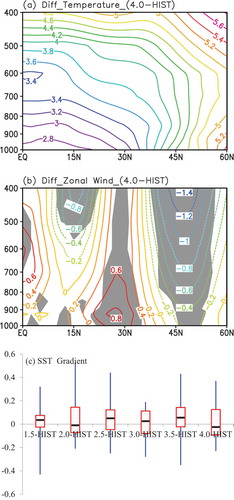
Previous studies have also suggested that the stronger warming over the tropical Indian Ocean (10°S–10°N, 50°–100°E) and weaker warming over the tropical western Pacific (10°S–10°N, 150°–180°E) favor an enhanced WNPSH at 850 hPa (He and Zhou Citation2015; Huang, Li, and Wang Citation2016). The SST gradient between them dominates the projected WNPSH intensity (He and Zhou Citation2015). However, ) shows that the multi-model median changes in the gradient are less than 0.1°C in most of the models under the six warming targets. This result means that there may still be other factors responsible for the changes in the WNPSH. Therefore, a more detailed analysis is needed in future work.
This study shows that the WNPSH approximately linearly weakens at 500 hPa and intensifies at 850 hPa with a rise in the warming target. However, the WNPSH varies naturally on decadal time scales. The projected WNPSH might experience an interdecadal variation in the 21st century (Huang, Li, and Wang Citation2016). Therefore, a more detailed analysis is needed on the influences of the natural variability and global warming on the WNPSH.
Disclosure statement
No potential conflict of interest was reported by the authors.
Additional information
Funding
References
- Fu, Y. H. 2013. “The Projected Temporal Evolution in the Interannual Variability of East Asian Summer Rainfall by CMIP3 Coupled Models.” Science China Earth Sciences 56: 1434–1446. doi:10.1007/s11430-012-4430-3.
- Fu, Y.-H., R.-Y. Lu, and D. Guo. 2018. “Changes in Surface Air Temperature over China under the 1.5 And 2.0 °C Global Warming Targets.” Advances in Climate Change Research 9: 112–119. doi:10.1016/j.accre.2017.12.001.
- He, C., A. Lin, D. Gu, C. Li, B. Zheng, B. Wu, and T. Zhou. 2018. “Using Eddy Geopotential Height to Measure the Western North Pacific Subtropical High in a Warming Climate.” Theoretical and Applied Climatology 131: 681–691. doi:10.1007/s00704-016-2001-9.
- He, C., and T. Zhou. 2015. “Responses of the Western North Pacific Subtropical High to Global Warming under RCP4.5 And RCP8.5 Scenarios Projected by 33 CMIP5 Models: The Dominance of Tropical Indian Ocean–Tropical Western Pacific SST Gradient.” Journal of Climate 28: 365–380. doi:10.1175/JCLI-D-13-00494.1.
- He, C., T. Zhou, A. Lin, B. Wu, D. Gu, C. Li, and B. Zheng. 2015. “Enhanced or Weakened Western North Pacific Subtropical High under Global Warming?” Scientific Reports 5: 16771. doi:10.1038/srep16771.
- Huang, Y., and X. Li. 2015. “The Interdecadal Variation of the Western Pacific Subtropical High as Measured by 500 hPa Eddy Geopotential Height.” Atmospheric and Oceanic Science Letters 8: 371–375. doi:10.3878/AOSL20150038.
- Huang, Y., X. Li, and H. Wang. 2016. “Will the Western Pacific Subtropical High Constantly Intensify in the Future?” Climate Dynamics 47: 567–577. doi:10.1007/s00382-015-2856-y.
- IPCC. 2018. Global warming of 1.5°C. An IPCC Special Report on the Impacts of Global Warming of 1.5°C Above Pre-Industrial Levels and Related Global Greenhouse Gas Emission Pathways, in the Context Of Strengthening the Global Response to the Threat of Climate Change, In Sustainable Development, and Efforts to Eradicate Poverty. edited by V. Masson-Delmotte et al.
- Li, W., L. Li, M. Ting, and Y. Liu. 2012. “Intensification of Northern Hemisphere Subtropical Highs in a Warming Climate.” Nature Geoscience 5: 830–834. doi:10.1038/ngeo1590.
- Liu, Y., W. Li, J. Zuo, and Z.-Z. Hu. 2014. “Simulation and Projection of the Western Pacific Subtropical High in CMIP5 Models.” Journal of Meteorological Research 28: 327–340. doi:10.1007/s13351-014-3151-2.
- Lu, R. 2002. “Indices of the Summertime Western North Pacific Subtropical High.” Advances in Atmospheric Sciences 19: 1004–1028. doi:10.1007/s00376-002-0061-5.
- Lu, R., Y. Li, and C.-S. Ryu. 2008. “Relationship between the Zonal Displacement of the Western Pacific Subtropical High and the Dominant Modes of Low-tropospheric Circulation in Summer.” Progress in Natural Science 18: 161–165. doi:10.1016/j.pnsc.2007.07.009.
- Ren, X., X. Yang, and X. Sun. 2013. “Zonal Oscillation of Western Pacific Subtropical High and Subseasonal SST Variations during Yangtze Persistent Heavy Rainfall Events.” Journal of Climate 26: 8929–8946. doi:10.1175/JCLI-D-12-00861.1.
- Riahi, K., S. Rao, V. Krey, C. Cho, V. Chirkov, G. Fischer, G. Kindermann, N. Nakicenovic, and P. Rafaj. 2011. “RCP 8.5—A Scenario of Comparatively High Greenhouse Gas Emissions.” Climatic Change 109: 33–57. doi:10.1007/s10584-011-0149-y.
- Taylor, K. E. 2001. “Summarizing Multiple Aspects of Model Performance in a Single Diagram.” Journal of Geophysical Research 106: 7183–7192. doi:10.1029/2000JD900719.
- Wang, B., B. Xiang, and J.-Y. Lee. 2013. “Subtropical High Predictability Establishes a Promising Way for Monsoon and Tropical Storm Predictions.” Proceedings of the National Academy of Sciences of the United States of America 110: 2718–2722. doi:10.1073/pnas.1214626110.
- Wang, X., D. Jiang, and X. Lang. 2018. “Climate Change of 4 °C Global Warming above Pre-industrial Levels.” Advances in Atmospheric Sciences 35: 757–770. doi:10.1007/s00376-018-7160-4.
- Xu, Y., B.-T. Zhou, J. Wu, Z.-Y. Han, Y.-X. Zhang, and J. Wu. 2017. “Asian Climate Change under 1.5-4°C Warming Targets.” Advances in Climate Change Research 8: 99–107. doi:10.1016/j.accre.2017.05.004.