
 ?Mathematical formulae have been encoded as MathML and are displayed in this HTML version using MathJax in order to improve their display. Uncheck the box to turn MathJax off. This feature requires Javascript. Click on a formula to zoom.
ABSTRACT
The relationship between vegetation greening and climate change remains unclear due to its complexity, especially in drylands. Against the background of global warming, arid and semi-arid areas, including mid-latitude deserts, are most sensitive to climate change. In recent decades, the mechanisms underlying the relationship between vegetation greening and climate change have been widely discussed in the literature. However, the influence of vegetation greening in high latitudes on regional climate has not been fully studied. In this paper, a two-dimensional energy balance model was used to study the influence of greening in high latitudes on mid-latitude deserts. The authors found that when greening occurs in high latitudes, the mid-latitude desert recedes at the south boundary, while the polar ice belt and low-latitude vegetation belt both expand. Simultaneously, greening in high latitudes can induce a negative temperature anomaly in northern latitudes and a positive temperature anomaly in southern latitudes. The mid-latitude desert expands at its north and south boundaries until the CO2 concentration reaches 600 ppm (saturated state). The greening in high latitudes could result in a lower global-mean temperature in the ‘saturated’ state, due to the stronger cooling in high latitudes.
GRAPHICAL ABSTRACT
摘要
在全球变暖的背景下,包含中纬度荒漠的干旱地区对气候的变化最为敏感,但高纬度植被绿化对中纬度荒漠地区域的气候影响仍然未知。本研究采用二维能量平衡模式研究高纬度地区植被绿化对中纬度荒漠的影响。研究结果表明,高纬度地区绿化会导致中纬度荒漠南边界后退,极地冰带和低纬度植被带扩大。同时,也会引发高纬度负温度异常和低纬度正温度异常。在CO2浓度增加试验中,中纬度荒漠的南北边界一直在扩展,直到CO2浓度达到600ppm(饱和状态)为止。
1. Introduction
Vegetation growth has been significantly affected by climate change, from the stomatal scale to the ecosystem scale, as reflected in increased vegetation greening worldwide. Such phenomena, in turn, affect the climate system through many biophysical processes. Understanding the interactions between vegetation and climate is important for predicting climatic conditions, especially in semi-arid and desert regions. Semi-arid regions are very sensitive to climate change and human activities, because of the low vegetation cover and relatively large human populations (Wang et al. Citation2012; Huang et al. Citation2019). Semi-arid regions have expanded during the past 60 years and have experienced the most enhanced warming, especially during the cold season (Huang, Guan, and Ji. Citation2012; Huang et al. Citation2016a, Citation2016b). Based on bias-corrected CMIP5 (phase 5 of the Coupled Model Intercomparison Project) projections, dryland areas will expand by 23% by the end of this century under the RCP8.5 (8.5 W m−2 Representative Concentration Pathways) scenario, such that they will account for 56% of the global land surface (Huang et al. Citation2016a). Such an expansion of drylands would affect the lives of many residents in arid and semi-arid regions and lead to serious social and economic problems. Therefore, understanding the expansion of drylands and the mechanisms behind the enhanced warming therein is important for developing strategies for climate adaptation.
Many mechanisms have been proposed to explain the enhanced warming in semi-arid areas, including land–atmosphere interactions (Huang et al. Citation2017b, Citation2017a). Low soil moisture in semi-arid regions dictates that the surface available energy can only be released by sensible heating, which leads to more warming than in humid areas. Guan et al. (Citation2015) applied the adjustment method proposed by Wallace et al. (Citation2012) to divide the raw temperature into the dynamically induced temperature (DIT) and radiatively forced temperature (RFT). Their results suggest that the enhanced semi-arid warming is more attributable to RFT than DIT; circulation changes are also a contributing factor. He, Huang, and Ji. (Citation2014) found the land–sea thermal contrast in winter decreases with greater global warming, in turn reducing the strength and frequency of blocking through its effects on planetary waves, and inducing additional warming in semi-arid regions. However, the above-mentioned mechanisms mainly involve local feedback or are influenced by oceans; the influence of high-latitude land warming on mid-latitude semi-arid areas remains unclear.
As a special-case semi-arid region, Siberia has relatively low precipitation but with extensive forest coverage; it has also experienced significant warming due to climate change. Local climate changes have significantly affected forest composition and function in Siberia via changes in water-use efficiency, the length of the growing season and disturbance regimes (Piao et al. Citation2007). Both field observations and simulations conducted in Siberia have revealed a shift from deciduous conifer forest (Larix spp.) to evergreen conifer forest over a large area (Kharuk et al. Citation2005; Shuman, Shugart, and O’Halloran Citation2011; He et al. Citation2017). Conversion from larch to evergreen conifer could result in a decrease in albedo, especially when snow covers the tree canopy in winter. The albedo could decrease to 0.15 (from ~0.3), which would potentially cause additional local warming and result in an albedo–temperature–vegetation positive feedback loop accelerating local warming and changes in forest composition. Comparing the areas of deciduous and evergreen conifer forests in Siberia, the deciduous conifer forest decreased by nearly 40%, while evergreen conifer forest increased by nearly 10%, during 2001–12. Although the changes in the area of deciduous and evergreen forests show large uncertainty, support was provided by an increasing trend in leaf area index (LAI) over high latitudes (Forzieri et al. Citation2017). In addition to the vegetation greening induced by the expansion of evergreen forest in Siberia, greening at the global scale was also observed in 25%–50% of vegetated areas, including semi-arid and high-latitude areas. Many mechanisms for this greening have been proposed in recent studies, including CO2 fertilization, nitrogen deposition, climate change, and land-cover change (Zhu et al. Citation2016; Piao et al. Citation2015).
However, previous studies focused on the local effects of greening in high latitudes; the remote effects must also be investigated. Therefore, this paper focuses on the remote effects of greening in high latitudes on climate change in mid-latitude semi-arid areas. The two-dimensional energy balance model (EBM) can well characterize the temperature distribution of the Earth’s surface by considering the changes of radiation with latitude. Chao and Chen (Citation1980) developed a two-dimensional EBM suitable for studying the zonal distribution of surface temperature, which Li and Chao (Citation2014) then used to study desertification. Using the two-dimensional EBM represents a new way to investigate the remote effect of high-latitude greening.
The rest of the paper is organized as follows: section 2 describes the data and methods, including the two-dimensional EBM; section 3 analyzes the greening in high latitudes; section 4 investigates the influence of greening in high latitudes on the mid-latitude desert; and section 5 provides the conclusion and discussion.
2. Data and methods
2.1 Dataset
The LAI product derived from GIMMS (Global Inventory Modeling and Mapping Studies) LAI3g data (Zhu et al. Citation2013) was used to evaluate the LAI trend. The GIMMS LAI3g data are based on the AVHRR (Advanced Very High Resolution Radiation) and MODIS (Moderate Resolution Imaging Spectroradiometer) sensors onboard the NOAA satellite of NASA (Schaaf and Wang Citation2015). This dataset covers 1982–2014 and has a temporal resolution of 15 days and a spatial resolution of 1/12°.
The albedo data used in this paper are the global surface albedo product of MODIS (MCD43C3 Version 6 Albedo), which is generated daily in the Climate Simulation Grid using 16 days of Terra and Aqua MODIS data. The albedo dataset covers 2000–17 with a temporal resolution of 1 day and a spatial resolution of 1/20°. The data can be downloaded from NASA’s Land Distributed Activity Archives Center.
2.2 Two-dimensional EBM
A two-dimensional EBM was used to investigate the remote effect of high-latitude greening. The temperature equation in the model can be written as
where ρa is the atmospheric density; cp is the specific heat at constant pressure; cv is the specific heat at constant volume. T is the atmospheric temperature; R is the specific gas constant; p is the atmospheric pressure; ε1, ε2, and ε3 are the heat fluxes caused by the radiation, turbulence, and the condensation or evaporation, respectively. Let be the longwave radiation absorption coefficient for the wavelength
, and
be the average absorption coefficient for solar radiation. Aj (Bj) is the downward (upward) longwave radiation in the wavelength
interval, Ej is the blackbody radiation within the wavelength
interval. Q means downward solar radiation. Kh is the horizontal turbulent temperature coefficient; K is the vertical turbulent temperature coefficient; z is the altitude, and
is the horizontal Laplacian, where both Kh and K are constant.
Therefore, the heat flux due to radiation can be rewritten as:
The temperature equation is averaged by latitude and rewritten as the equation in spherical coordinates. The following equation can be obtained:
where κh = ρacpKh, which is called horizontal turbulent thermal conductivity, κz = ρacpK, which is called vertical turbulent thermal conductivity, and x = sinφ, in which φ is latitude and a is the radius of the Earth. If we regard the absorption spectrum as a whole part and divide the longwave absorption spectrum into two parts — a strong absorption area and a weak absorption area — and lead the optical thickness into the equation, the analytical solution of the above equation can be obtained by using the Legendre series. This is the two-dimensional EBM used in this paper; more details can be found in Li and Chao (Citation2014) and Chao and Li. (Citation2010a, Citation2010b).
3. Vegetation greening in high latitudes
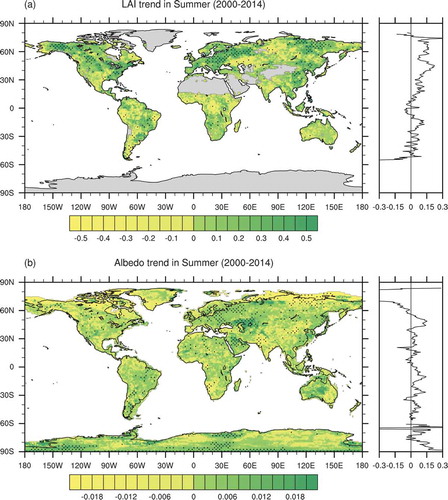
Because the LAI over high latitudes shows missing values in the non-growing season, we focused on the summer LAI to illustrate the vegetation greening phenomenon. ) shows the trend of summer LAI during the period 1982–2014, where shading corresponds to the 99% confidence level. Consistent with previous studies (Forzieri et al. Citation2017; Zhu et al. Citation2016), persistent and widespread greening over the Northern Hemisphere is evident from the summer LAI. According to the zonal mean trend of summer LAI, the greening is most significant in high latitudes. Simulations based on ecosystem models demonstrated that the observed greening trend is mainly caused by CO2 fertilization (~70%), nitrogen deposition (9%), climate change (8%), and land-cover change (4%) (Zhu et al. Citation2016). Therefore, vegetation greening may still occur due to increasing CO2 concentrations, even though temperatures have exhibited a cooling trend during the recent warming hiatus. Due to the limited temporal coverage of the albedo dataset, the trend of albedo in summer during the period 2000–14 was investigated; most areas did not reach the 95% confidence level ()). This suggests that the zonal-mean albedo trend in high latitudes is negative, which is consistent with the greening phenomenon. The decreasing albedo over high latitudes could induce increased warming by absorbing more solar radiation. However, in some regions, the changes in LAI and albedo are inconsistent, such as Europe. We focused on the remote effect of greening in the entire high-latitude belt, and not on detailed regional albedo changes.
Figure 1. The spatial distribution of the trend of summer LAI during 2000–2014 (a, left) and the zonal-mean summer LAI trend (a, right). The spatial distribution of the trend of summer albedo during 2000–14 (b, left) and the zonal-mean summer albedo trend (b, right).
4. Influence of high-latitude greening on the mid-latitude desert
4.1 Validation of the two-dimensional EBM
The albedo distribution is affected by many factors, and the zonal-mean albedo from the polar region to the equator first shows a decreasing trend, followed by an increasing trend, and then another decreasing trend; these trends are driven by polar ice, high-latitude vegetation, mid-latitude desert, and low-latitude vegetation belts. Chao and Li. (Citation2010a) presented a simplified theoretical model; they divided the albedo into four latitudinal belts and assumed that the boundaries between the four belts could be determined by an empirical ‘critical temperature’. According to our observations and previous studies (Li and Chao Citation2014), we assumed that the critical temperature between polar ice and the high-latitude vegetation belt (Ts) is −10°C, versus 5°C between the high-latitude vegetation belt and mid-latitude desert (Td), and 19°C between mid-latitude desert and low-latitude vegetation (Tv). In this way, the latitudinal distribution of the four belts is obtained; the belts are not fixed, because this two-dimensional EBM is a nonlinear model. The discontinuous latitudinal changes in albedo could induce nonlinear changes of temperature in local and remote areas. For example, when the temperature at 50°N changes from −9°C to −11°C, the surface changes from high-latitude vegetation to ice, corresponding to an increase of albedo from 0.1 to 0.75, which induces a decrease in local temperature. Local land-surface changes induced by temperature advection can influence the temperature in other latitudes, and even cause changes in land-surface type. The nonlinearity of the two-dimensional EBM can help us to determine the remote effects of high-latitude vegetation greening.
The four latitudinal belts of the albedo are defined as ,
,
, and
; xs, xd, and xv indicate the sines of boundaries between the four belts. When
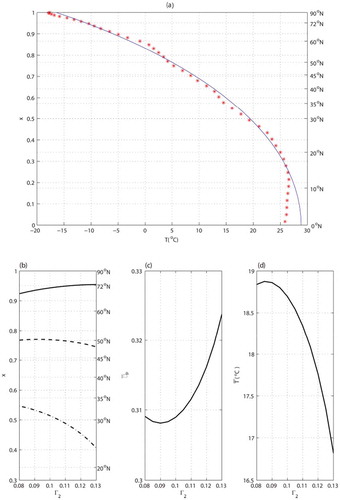
, the calculated global-mean albedo is about ~0.15, which is close to the actual situation and thus can be regarded as the current climate. ) compares the observations and simulations of zonal-mean temperature. The results suggest that the zonal distribution of surface temperature can be well characterized, especially at mid-to-high latitudes; thus, the theoretical model has the ability to simulate the temperature distribution at different latitudes.
Figure 2. (a) The distribution of zonal-mean temperature from observation (asterisk line) and the two-dimensional EBM (solid line). The x-axis is the temperature and the y-axis is the sine of the latitude. (b) The variation of xs (solid line), xd (dashed line), xv (dashed-dotted line) with the high-latitude vegetation albedo . (c, d) The variation of global-integrated planetary albedo (c) and global-integrated surface temperature (d) with the high-latitude vegetation albedo
.
4.2. The remote effects of high-latitude vegetation greening
To determine the influence of greening over high latitudes on the mid-latitude desert, we designed a sensitivity experiment in which the albedo of the high-latitude vegetation belt slowly changes around the value of 0.1 under the current climatic condition; we then determine the boundaries of the four latitudinal belts. ) shows the variations of xs, xd, and xv for the high-latitude vegetation albedo . When the albedo of the high-latitude vegetation belt (
) is less than that of the current climate (0.1), as
decreases (indicating greening), the boundary of polar ice (xs) gradually expands southward, while the north boundary of mid-latitude desert (xd) is almost unchanged and the south boundary of mid-latitude desert (xv) moves northward; overall, the mid-latitude desert belt decreases and the low-latitude vegetation belt increases. When the albedo of the high-latitude vegetation belt (
) is higher than that of the current climate, as
increases, xd and xv both move southward, with the latter moving faster, that is the mid-latitude desert increases and low-latitude vegetation decreases.
,) show the variation of global-integrated temperature and albedo with . When
is smaller than the current climate, the global-integrated albedo first decreases and then increases with the decrease of
, before reaching a minimum at
= 0.09. When
decreases from 0.1 to 0.09, the areas of polar ice and low-latitude vegetation become larger, the global-integrated albedo decreases, and the global-mean temperature increases. During this process, the expansion of the low-latitude vegetation belt contributes more than that of polar ice to the decrease of the global-integrated albedo. When
further decreases from 0.09 to 0.08, the expansion of the polar ice belt accelerates, which induces an increase in the global-integrated albedo and a decrease in the global-mean temperature. On the other hand, when
> 0.1, as
increases, the high-latitude vegetation belt and mid-latitude desert both expand, and the low-latitude vegetation belt shrinks. Because the shrinkage of the low-latitude vegetation belt is faster than the expansion of the high-latitude vegetation belt, the area of global vegetation will decrease and gradually be converted into a desert. Then, the global-integrated albedo increases due to the expansion of the mid-latitude desert. In summary, when the high-latitude vegetation becomes greener than it is under the current climate (
< 0.1), the mid-latitude desert shrinks and its south boundary moves northward, in contrast to the expansion of semi-arid areas driven by enhanced warming. However, the greening in the high-latitude vegetation belt is also conducive to increasing polar ice. By contrast, if the LAI of high-latitude vegetation is reduced, it encourages a decrease of global vegetation area and an increase of mid-latitude desert, which will greatly damage the ecological environment around the desert.
To investigate the response of temperature at different latitudes, shows the latitudinal distribution of surface temperature anomalies relative to current climatic conditions. When is smaller than the current climate, a negative temperature anomaly occurs in high latitudes (north of ~45°N) and a positive temperature anomaly occurs in low latitudes. The global-mean temperature would thus increase due to the greater contribution of the positive anomaly over low latitudes. As
decreases, the area of the negative temperature anomaly gradually expands southward, which leads to a decrease in global-mean temperature. When
is greater than the current climate, the positive temperature anomaly only occurs north of 50°N; the area of the negative anomaly expands with the increase of
, which indicates that desertification of high-latitude vegetation will induce a global cooling trend.
Figure 3. The zonal distribution of surface temperature anomaly relative to current climate states (= 0.1).
4.3. The influence of high-latitude greening on the evolution of mid-latitude desert with increasing CO2
The CO2 produced by human activities is an important factor in global warming. Since the industrial revolution, the concentration of CO2 in the atmosphere has steadily increased (currently standing at 400 ppm), and the global-mean temperature will continue to rise in the future under anthropogenic forcing. However, how the temperature will change as CO2 increases remains unclear. Will high-latitude greening affect the response of mid-latitudes under anthropogenic forcing caused by the rising CO2? In the simple two-dimensional EBM, the absorption coefficients can be parameterized to change with CO2 concentration, to further investigate the response of global temperature to increasing CO2 concentrations. This model may provide insight, especially into the changes of the four latitudinal belts.
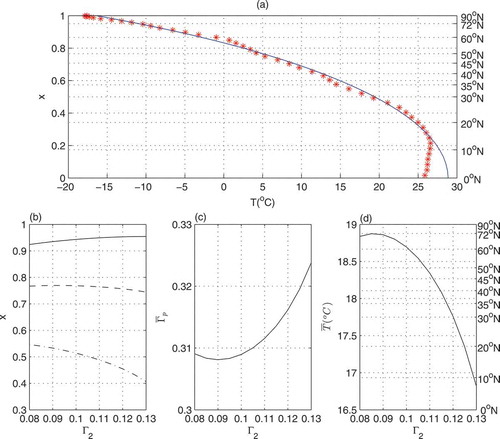
) shows the variations of global-mean surface temperature, xs, xd, and xv, with the concentration of CO2 when = 0.1. As the concentration of CO2 rises, global-mean temperature shows a transient decrease, corresponding to the expansion of polar ice and mid-latitude desert when the concentration of CO2 is lower. The global-mean temperature continues to increase as CO2 increases until the concentration of CO2 reaches 600 ppm, i.e. a ‘saturated’ state. During this process, the south boundary of polar ice (xs) continues to move northward and the north boundary of the low-latitude vegetation belt (xv) continues to move southward. However, the north boundary of the mid-latitude desert (xd) moves northward until the concentration of CO2 reaches 600 ppm. This suggests that under increasing CO2, the mid-latitude desert will expand both northward and southward. When the concentration of CO2 reaches 600 ppm, the mid-latitude desert only expands southward.
Figure 4. The variations of global-mean (a) surface temperature, (b) xs, (c) xd, and (d) xv with the concentration of CO2 when = 0.08 (blue diamonds) and
= 0.1 (red circles).
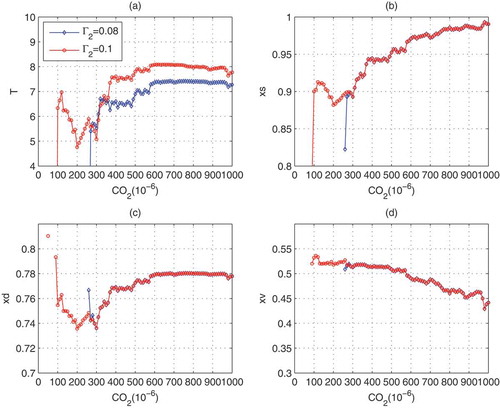
When the albedo of the high-latitude vegetation belt is reduced by 20% ( = 0.08, ) and the concentration of CO2 is greater than at present (400 ppm), the global-mean temperature rises as CO2 increases, and reaches a ‘saturated’ state when the CO2 concentration reaches 600 ppm. However, the global-mean temperature in the ‘saturated’ state when
= 0.08 is always lower than that when
= 0.1, which is likely due to the stronger cooling in high latitudes induced by high-latitude greening ().
5. Conclusion and discussion
Changes in the mid-latitude desert belt greatly affect the ecological environment of the surrounding areas, and the desert ecosystem is vulnerable to climate change; various factors and mechanisms are involved. This paper investigated the remote effects of greening in the high-latitude vegetation belt using a two-dimensional EBM. We found that when greening occurs in the high-latitude vegetation belt, the mid-latitude desert recedes at the south boundary, while the polar ice belt and low-latitude vegetation belt both expand. In addition, high-latitude greening also induces a cooling trend in high latitudes and a warming trend in low latitudes. Therefore, high-latitude greening is helpful in offsetting the shrinkage of polar ice and the expansion of semi-arid regions driven by global warming.
When the concentration of CO2 increases, the simulation results suggest that the mid-latitude desert will expand its southern and northern boundaries. However, the response of global-mean temperature and the north boundary of the mid-latitude desert both reach ‘a saturated’ state when the CO2 concentration reaches 600 ppm; i.e. the global-mean temperature remains constant although CO2 continues to increase. In contrast to the greening phenomenon in high latitudes, the above-mentioned feature always exists. The only change induced by high-latitude greening is that the global-mean temperature in the ‘saturated’ state is lower than that without high-latitude greening.
The expansion of the semi-arid area results from many mechanisms, including positive and negative feedback. The simple EBM can distinguish the influences of different mechanisms according to its simple and concise nature. The results suggest that high-latitude vegetation greening may induce shrinkage of desert areas when only temperature advection and albedo–temperature feedback are considered. However, regarding the remote effects of high-latitude vegetation greening, the model did not consider circulation changes. In addition, greening over high latitudes could also lead to lower surface temperatures via intensified evaporation, which is weaker than the warming induced by decreasing albedo demonstrated in a recent study (Forzieri et al. Citation2017). Therefore, the influence of high-latitude vegetation greening on global temperatures requires further investigation via a fully coupled Earth system simulation model, such as the Community Earth System Model.
Disclosure statement
No potential conflict of interest was reported by the authors.
Additional information
Funding
References
- Chao, J., and Y. Chen. 1980. “The Effects of Ice Caps-Albedo Feedback on the Global Climate in Two-Dimensional Energy Balance Model.” Scientia Sinica 3: 320–330.
- Chao, J., and Y. Li. 2010a. “Evolution of Desertification in a Two-Dimensional Energy Balance Model Coupled with Thermodynamics and Dynamics.” [in Chinese] Science China Earth Sciences 53 (11): 1060–1067. doi:10.1007/s11430-010-4032-x.
- Chao, J., and Y. Li. 2010b. “Response of Atmospheric Temperature to Carbon Dioxide Warming in Two-Dimensional Energy Balance Mode.” [in Chinese] Acta Meteorologica Sinica 68(2): 147–152.
- Forzieri, G., R. Alkama, D. G. Miralles, and A. Cescatti. 2017. “Satellites Reveal Contrasting Responses of Regional Climate to the Widespread Greening of Earth.” Science 356 (6343): 1180–1184. doi:10.1126/science.aal1727.
- Guan, X., J. Huang, R. Guo, P. Lin, and Y. Zhang. 2015. “Role of Radiatively Forced Temperature Changes in Enhanced Semi-Arid Warming over East Asia.” Atmospheric Chemistry and Physics Discussions 15 (16): 22975–4. doi:10.5194/acpd-15-22975-2015.
- He, Y., J. Huang, H. H. Shugart, X. Guan, B. Wang, and K. Yu. 2017. “Unexpected Evergreen Expansion in the Siberian Forest under Warming Hiatus.” Journal of Climate 30 (13): 5021–5039. doi:10.1175/JCLI-D-16-0196.1.
- He, Y., J. Huang, and M. Ji. 2014. “Impact of Land–Sea Thermal Contrast on Interdecadal Variation in Circulation and Blocking.” Climate Dynamics 43 (12): 3267–3279. doi:10.1007/s00382-014-2103-y.
- Huang, J., X. Guan, and F. Ji. 2012. “Enhanced Cold-Season Warming in Semi-Arid Regions.” Atmospheric Chemistry and Physics 12 (12): 5391–5398. doi:10.5194/acp-12-5391-2012.
- Huang, J., H. Yu, X. Guan, G. Wang, and R. Guo. 2016a. “Accelerated Dryland Expansion under Climate Change.” Nature Climate Change 6 (2): 166–171. doi:10.1038/nclimate2837.
- Huang, J., M. Ji, Y. Xie, S. Wang, Y. He, and J. Ran. 2016b. “Global Semi-Arid Climate Change over Last 60 Years.” Climate Dynamics 46 (3–4), 1131–1150. doi:10.1007/s00382-015-2636-8.
- Huang, J., Y. Xie, X. Guan, D. Li, and F. Ji. 2017a. “The Dynamics of the Warming Hiatus over the Northern Hemisphere.” In Climate Dynamics 48 (1–2), 429–446. Berlin Heidelberg: Springer. doi:10.1007/s00382-016-3085-8.
- Huang, J., H. Yu, A. Dai, Y. Wei, and L. Kang. 2017b. “Drylands Face Potential Threat under 2 °c Global Warming Target.” Nature Climate Change 7 (6): 417–422. doi:10.1038/nclimate3275.
- Huang, J., J. Ma, X. Guan, Y. Li, and Y. He. 2019. “Progress in Semi-Arid Climate Change Studies in China.” Advances in Atmospheric Sciences 36 (9): 922–937. doi:10.1007/s00376-018-8200-9.
- Kharuk, V. I., M. L. Dvinskaya, K. J. Ranson, and S. T. Im. 2005. “Expansion of Evergreen Conifers to the Larch-Dominated Zone and Climatic Trends.” Russian Journal of Ecology 36 (3): 164–170. doi:10.1007/s11184-005-0055-5.
- Li, Y., and J. Chao. 2014. “Two-Dimensional Energy Balance Model and Its Application to Some Climatic Issues.” Acta Meteorologica Sinica 72 (5): 880–891. in Chinese. doi:10.11676/qxxb2014.061.
- Piao, S., G. Yin, J. Tan, L. Cheng, M. Huang, Y. Li, R. Liu, et al. 2015. “Detection and Attribution of Vegetation Greening Trend in China over the Last 30 Years.” Global Change Biology 21 (4): 1601–1609. doi:10.1111/gcb.12795.
- Piao, S., P. Friedlingstein, P. Ciais, N. Viovy, and J. Demarty. 2007. “Growing Season Extension and Its Impact on Terrestrial Carbon Cycle in the Northern Hemisphere over the past 2 Decades.” Global Biogeochemical Cycles 21 (3): 1–11. doi:10.1029/2006GB002888.
- Schaaf, C., and Z. Wang. 2015. MCD43C3 MODIS/Terra+Aqua BRDF/Albedo Albedo Daily L3 Global 0.05Deg CMG V006. [Data set] distributed by NASA EOSDIS Land Processes DAAC. doi:10.5067/MODIS/MCD43C3.006. https://lpdaac.usgs.gov/products/mcd43c3v006/
- Shuman, J. K., H. H. Shugart, and T. L. O’Halloran. 2011. “Sensitivity of Siberian Larch Forests to Climate Change.” Global Change Biology 17 (7): 2370–2384. doi:10.1111/j.1365-2486.2011.02417.x.
- Wallace, J. M., F. Qiang, B. V. Smoliak, P. Lin, and C. M. Johanson. 2012. “Simulated versus Observed Patterns of Warming over the Extratropical Northern Hemisphere Continents during the Cold Season.” Proceedings of the National Academy of Sciences of the United States of America 109 (36): 14337–14342. doi:10.1073/pnas.1204875109.
- Wang, L., P. D’Odorico, J. P. Evans, D. J. Eldridge, M. F. McCabe, K. K. Caylor, and E. G. King. 2012. “Dryland Ecohydrology and Climate Change: Critical Issues and Technical Advances.” Hydrology and Earth System Sciences 16 (8): 2585–2603. doi:10.5194/hess-16-2585-2012.
- Zhu, Z., J. Bi, Y. Pan, S. Ganguly, A. Anav, L. Xu, A. Samanta, S. Piao, R. R. Nemani, and R. B. Myneni. 2013. “Global Data Sets of Vegetation Leaf Area Index (Lai)3g and Fraction of Photosynthetically Active Radiation (Fpar)3g Derived from Global Inventory Modeling and Mapping Studies (GIMMS) Normalized Difference Vegetation Index (NDVI3G) for the Period 1981 to 2.” Remote Sensing 5 (2): 927–948. doi:10.3390/rs5020927.
- Zhu, Z., S. Piao, R. B. Myneni, M. Huang, Z. Zeng, J. G. Canadell, P. Ciais, et al. 2016. “Greening of the Earth and Its Drivers.” Nature Climate Change 6 (8): 791–795. doi:10.1038/nclimate3004.