
 ?Mathematical formulae have been encoded as MathML and are displayed in this HTML version using MathJax in order to improve their display. Uncheck the box to turn MathJax off. This feature requires Javascript. Click on a formula to zoom.
ABSTRACT
Multi-year experiments are conducted using the most recent version of the Abdus Salam International Centre for Theoretical Physics regional climate model RegCM4 (version 4.7) to customize its performance over Southeast Asia — a region with few RCMs applied to date. The model is driven by ERA-Interim reanalysis data at a grid spacing of 25 km using the CORDEX (Coordinated Regional Climate Downscaling Experiment) Southeast Asia domain. The authors focus on comparing the convection schemes of Emanuel and Tiedtke (Tiedtke-1) and Tiedtke with effects of sea surface evaporation introduced (Tiedtke-2). The authors find that, for temperature over land, the model shows reasonable performance in reproducing the present-day climatology in both December–January–February (DJF) and June–July–August (JJA) in all the experiments. Meanwhile, cold biases prevail in both seasons, although portions of warm bias exist in DJF. For precipitation, the spatial pattern and amount, as well as seasonal evolution, are in general reproduced well in the experiments. Better performances of Tiedtke-1 and Tiedtke-2 are evident compared to Emanuel, particularly over ocean. Thereby, the optimal configuration of RegCM4.7 for future climate change simulations over the region is identified as using the Tiedtke scheme with spray effects considered, along with the default settings for other physical parameterizations.
Graphical Abstract
摘要
东南亚地区开展的区域气候模式模拟较少。为评估并确认RegCM4最新版本 (4.7) 在这一地区的模式配置, 本文进行了三组水平分辨率为25km的多年模拟试验, 分别为使用Emanuel和使用Tiedtke (Tiedtke-1) 对流参数化方案, 以及引入了海表面蒸发效应的Tiedtke (Tiedtke-2) 方案, 模拟范围为CORDEX-东南亚区域。分析表明, 模式对该区域当代DJF和JJA陆地气温的气候态特征具有较好的模拟能力;冷偏差在两个季节均普遍存在, 但冬季模拟中部分地区存在暖偏差。对降水而言, 各个试验均能够在整体上再现不同季节降水的空间分布, 降水量以及季节演变特征, 但Tiedtke-1与Tiedtke-2的模拟结果均要明显的好于Emanuel, 特别是在海上。这一区域的RegCM4设置由此确认为使用Tiedtke-2及其他模式缺省的物理参数化过程, 并将应用于未来的气候变化模拟之中。
1. Introduction
Most of Southeast Asia is located within the warm and humid tropics and is dominated by a monsoon climate. The region is characterized by complex topography, dense population, rich biodiversity, and delicate ecosystems. Significant climate change has been observed over the region in recent decades, including rising temperatures and an increasing of extreme events. Owing to an imbalance in economic development, Southeast Asia is one of the most vulnerable regions to climate change in the world (Hijioka et al. Citation2014; Overland and Vakulchuk Citation2017; Tangang, Juneng, and Ahmad Citation2007; Supari, Juneng, and Aldrian Citation2017). As measured by the ‘Global Climate Risk Index’, five of the world’s 10 countries most affected by climate change during 1996–2015 are located in Southeast Asia: Myanmar, the Philippines, Bangladesh, Vietnam, and Thailand (Kreft, Eckstein, and Melchior Citation2016). Therefore, obtaining reliable climate change information for the future is very important for assessing impacts, implementing adaptation measures, and thus lowering the risks from climate change over the region.
While global climate models are the primary tools in climate change projections, they show deficiencies over Southeast Asia — a region with complex topography and numerous islands — owing to their coarse resolutions (Schiemann et al. Citation2014). Thus, applying high-resolution regional climate models (RCMs) over the region is of high importance.
It is well known that different physical parameterization schemes in an RCM may greatly influence the behavior of the model and quality of the simulated results. To capture monsoon rainfall, selecting the most suitable cumulus convective parameterization scheme is probably the most crucial task. At scales unresolvable by models, such a scheme directly controls the physics that converts moisture to convective precipitation (Dash, Shekhar, and Singh Citation2006; Emanuel and Zivkovic-Rothman Citation1999; Huang, Chan, and Au-Yeung Citation2013; Molinari and Dudek Citation1992). In addition, the parameterization of surface latent heat flux over ocean, particularly in Southeast Asia where a large proportion of the region is covered by ocean, is also very important because it controls the quantity of moisture entering the atmosphere from the Earth’s surface (Chen and Avissar Citation1994; Li et al. Citation2016; Wang, Tao, and Simpson Citation1996).
Of the limited number of RCMs that have been applied previously over Southeast Asia, the Abdus Salam International Centre for Theoretical Physics’ RegCM series of models have been used either over different parts or the whole of the region (Chung et al. Citation2018; Francisco et al. Citation2006; Im et al. Citation2008; Juneng et al. Citation2016; Octaviani and Manomaiphiboon Citation2011; Phan, Ngo-Duc, and Ho Citation2009; Qian and Zubair Citation2010), with some focus on the sensitivity of the model to different parameterization schemes. In general, the Emanuel convection scheme (Emanuel and Zivkovic-Rothman Citation1999) performs better than the Grell scheme (Grell Citation1993), according to findings reported in the literature (Li et al. Citation2016; Juneng et al. Citation2016; Ngo-Duc et al. Citation2017; Wu et al. Citation2015). Nevertheless, the Tiedtke convection scheme (Tiedtke Citation1989), implemented in the most recent version of the model (RegCM4.7), has not yet been tested experimentally. Therefore, in the present study, we focus on comparing the Emanuel and Tiedtke schemes.
For the parameterization of ocean surface flux, we rebuild a new humidity roughness length expression and introduce a correction function considering the effect of spray. The effect of spray is very important (Andreas Citation1992; Fairall, Kepert, and Holland Citation1994) in climate simulations, particularly for extreme events, such as hurricane development, as reported by Bao et al. (Citation2000). Then, we conduct a series of three-year-long simulations to evaluate the performance of RegCM4 over the Southeast Asia domain of phase II of the Coordinated Regional Climate Downscaling Experiment (CORDEX) (Giorgi, Jones, and Asrar Citation2009). The aim of this paper is to determine the parameterization schemes to apply in RegCM4 for the ‘best’ performance over the domain in terms of future long-term climate change simulations.
The paper is structured as follows: The model, experimental design, and observational datasets used to validate the model’s performance are described in section 2; section 3 presents the model’s results using the different parameterization schemes; and a brief summary and discussion is provided in section 4.
2. Model, data and experimental design
RegCM4 (Giorgi et al. Citation2012) is an update from its previous version, RegCM3 (Pal et al. Citation2007). A continuous implementation and development of the model physics has been carried out since its first release, with version 4.7, employed in the present study, being the latest one. Note that RegCM is among the most commonly used RCMs globally and in particular over East Asia (Gao and Giorgi Citation2017).
The domain used mirrors the Southeast Asia domain of CORDEX, phase II, which extends from the southern part of China in the north down to northern Australia in the south, and from west of Sumatra Island to New Guinea Island in the east (http://www.cordex.org/domains/region-14-south-east-asia-sea/), at a grid spacing of 25 km. The model is run at the configuration of 23 vertical sigma layers, with the model top at 5 hPa. The ERA-Interim dataset (Uppala et al. Citation2008) at a resolution of 0.75°×0.75° (latitude × longitude, the same hereafter) is used to derive the initial and six-hourly-updated lateral meteorological boundary conditions needed to drive the model. The sea surface temperature data used in the simulations are also interpolated from ERA-Interim.
Three experiments are conducted using RegCM4 for the period 1 September 1999 to 30 March 2003, with the first three months used as model spin up and not included in the analysis. The first experiment (which we refer to as ‘Emanuel’) uses the default settings of the model, with the convection scheme of Emanuel and the sea surface flux scheme of Zeng1. The second experiment is the same as the first but uses Tiedtke for convection. We refer to this experiment as ‘Tiedtke-1’. For the last experiment (which we refer to as ‘Tiedtke-2’), firstly, a modified Zeng1 scheme is used to compare in Tiedtke-1. In the original Zeng1 scheme, the humidity (q) roughness length () is parameterized by:
where is the roughness Reynolds number, as caclulated by
, in which
is friction velocity,
is the momentum roughness length, and
is the kinematic viscosity of dry air (Fairall et al. Citation2003).
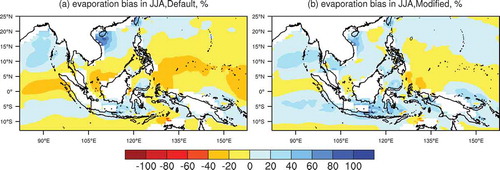
As reported by Li et al. (Citation2016), the rainfall amount is very sensitive to . In their experiments, changing the value of it in the BATS1e scheme significantly improved the simulations of latent heat flux and precipitation. Therefore, a series of sensitivity experiments have been conducted on the coefficients in the formula for a better reproduction of present climate, with the final formula applied in the study as follows:
Note that a constant value of is used in BATS1e (Dickinson, Henderson-Sellers, and Kennedy Citation1993) — the scheme in the previous versions of RegCM. As shown in , the large negative bias in surface evaporation simulation along the tropics is significantly reduced when using the updated
.
Figure 1. Biases of sea surface evaporation in JJA over ocean when using the (a) model default and (b) updated (units: %).
Furthermore, in Tiedtke-2, a simplified correction function (f in Equation (3)) is applied when the wind speed is strong to introduce the effects of spray on sensible and latent heat flux calculation over the ocean, as in Wu et al. (Citation2010):
where is the wind at the lowest level and
is an empirical function. This is based on the consideration that the atmosphere tends to be wetter due to sea spray, which reduces the humidity (temperature) difference between the lowest atmospheric humidity level and the saturation specific humidity (atmospheric potential temperature and the surface temperature).
Other model physical parameterizations used include CLM4.5 for the land surface (Oleson et al. Citation2010), subgrid-scale explicit moisture following Pal, Small, and Eltahir (Citation2000), the radiation package of NCAR’s Community Climate Model, version 3 (Kiehl et al. Citation1998), and a non-local planetary boundary layer (Holtslag, Debruijn, and Pan Citation1990).
The focus of analysis in the present paper is the mean surface air temperature over land and the precipitation over both land and ocean in December–January–February (DJF) and June–July–August (JJA) over the region (15°S–26°N, 89°–147°E), with the model buffer zone removed, as shown in . Two observational datasets — temperature from the Climatic Research Unit Time Series (CRU TS), version 4.02 (Harris et al. Citation2014), at a resolution of 0.5°×0.5°, and precipitation from the Tropical Rainfall Measuring Mission (TRMM) 3B42 product (Simpson et al. Citation1996), with a resolution of 0.25°×0.25° — are employed to validate the model simulation. The CRU data and model outputs are interpolated bilinearly to a common 0.25°×0.25° grid, as in TRMM, to facilitate the comparisons.
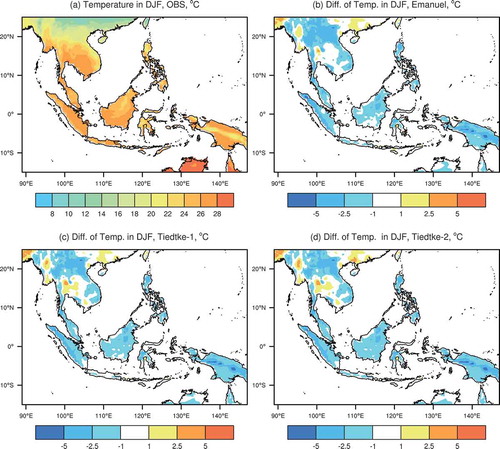
Figure 2. The (a) observed mean temperature in DJF, 2000–2002, over Southeast Asia, and (b–d) bias in the model when using different convection schemes (land only; units: °C): (b) Emanuel; (c) Tiedtke-1; (d) Tiedtke-2.
3. Results
3.1 Temperature
The mean temperature over land in DJF from observation and the bias (model minus observation) in the experiments are presented in . In the observation, temperatures exceeding 26°C dominate low-latitude areas, except over mountain chains on the islands. In northern Australia, the temperature reaches a maximum of greater than 28°C. North of 15°N, a latitudinal distribution is found, which drops to below 16°C in southern China.
The model biases show consistencies across the experiments, with a prevailing cold bias over most of the region. The cold biases are mostly in the range of 1–2°C, but are more pronounced over the mountain chains (>3°C), e.g., the Barisan Mountains in the west of Sumatra and in the New Guinea Highlands. The cold biases are also large in the northern part of the Indochina Peninsula, with warm biases found mainly in southern China and portions of Thailand and Myanmar. The spatial correlation coefficients (CORs) between simulations and observation, as well as the regional mean root-mean-square error (RMSE) and biases, show close values of around 0.96, 1.9°C and −0.3°C, as presented in .
Table 1. Spatial correlation coefficients (CORs; all statistically significant at the 95% confidence level; the same as below), root-mean-square error (RMSE; units: °C), and mean area bias (Bias; units: °C) between simulated and observed temperature, in DJF and JJA, over land only, under the different convection schemes.
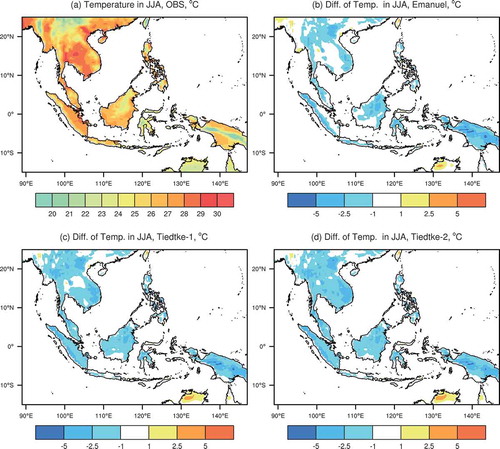
In boreal summer (JJA) (), following seasonal evolution, the maximum temperature (>28°C) is located over the plains in the Indochina Peninsular and in southern China, north of 15°N, in the observation. The prevailing cold bias still exists in all the simulations, similar to in DJF, with warm biases found mainly over northern Australia. Compared to DJF, the CORs are in general 0.1 lower, while close values for RMSE are found (). Regional mean biases are greater than for DJF, without the portions of positive biases, and with a smaller value for Emanuel (0.6°C) compared to Tiedtke-2 (−1.0°C) and Tiedtke-2 (−1.6°C). Notably, a general cold bias also exists in ERA-Interim over the region in both seasons, albeit to a lesser extent, indicating that at least part of the bias is inherited from the forcing field (figure not shown for brevity).
Figure 3. The (a) observed mean temperature in JJA, 2000–2002, over Southeast Asia, and (b–d) bias in the model when using different convection schemes (land only; units: °C): (b) Emanuel; (c) Tiedtke-1; (d) Tiedtke-2.
3.2 Precipitation
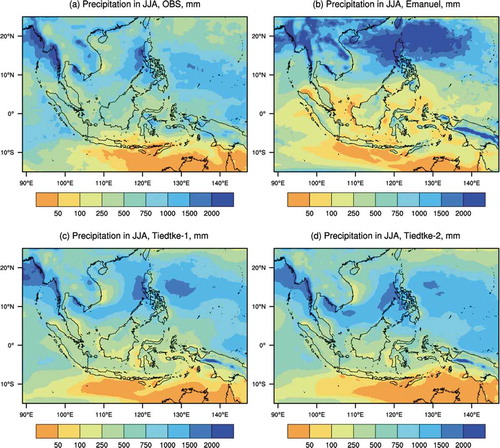
The spatial distributions of precipitation in DJF from observation and the simulations are presented in . Observationally, larger values are found along the equator and to its south, in the range of 500 mm to more than 1000 mm. It is generally dry in the north (<250 mm), with less than 100 mm of precipitation found over the area extending from the western boundary to the Indochina Peninsular ()). The pattern is generally captured well by all the simulations (). The common biases across the simulations include a large underestimation in western Sumatra Island in the Indian Ocean, and an overestimation over the Arafura Sea (south of New Guinea and north of eastern Australia). The latter wet bias is more pronounced in Emanuel.
Figure 4. The (a) observed and (b–d) simulated mean precipitation in DJF, 2000–2002, over Southeast Asia, when using different convection schemes (units: mm): (b) Emanuel; (c) Tiedtke-1; (d) Tiedtke-2.
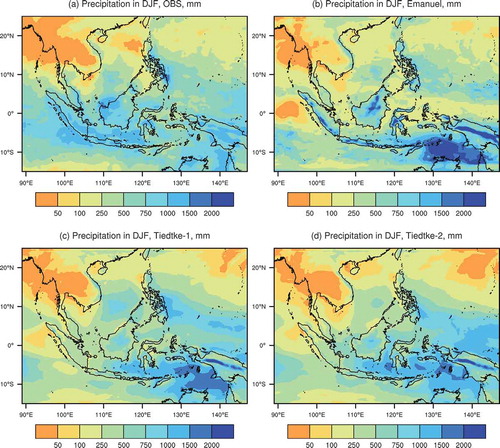
In general, Tiedtke-2 and Tiedtke-1 perform better compared to Emanuel. The CORs between simulations and observation over land/ocean are the largest for Tiedtke-2 at 0.62/0.68, closely followed by Tiedtke-1 at 0.60/0.61, and then noticeably lower values for Emanuel at 0.50/0.55 (). Also, the RMSE for Tiedtke-2 is less than for the other two experiments. The absolute values of biases over land are similar across the experiments, but with positive values for Emanuel and negative values for Tiedtke-1 and Tiedtke-2. Over ocean, the biases are all negative and lower than over land. The biases of Tiedtke-1 and Tiedtke-2 are less than for Emanuel, with slightly larger values found for Tiedtke-2.
Table 2. Spatial correlation coefficients (CORs), root-mean-square error (RMSE; units: mm), and mean area bias (Bias; units: %) between simulated and observed precipitation, in DJF and JJA, over land/ocean separately, under the different convection schemes.
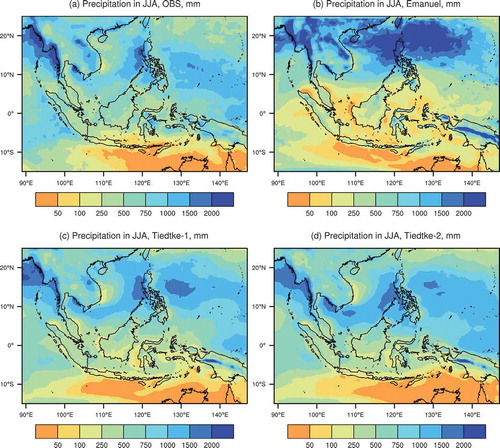
shows the observed and simulated precipitation in JJA. Compared to DJF, a northward shift of precipitation is found, with larger values in the range of 1000 to 1500 mm along ~15°N over the Bay of Bengal, the Annamese Cordillera in eastern Indochina, the eastern part of the South China Sea, and the Pacific Ocean west of the Philippines ()). The model generally reproduces these features, as shown in . However, larger discrepancies are found in Emanuel, characterized by a substantial overestimation along the belt around 20°N and an underestimation along the equator. The CORs for Tiedtke-1 and Tiedtke-2 are 0.1 higher over land and more than 0.40 higher (doubled) over ocean compared with Emanuel. The better performances of Tiedtke-1 and Tiedtke-2 are also evidenced by the lower RMSEs over both land and ocean, as well as the biases over land. The regional mean biases over ocean for the different schemes are all small and similar to one another. However, as shown in the figure, the lower values of Emanuel are mostly due to compensation of the large negative and positives biases in different areas. In general, Tiedtke-2 performs slightly better than Tiedtke-1 in JJA.
Figure 5. The (a) observed and (b–d) simulated mean precipitation in JJA, 2000–2002, over Southeast Asia, when using different convection schemes (units: mm): (b) Emanuel; (c) Tiedtke-1; (d) Tiedtke-2.
4. Summary and discussion
Three experiments are conducted using the most recent version of RegCM4 (version 4.7) to customize its performance over the Southeast Asia CORDEX region at a grid spacing of 25 km. We focus on comparing the convection schemes of Emanuel and Tiedtke, along with Tiedtke-2 in which the effects of sea surface evaporation are introduced.
Results show that, for temperature over land, the model performs reasonably well in reproducing the present-day temperature climatology over the region in both DJF and JJA. The temperature is not sensitive to the different convection schemes and spray effects, with systematic cold biases prevailing in the simulations. The CORs, RMSE and biases are similar, except for smaller biases for Emanuel in JJA. Larger CORs are found in DJF compared to JJA. Meanwhile, cold biases prevail in the simulations in both seasons, although portions of warm bias exist in DJF.
For precipitation, the spatial patterns and amounts, as well as the seasonal evolution, are generally reproduced well in all the experiments and in both seasons. Better performances of Tiedtke-1 and Tiedtke-2 are evident compared to Emanuel in both seasons and over both land and ocean. In particular, the CORs for Tiedtke-1 and Tiedtke-2 are doubled over ocean in JJA compared to Emanuel. Tiedtke-2 generally performs better than Tiedtke-1, but only by a small amount. In conclusion, the optimal model configuration for the region is identified as Tiedtke-2.
In future work, we intend to use the model configuration in a multidecadal simulation to further evaluate its performance, including the aspects of interannual variability and extremes. Further improvements of the model will then be carried out based on specifically designed experiments to check and identify the major reasons for the model biases and shortcomings, with possible implementation of new physical processes. Finally, climate change projections over the Southeast Asia CORDEX domain will be carried out towards a goal to provide more scientifically robust information on climate change in the region.
Disclosure statement
No potential conflict of interest was reported by the authors.
Additional information
Funding
References
- Andreas, E. L. 1992. “Sea Spray and the Turbulent Air-Sea Heat Fluxes.” Journal of Geophysical Research-Oceans 97 (C7): 11429–11441. doi:10.1029/92jc00876.
- Bao, J. W., J. M. Wilczak, J. K. Choi, and L. H. Kantha. 2000. “Numerical Simulations of Air-Sea Interaction under High Wind Conditions Using A Coupled Model: A Study of Hurricane Development.” Monthly Weather Review 128 (7): 2190–2210. doi:10.1175/1520-0493(2000)128<2190:nsoasi>2.0.co;2.
- Chen, F., and R. Avissar. 1994. “Impact of Land-Surface Moisture Variability on Local Shallow Convective Cumulus and Precipitation in Large-Scale Models.” Journal of Applied Meteorology 33 (12): 1382–1401. doi:10.1175/1520-0450(1994)033<1382:iolsmv>2.0.co;2.
- Chung, J. X., L. Juneng, F. T. Tangang, and A. F. Jamaluddin. 2018. “Performances of BATS and CLM Land-surface Schemes in RegCM4 in Simulating Precipitation over CORDEX Southeast Asia Domain.” International Journal of Climatology 38: 794–810. doi:10.1002/joc.5211.
- Dash, S. K., M. S. Shekhar, and G. P. Singh. 2006. “Simulation of Indian Summer Monsoon Circulation and Rainfall Using Regcm3.” Theoretical and Applied Climatology 86 (1–4): 161–172. doi:10.1007/s00704-006-0204-1.
- Dickinson, R. E., A. Henderson-Sellers, and P. J. Kennedy. 1993. “Biosphere-Atmosphere Transfer Scheme (Bats) Version Le as Coupled to the Ncar Community Climate Model.” NCAR Technical Note NCAR/TN-387+STR 72p.
- Emanuel, K. A., and M. Zivkovic-Rothman. 1999. “Development and Evaluation of a Convection Scheme for Use in Climate Models.” Journal of the Atmospheric Sciences 56 (11): 1766–1782. doi:10.1175/1520-0469(1999)056<1766:daeoac>2.0.co;2.
- Fairall, C. W., E. F. Bradley, J. E. Hare, A. A. Grachev, and J. B. Edson. 2003. “Bulk Parameterization of Air-Sea Fluxes: Updates and Verification for the Coare Algorithm.” Journal of Climate 16 (4): 571–591. doi:10.1175/1520-0442(2003)016<0571:bpoasf>2.0.co;2.
- Fairall, C. W., J. D. Kepert, and G. J. Holland. 1994. “The Effect of Sea Spray on Surface Energy Transports over the Ocean.” Global Atmosphere and Ocean System 2 (2–3): 121–142.
- Francisco, R. V., J. Argete, F. Giorgi, J. Pal, X. Bi, and W. J. Gutowski. 2006. “Regional Model Simulation of Summer Rainfall over the Philippines: Effect of Choice of Driving Fields and Ocean Flux Schemes.” Theoretical and Applied Climatology 86 (1–4): 215–227. doi:10.1007/s00704-005-0216-2.
- Gao, X. J., and F. Giorgi. 2017. “Use of the Regcm System over East Asia: Review and Perspectives.” Engineering 3 (5): 766–772. doi:10.1016/j.eng.2017.05.019.
- Giorgi, F., E. Coppola, F. Solmon, L. Mariotti, M. B. Sylla, X. Bi, N. Elguindi, et al. 2012. “Regcm4: Model Description and Preliminary Tests over Multiple Cordex Domains.” Climate Research 52 (1): 7–29. doi:10.3354/cr01018.
- Giorgi, F., C. Jones, and G. Asrar. 2009. “Addressing Climate Information Needs at the Regional Level: The Cordex Framework.” World Meteorological Organization (WMO) Bulletin 58 (3): 175–183.
- Grell, G. A. 1993. “Prognostic Evaluation of Assumptions Used by Cumulus Parameterizations.” Monthly Weather Review 121 (3): 764–787. doi:10.1175/1520-0493(1993)121<0764:peoaub>2.0.co;2.
- Harris, I., P. D. Jones, T. J. Osborn, and D. H. Lister. 2014. “Updated High-Resolution Grids of Monthly Climatic Observations - the Cru Ts3.10 Dataset.” International Journal of Climatology 34 (3): 623–642. doi:10.1002/joc.3711.
- Hijioka, Y., E. Lin, J. J. Pereira, R. T. Corlett, X. Cui, G. E. Insarov, R. D. Lasco, E. Lindgren, and A. Surjan. 2014. Climate Change 2014: Impacts, Adaptation, and Vulnerability. Part B: Regional Aspects. Contribution of Working Group Ii to the Fifth Assessment Report of the Intergovernmental Panel on Climate Change, p1327–1370. Cambridge, NY: Cambridge University Press.
- Holtslag, A. A. M., E. I. F. Debruijn, and H. L. Pan. 1990. “A High-Resolution Air-Mass Transformation Model for Short-Range Weather Forecasting.” Monthly Weather Review 118 (8): 1561–1575. doi:10.1175/1520-0493(1990)118<1561:ahramt>2.0.co;2.
- Huang, W. R., J. C. L. Chan, and A. Y. M. Au-Yeung. 2013. “Regional Climate Simulations of Summer Diurnal Rainfall Variations over East Asia and Southeast China.” Climate Dynamics 40 (7–8): 1625–1642. doi:10.1007/s00382-012-1457-2.
- Im, E. S., J. B. Ahn, A. R. Remedio, and W. T. Kwon. 2008. “Sensitivity of the Regional Climate of East/Southeast Asia to Convective Parameterizations in the Regcm3 Modelling System. Part 1: Focus on the Korean Peninsula.” International Journal of Climatology 28 (14): 1861–1877. doi:10.1002/joc.1664.
- Juneng, L., F. Tangang, J. X. Chung, S. T. Ngai, T. W. Tay, G. Narisma, F. Cruz, et al. 2016. “Sensitivity of Southeast Asia Rainfall Simulations to Cumulus and Air-Sea Flux Parameterizations in Regcm4.” Climate Research 69 (1): 59–77. doi:10.3354/cr01386.
- Kiehl, J. T., J. J. Hack, G. B. Bonan, B. A. Boville, D. L. Williamson, and P. J. Rasch. 1998. “The National Center for Atmospheric Research Community Climate Model: CCM3.” Journal of Climate 11 (6): 1131–1149. doi:10.1175/1520-0442(1998)011<1131:tncfar>2.0.co;2.
- Kreft, S., D. Eckstein, and I. Melchior. 2016. Global Climate Risk Index 2017: Who Suffers Most from Extreme Weather Events? Weather-Related Loss Events in 2015 and 1996 to 2015, 1–31. Bonn, Germany: GermanwatchNord-Süd Initiative eV.
- Li, Y.-B., C.-Y. Tam, W.-R. Huang, K. K. W. Cheung, and Z. Gao. 2016. “Evaluating the Impacts of Cumulus, Land Surface and Ocean Surface Schemes on Summertime Rainfall Simulations over East-to-Southeast Asia and the Western North Pacific by Regcm4.” Climate Dynamics 46 (7–8): 2487–2505. doi:10.1007/s00382-015-2714-y.
- Molinari, J., and M. Dudek. 1992. “Parameterization of Convective Precipitation in Mesoscale Numerical-Models - a Critical-Review.” Monthly Weather Review 120 (2): 326–344. doi:10.1175/1520-0493(1992)120<0326:pocpim>2.0.co;2.
- Ngo-Duc, T., F. T. Tangang, J. Santisirisomboon, F. Cruz, T. T. Long, N. X. Thanh, P. V. Tan, et al. 2017. “Performance Evaluation of Regcm4 in Simulating Extreme Rainfall and Temperature Indices over the Cordex-Southeast Asia Region.” International Journal of Climatology 37 (3): 1634–1647. doi:10.1002/joc.4803.
- Octaviani, M., and K. Manomaiphiboon. 2011. “Performance of Regional Climate Model Regcm3 over Thailand.” Climate Research 47 (3): 171–186. doi:10.3354/cr00990.
- Oleson, K. W., D. W. Lawrence, G. Bonan, B. M. Flanner, G. K. Erik, and P. J. Lawrence. 2010. “Technical Description of Version 4.0 of the Community Land Model (Clm).” NCAR Technical Note, NCAR/TN-478+STR, 257.
- Overland, I., and R. Vakulchuk. 2017. “Impact of Climate Change on Asean International Affairs: Risk and Opportunity Multiplier.” NUPI Report. Norwegian Institute of International Affairs and Myanmar Institute of International and Strategic Studies.
- Pal, J. S., F. Giorgi, X. Bi, N. Elguindi, F. Solmon, X. Gao, S. A. Rauscher, et al. 2007. “Regional Climate Modeling for the Developing World - the Ictp Regcm3 and Regcnet.” Bulletin of the American Meteorological Society 88 (9): 1395–1410. doi:10.1175/bams-88-9-1395.
- Pal, J. S., E. E. Small, and E. A. B. Eltahir. 2000. “Simulation of Regional-Scale Water and Energy Budgets: Representation of Subgrid Cloud and Precipitation Processes within Regcm.” Journal of Geophysical Research-Atmospheres 105 (D24): 29579–29594. doi:10.1029/2000jd900415.
- Phan, V. T., T. Ngo-Duc, and T. M. H. Ho. 2009. “Seasonal and Interannual Variations of Surface Climate Elements over Vietnam.” Climate Research 40 (1): 49–60. doi:10.3354/cr00824.
- Qian, J. H., and L. Zubair. 2010. “The Effect of Grid Spacing and Domain Size on the Quality of Ensemble Regional Climate Downscaling over South Asia during the Northeasterly Monsoon.” Monthly Weather Review 138 (7): 2780–2802. doi:10.1175/2010mwr3191.1.
- Schiemann, R., M. E. Demory, M. S. Mizielinski, M. J. Roberts, L. C. Shaffrey, J. Strachan, and P. L. Vidale. 2014. “The Sensitivity of the Tropical Circulation and Maritime Continent Precipitation to Climate Model Resolution.” Climate Dynamics 42 (9–10): 2455–2468. doi:10.1007/s00382-013-1997-0.
- Simpson, J., C. Kummerow, W. K. Tao, and R. F. Adler. 1996. “On the Tropical Rainfall Measuring Mission (TRMM).” Meteorology and Atmospheric Physics 60 (1–3): 19–36. doi:10.1007/bf01029783.
- Supari, F. T., T. L. Juneng, and E. Aldrian. 2017. “Observed Changes in Extreme Temperature and Precipitation over Indonesia.” International Journal of Climatology 37 (4): 1979–1997. doi:10.1002/joc.4829.
- Tangang, F. T., L. Juneng, and S. Ahmad. 2007. “Trend and Interannual Variability of Temperature in Malaysia: 1961–2002.” Theoretical and Applied Climatology 89 (3–4): 127–141. doi:10.1007/s00704-006-0263-3.
- Tiedtke, M. 1989. “A Comprehensive Mass Flux Scheme for Cumulus Parameterization in Large-Scale Models.” Monthly Weather Review 117 (8): 1779–1800. doi:10.1175/1520-0493(1989)117<1779:acmfsf>2.0.co;2.
- Uppala, S., D. Dee, S. Kobayashi, P. Berrisford, and A. Simmons. 2008. “Towards a Climate Data Assimilation System: Status Update of Era-Interim.” ECMWF Newsletter 115: 12–18.
- Wang, Y. S., W. K. Tao, and J. Simpson. 1996. “The Impact of Ocean Surface Fluxes on a Toga Coare Convective System.” Monthly Weather Review 124 (12): 2753–2763. doi:10.1175/1520-0493(1996)124<2753:tioosf>2.0.co;2.
- Wu, J., X. J. Gao, Y. L. Xu, and J. Pan. 2015. “Regional Climate Change and Uncertainty Analysis Based on Four Regional Climate Model Simulations over China.” Atmospheric and Oceanic Science Letters 8 (3): 147–152. doi:10.3878/aosl20150013.
- Wu, T., R. Yu, F. Zhang, Z. Wang, M. Dong, L. Wang, X. Jin, D. Chen, and L. Li. 2010. “The Beijing Climate Center Atmospheric General Circulation Model: Description and Its Performance for the Present-Day Climate.” Climate Dynamics 34 (1): 123–147. doi:10.1007/s00382-008-0487-2.