
 ?Mathematical formulae have been encoded as MathML and are displayed in this HTML version using MathJax in order to improve their display. Uncheck the box to turn MathJax off. This feature requires Javascript. Click on a formula to zoom.
ABSTRACT
As the only alkaline gas in the atmosphere, ammonia could react with sulfur dioxide and nitrogen oxides to form the secondary particles. A large amount of NH3 in the atmosphere accelerates the rate of formation of fine particles; it therefore plays an important role in haze pollution. Livestock and poultry farming and nitrogen fertilizer application are the two main NH3 emission sources. Jiangsu Province contributes the largest proportion of NH3 emissions from agriculture in key areas of national air pollution control in China. The aims of this study are to investigate NH3 emissions from agriculture in Jiangsu Province using the emissions factor method, and analyze and summarize the characteristics and trends of NH3 emissions from 2000 to 2017. Results show that the NH3 emissions from agriculture in Jiangsu Province from 2000 to 2017 were mainly contributed by livestock and poultry farming (78.08%) and nitrogen fertilizer application (21.92%). Furthermore, a general fluctuation trend of an initial decrease and then an increase, of NH3 emissions from agriculture, could be found from 2000 to 2012, with minimum NH3 emissions in 2007 (708.76 kt yr−1) and maximum emissions in 2012 (837.64 kt yr−1); and then a decreasing trend was apparent from 2012 (837.64 kt yr−1) to 2017 (690.64 kt yr−1). A detailed estimation of the interannual trends and potential measures are also proposed. This study provides a solid theoretical foundation for the development of NH3 emissions control in Jiangsu Province.
Graphical abstract

摘要
氨气是大气中的微量碱性气体, 可以与酸性气体二氧化硫和氮氧化物的氧化产物发生化学反应, 生成硫酸铵和硝酸铵等二次颗粒物。大量氨存在会加速细颗粒物的生成速率, 在霾污染的形成过程中具有重要作用。畜禽养殖和氮肥施用是氨排放清单中最主要的两个排放源。江苏省农业源氨排放量居于国家大气污染防治重点区域各省市第一。本文利用排放因子法对2000–2017年江苏省农业源氨排放进行了估算, 研究江苏省18年来氨排放的特征及变化趋势。结果表明, 2000–2017年江苏省农业源氨排放平均78.08%来源于畜禽养殖, 21.92%来源于氮肥施用, 并且排放趋势呈现波动式变化。2000–2012年氨排放呈现先降低后增加的趋势, 2007年出现最小氨排放为708.76 kt yr−1, 2012年出现最大氨排放为837.64 kt yr−1。2012–2017年呈现下降趋势, 2017年农业源氨排放为690.64 kt yr−1。本文对年际变化趋势进行了详细的估计, 并提出了可能的应对措施, 将为江苏省开展氨气排放控制提供科学基础。
1. Introduction
Ammonia (NH3) is the only alkaline trace gas with appreciable concentration in the atmosphere (Zeng, Tian, and Pan Citation2018; Li et al. Citation2019a; Huang et al. Citation2014). It has been confirmed that the sulfur dioxide and nitrogen oxides released by fuel burning and automobile exhausts could convert to sulfuric acid and nitric acid in the atmosphere, which would further react with NH3 to form ammonium sulfate and ammonium nitrate. These products become condensation nuclei that can absorb water and combine with other pollutants to form fine particles (Cui et al. Citation2015; Huang et al. Citation2019; Torpo et al. Citation2007; Xu et al. Citation2019; Yu et al. Citation2019; Zheng et al. Citation2015). Therefore, NH3 is an important precursor for secondary particles, and is therefore considered as an important component of haze, bringing potential risks to public health (Kim et al. Citation2019; Pan et al. Citation2018; Zhang et al. Citation2019; Huang et al. Citation2014). In addition to the haze pollution caused by NH3 emissions, after atmospheric deposition, NH3 can dissolve in water to cause water eutrophication, destroying aquatic ecosystems (Posch et al. Citation2015; Duan et al. Citation2016; Li et al. Citation2019b). Yet, little is known about the sources and change trends of atmospheric NH3.
Ammonia emissions derive mainly from anthropogenic sources, including agricultural emissions, industrial processes, traffic emissions, waste treatment, and other human activities (Huang et al. Citation2012; Clarisse et al. Citation2009; Zeng, Tian, and Pan Citation2018), among which the largest contributor is agricultural emissions, including two main pathways: nitrogen fertilizer application, and livestock and poultry farming. Of these, nitrogen fertilizer application accounts for approximately 40%, and livestock and poultry farming approximately 50%, of total anthropogenic NH3 emissions worldwide (Zhang et al. Citation2018). Therefore, estimating the characteristics of NH3 emissions from agricultural sources, especially from livestock and poultry farming and nitrogen fertilizer application, is imperative for developing NH3 reduction strategies for specific regions.
Jiangsu Province is the largest contributor to China’s agricultural NH3 emissions in key areas of national air pollution control (Shen, Yu, and Xiang Citation2018; http://meicmodel.org/about.html). In addition, Jiangsu Province applies the second largest amount of nitrogen fertilizer in China. Therefore, the aims of this study are to investigate the NH3 emissions from agriculture in Jiangsu Province from 2000 to 2017, using the emissions factor method, and analyze and summarize the characteristics and trends of NH3 emissions during this period.
2. Materials and methods
2.1. Study area
The study area is Jiangsu Province, located in eastern China, in the lower Yangtze River Delta region. It is a plain area with many lakes and an abundance of water systems. It belongs to the transitional climate from temperate to subtropical. It has moderate rainfall, and the average temperature is between 13°C and 16°C.
2.2. Estimation method
According to the ‘Technical Guide for the Preparation of Atmospheric Ammonia Source Emission Inventory’ (Song Citation2014), the most commonly used NH3 emissions calculation method at home and abroad —the emissions factor method— was selected in this study. The quantity of NH3 emissions is presented by the activity level multiplied by the emissions factor. The calculation can be summarized as:
where i is the source type, j is the year, and Ei,j is the NH3 emissions of year j for source i. A is the activity level and EF is the emissions factor.
Activity level refers to the amount of NH3 activity in a certain area within a certain period of time. In this study, activity level means the amount of livestock and poultry and the amount of nitrogen fertilizer applied. The emissions factor refers to the amount of NH3 emitted per unit of activity level.
2.3. Determination of emissions factor
There are three main methods for determining the emissions factor: actual measurement, model calculation, and literature research. However, the emissions factor is considerably uncertain, due to the complex sources and factors of influence involved in NH3 emissions.
For nitrogen fertilizer application sources, the main influencing factors include soil acidity and alkalinity, temperature, nitrogen fertilizer type, and application rate. The types of nitrogen fertilizer commonly used in China are urea, ammonium nitrate, ammonium bicarbonate, thiamine, and other nitrogen fertilizers. According to the ‘Chinese Soil Acid-base Distribution Map’, soil in most parts of Jiangsu is weakly alkaline and alkaline. Based on the ‘Technical Guide for the Preparation of Atmospheric Ammonia Source Emission Inventory’ (Song Citation2014), the NH3 emission factors of nitrogen fertilizer application in alkaline soil at 10°C–20°C are summarized as follows: urea (14.66), ammonium bicarbonate (6.93), ammonium nitrate (0.4), thiamine (1.4), other nitrogen fertilizers (0.23).
For livestock and poultry farming sources, NH3 emission factors are mainly affected by temperature, housing, and manure management. As pig, cattle, sheep, and poultry are the top four livestock in Jiangsu Province, the NH3 emission factors of these four livestock types were investigated in this study. According to the ‘Technical Guide for the Preparation of Atmospheric Ammonia Source Emission Inventory’ (Song Citation2014), the NH3 emission factors of intensive culture and free-range culture at 10–20°C are calculated as follows: pig > 1a (4.21), pig <1a (0.48), cattle > 1a (39.24), cattle < 1a (11.84), sheep > 1a (5.48), sheep < 1a (3.34), poultry > 1a (0.36), poultry < 1a (0.04). ‘1a’ indicates the farming cycle is one year. As there is little difference between these two culture methods, the average values of these two methods were used for calculating the NH3 emissions of various livestock and poultry in this study.
2.4. Sources of activity level data
The activity level data in this study mainly include the amount of nitrogen fertilizer applied and the amount of livestock and poultry (pig, cattle, sheep, poultry) in Jiangsu Province. The data for nitrogen fertilizer application come from ‘The China Statistical Yearbook’ (National Bureau of Statistics Citation2001–18). The proportions of urea, ammonium bicarbonate, ammonium nitrate, thiamine, and other nitrogen fertilizers in total nitrogen fertilizer application in Jiangsu Province are 70%, 12%, 1.5%, 1.3%, and 15.2%, respectively (Deng and Luo Citation2018).
The data for livestock and poultry farming come from ‘The China Animal Husbandry and Veterinary Yearbook’ (Editorial Board of China Animal Husbandry and Veterinary Yearbook Citation2014–18) and ‘The China Animal Husbandry Yearbook’ (Editorial Board of China Animal Husbandry and Veterinary Yearbook, Citation2001–13).
3. Results
3.1. Estimation of NH3 emissions from nitrogen fertilizer application
A relatively stable nitrogen fertilizer application rate was found from 2000 to 2009 (), with an average of 170–180 kt yr−1, followed by a clear decrease for 2010–17, and the least NH3 emissions were found in 2017, at 151.36 kt yr−1, which was a decrease of 16.7% compared to 2009. The maximum rate of NH3 emissions over the study period was 189.27 kt yr−1 in 2000, the minimum was 151.36 kt yr−1 in 2017, and the average was 175.82 kt yr−1. The reason for this trend was that the agriculture commission of Jiangsu Province formulated ‘The Action Plan of Zero Growth of Fertilizer Use in Jiangsu Province by 2020’ (http://nynct.jiangsu.gov.cn/art/2015/4/15/art_51418_6178564.html).
Figure 1. Ammonia emissions from nitrogen fertilizer application in Jiangsu Province, China, from 2000 to 2017.
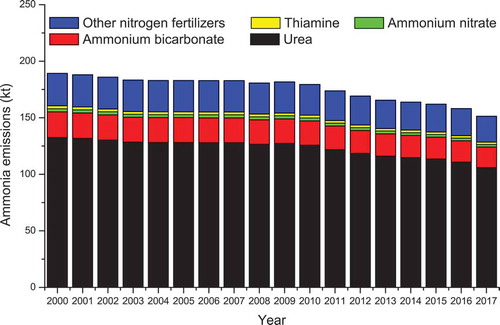
In addition, both urea and ammonium bicarbonate were the main sources of NH3 emissions, accounting for more than 80% of total NH3 emissions from nitrogen fertilizer applications. Stable NH3 emissions from both of them (~128.58 kt yr−1 for urea and ~22.04 kt yr−1 for bicarbonate) were found before 2010. From 2010, a continuous decline can be seen for both of them, and the NH3 emissions reached a minimum in 2017, which was mainly because of the decrease in the total nitrogen application rate for the last seven years (Song et al. Citation2018). The results further indicated that, with the development of techniques and improvement in agricultural production structure, agricultural production gradually requires less fertilizer (Song et al. Citation2018). By contrast, ammonium nitrate, thiamine, and other nitrogen fertilizers released less NH3, accounting for less than 20% in total.
3.2. Estimation of NH3 emissions from livestock and poultry farming
Moderate fluctuations of NH3 emissions from livestock and poultry farming were found in the study period (). Specifically, there was a fluctuating decline before 2007 and a continuous increase between 2007 and 2012. The lowest value was reached in 2007 (525.92 kt yr−1) and a peak of 668.45 kt yr−1 was reached in 2012. After 2012, the NH3 emissions from livestock and poultry farming from 2000 to 2017 kept falling to 539.28 kt yr−1 in 2017, which was a decrease of 19.3% compared to that of 2012. The lowest rate of NH3 emissions from livestock and poultry farming from 2000 to 2017 was 525.92 kt yr−1 in 2007, the highest was 668.45 kt yr−1 in 2012, and the average was 596.12 kt yr−1. The decrease verifies the effect of the government’s policy of developing high-quality, efficient, ecological animal husbandry (http://nynct.jiangsu.gov.cn/art/2012/3/22/art_13251_2573444.html).
Figure 2. Ammonia emissions from livestock and poultry farming in Jiangsu Province, China, from 2000 to 2017. '1a' indicates the farming cycle is one year.
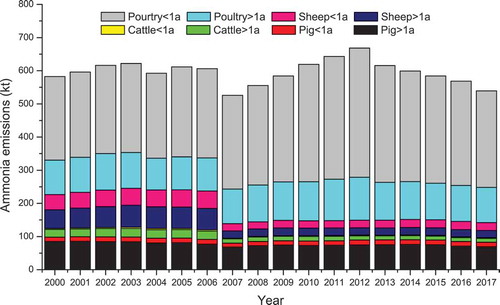
Additionally, poultry and pigs contributed the largest fraction of NH3 emissions from livestock and poultry, accounting for more than 80%. In comparison, less than 20% of NH3 emissions could be found from cattle and sheep, mainly because of their lower feeding rate in Jiangsu Province.
3.3. Estimation of NH3 emissions from agriculture
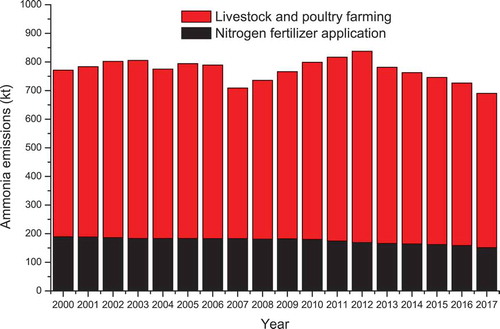
The estimation results of NH3 emissions from agriculture in Jiangsu Province from 2000 to 2017 are summarized in . Similar fluctuation trends to the results for livestock and poultry farming can be seen; that is, a decline to a minimum of 708.76 kt yr−1 in 2007, then an increase to a maximum of 837.64 kt yr−1 in 2012, and finally a fall to 690.64 kt yr−1 in 2017. Generally, the NH3 emissions fluctuated within 708.76 kt yr−1 to 837.64 kt yr−1, with an average of 771.94 kt yr−1.
Figure 3. Annual agricultural ammonia emissions in Jiangsu Province, China, from 2000 to 2017.
4. Discussion
During the study period, NH3 emissions from the application of nitrogen fertilizers presented a trend of remaining stable (average of 183 kt yr−1 before 2010) followed by a gradual decline (from 179.53 kt yr−1 in 2010 to 151.36 kt yr−1 in 2017). Among them, urea and ammonium nitrate were the main emission sources, accounting for more than 80% of the NH3 emissions from all nitrogen fertilizers.
With regards to the NH3 emissions from livestock and poultry farming, moderate fluctuation could be found during this period, with a peak of 668.45 kt yr−1 occurring in 2012 and a minimum of 525.92 kt yr−1 in 2007. Poultry and pigs were the main sources of NH3 emissions from livestock and poultry farming, accounting for 80%–90% in total. In general, agricultural NH3 emissions in Jiangsu Province from 2000 to 2017 were mainly composed of those from livestock and poultry farming (78.08%) and nitrogen fertilizer application (21.92%).
As the NH3 emissions from livestock and poultry farming and from nitrogen fertilizer application are the two primary pathways of agricultural NH3 emissions, it is reasonable to assume that these two contribute all agricultural NH3 emissions. The relative contribution of livestock and poultry farming and nitrogen fertilizer application from different regions of China were also compared and discussed in this study. As shown in Table S1, the NH3 emissions from livestock and poultry farming contributed 47.21% to 84.89% of the total agricultural NH3 emissions, while nitrogen fertilizer application contributed 15.11% to 52.79%, for six different study areas (Dong et al. Citation2009; Dong, Xing, and Wang Citation2010; Fang et al. Citation2015; Feng et al. Citation2017; Li and Li Citation2012; Li et al. Citation2019; Zhang et al. Citation2018; Zhou et al. Citation2016). The estimation of NH3 emissions has shown variability in different studies, meaning it highly depends on the selected emission factors and the different activity level data from region to region. Therefore, estimation work should be carried out on the basis of carefully selecting emission factors and activity level data.
Currently, haze pollution is getting worse in China. Due to the important role of NH3 in haze formation, reducing NH3 emissions is of great significance for air pollution control. In addition, the NH3 emissions profile is greatly different from region to region, so it is necessary to take measurements based on an understanding of the specific characteristics of NH3 emissions in the target region. Taking Jiangsu Province for example, on the one hand, due to the large amount of feeding of poultry and pigs, controlling NH3 emissions should be paid more attention. On the other hand, because the NH3 emissions from urea and ammonium bicarbonate account for about 80% of the nitrogen fertilizer application, the main focus for reducing NH3 emissions should be developing alternative fertilizers to urea and bicarbonate. Furthermore, as some factors of influence, such as soil acidity and alkalinity, temperature, nitrogen fertilizer type, application rate, and the kind of crop (i.e. wet or dry crops), could affect NH3 emissions from nitrogen fertilizer sources (Xu, Peng, and Yang Citation2009; Xia et al. Citation2010), the implementation of an NH3 control strategy should also give full consideration to the above factors.
Supplemental Material
Download PDF (637.1 KB)Disclosure statement
No potential conflicts of interest were reported by the authors.
Supplementary material
Supplemental data for this article can be accessed here.
Additional information
Funding
Related Research Data
References
- Clarisse, L., C. Clerbaux, F. Dentener, D. Hurtmans, and P. Coheur. 2009. “Global Ammonia Distribution Derived from Infrared Satellite Observations.” Nature Geoscience 2 (7): 479–483. doi:10.1038/ngeo551.
- Cui, H., W. Chen, D. Wei, W. Dai, H. Liu, X. Wang, and K. He. 2015. “Source Apportionment of PM 2.5 In Guangzhou Combining Observation Data Analysis and Chemical Transport Model Simulation.” Atmospheric Environment 116: 262–271. doi:10.1016/j.atmosenv.2015.06.054.
- Deng, M., and W. Luo. 2018. “Space-time Evolution of China’s Agricultural Ammonia Emissions and Analysis of Emission Reduction Potential.” Chinese Journal of Eco-Agriculture 26 (9): 1257–1268.
- Dong, W., J. Xing, and S. Wang. 2010. “Temporal and Spatial Distribution of Anthropogenic Ammonia Emissions in China: 1994–2006.” Environmental Science 31 (7): 1457–1463.
- Dong, Y., C. Chen, C. Huang, H. Wang, L. Li, P. Dai, and J. Jia. 2009. “Anthropogenic Emissions and Distribution of Ammonia over the Yangtze River Delta.” Acta Scientiae Circumstantiae 29 (8): 1611–1617.
- Duan, L., Q. Yu, Q. Zhang, and Z. Wang. 2016. “Acid Deposition in Asia: Emissions, Deposition, and Ecosystem Effects.” Atmospheric Environment 146: S782134562. doi:10.1016/j.atmosenv.2016.07.018.
- Editorial Board of China Animal Husbandry and Veterinary Yearbook. 2014–18. China Animal Husbandry and Veterinary Yearbook. Beijing: China Agriculture Press.
- Editorial Board of China Animal Husbandry Yearbook. 2001–13. China Animal Husbandry Yearbook. Beijing: China Agriculture Press.
- Fang, X., G. Shen, X. Xu, X. Qian, J. Li, Z. Zhao, S. Yu, and K. Zhu. 2015. “Agricultural Ammonia Emission Inventory and Its Distribution Characteristics in Shanghai.” Acta Agriculturae Zhejiangensis 27 (12): 2177–2185.
- Feng, X., G. Shen, X. Xu, X. Qian, and H. Ye. 2017. “Agricultural Ammonia Emission Inventory and Its Spatial Distribution in Sichuan Province from 2005 to 2014.” Environmental Science 32 (1): 37–42.
- Huang, L., J. An, B. Koo, G. Yarwood, R. Yan, Y. Wang, C. Huang, and L. Li. 2019. “Enhanced Sulfate Formation through SO2+NO2 Heterogeneous Reactions during Heavy Winter Haze in the Yangtze River Delta Region, China.” Atmospheric Chemistry and Physics Discussions 1–24. doi:10.5194/acp-2019-292.
- Huang, R., Y. Zhang, B. Carlo, K. Ho, J. Cao, Y. Han, K. Daellenbach et al. 2014. “High Secondary Aerosol Contribution to Particulate Pollution during Haze Events in China.” Nature 514 (7521): 218–222. doi:10.1038/nature13774.
- Huang, X., Y. Song, M. Li, J. Li, Q. Huo, X. Cai, T. Zhu, M. Hu, and H. Zhang. 2012. “A High-resolution Ammonia Emission Inventory in China.” Global Biogeochemical Cycles 26 (1): 1030. doi:10.1029/2011GB004161.
- Kim, I., K. Lee, S. Lee, and S. Kim. 2019. “Characteristics and Health Effects of PM2.5 Emissions from Various Sources in Gwangju, South Korea.” Science of the Total Environment 696: 133890. doi:10.1016/j.scitotenv.2019.133890.
- Li, T., M. Zhou, Y. Qiu, J. Huang, Y. Wu, S. Zhang, and H. Zhao. 2019b. “Membrane-based Conductivity Probe for Real-time In-situ Monitoring Rice Field Ammonia Volatilization.” Sensors and Actuators B: Chemical 286: 62–68. doi:10.1016/j.snb.2019.01.099.
- Li, T., M. Zhou, Z. Fan, X. Li, J. Huang, Y. Wu, H. Zhao, and S. Zhang. 2019a. “Online Conductimetric Flow-through Analyzer Based on Membrane Diffusion for Ammonia Control in Wastewater Treatment Process.” ACS Sensors 4 (7): 1881–1888. doi:10.1021/acssensors.9b00768.
- Li, X., and H. Li. 2012. “Emission and Distribution of NH3 and NOx in China.” China Environmental Science 32 (1): 37–42.
- Li, X., S. Song, W. Zhou, J. Hao, D. Worsnop, and J. Jiang. 2019. “Interactions between Aerosol Organic Components and Liquid Water Content during Haze Episodes in Beijing.” Atmospheric Chemistry and Physics 19 (19): 12163–12174. doi:10.5194/acp-19-12163-2019.
- National Bureau of Statistics. 2001–2018. China Statistical Yearbook. Beijing: China Statistics Press.
- Pan, Y., S. Tian, D. Liu, Y. Fang, X. Zhu, M. Gao, G. Wentworth et al. 2018. “Source Apportionment of Aerosol Ammonium in an Ammonia Rich Atmosphere: An Isotopic Study of Summer Clean and Hazy Days in Urban Beijing.” Journal of Geophysical Research Atmospheres: 2018 123 (10): 5681–5689.
- Posch, M., L. Duan, G. Reinds, and Y. Zhao. 2015. “Critical Loads of Nitrogen and Sulphur to Avert Acidification and Eutrophication in Europe and China.” Landscape Ecology 30 (3): 487–499. doi:10.1007/s10980-014-0123-y.
- Shen, L., X. Yu, and L. Xiang. 2018. “Estimation of Ammonia Emissions Inventories in Jiangsu Province from 2006 to 2014.” China Environmental Science 38 (1): 2634.
- Song, Y. 2014. "Technical Guidelines for Atmospheric Ammonia Sourse Emission Inventory". In Ministry of Environmental Protection, 14. http://www.mee.gov.cn/gkml/hbb/bgg/201408/t20140828_288364.htm.
- Song, Z., X. Sun, Y. Xu, Z. Yang, and N. Hu. 2018. “Spatio-temporal Evolution and Difference Analysis of Chemical Fertilizer Intensity in Jiangsu Province.” Journal of Anhui Agricultural Sciences 18: 5–8.
- Torpo, L., T. Kurtén, H. Vehkamäki, K. Laasonen, M. Sundberg, and M. Kulmala. 2007. “Significance of Ammonia in Growth of Atmospheric Nanoclusters.” The Journal of Physical Chemistry 111 (42): 10671–10674. doi:10.1021/jp0741307.
- Xia, W., W. Zhou, G. Liang, X. Wang, W. Sun, S. Li, C. Hu, and Y. Chen. 2010. “Effect of Optimized Nitrogen Application on Ammonia Volatilization from Paddy Field under Wheat-rice Rotation System.” Plant Nutrition and Fertilizer Science 16: 6–13.
- Xu, J., S. Peng, and S. Yang. 2009. “Nitrogen Wet Deposition and Its Correlation with Ammonia Volatilization Losses from Rice Paddy during Crop Period: A Case Study in Taihu Lake Region.” 2009 International Conference on Energy and Environment Technology, Guilin, China.
- Xu, Z., M. Liu, M. Zhang, Y. Song, S. Wang, L. Zhang, T. Xu et al. 2019. “High Efficiency of Livestock Ammonia Emission Controls in Alleviating Particulate Nitrate during a Severe Winter Haze Episode in Northern China.” Atmospheric Chemistry and Physics 19 (8): 5605–5613.
- Yu, G., Y. Jia, N. He, J. Zhu, Z. Chen, Q. Wang, S. Piao et al. 2019. “Stabilization of Atmospheric Nitrogen Deposition in China over the past Decade.” Nature Geoscience 12 (6): 424–429. doi:10.1038/s41561-019-0352-4.
- Zeng, Y., S. Tian, and Y. Pan. 2018. “Revealing the Sources of Atmospheric Ammonia: A Review.” Current Pollution Reports 4 (3): 189–197. doi:10.1007/s40726-018-0096-6.
- Zhang, L., Y. Chen, Y. Zhao, D. Henze, L. Zhu, Y. Song, F. Paulot et al. 2018. “Agricultural Ammonia Emissions in China: Reconciling Bottom-up and Top-down Estimates.” Atmospheric Chemistry and Physics 18 (1): 339–355. doi:10.5194/acp-18-339-2018.
- Zhang, L., Y. Yang, Y. Li, Z. Qian, W. Xiao, X. Wang, H. Lin, et al. 2019. “Short-term and Long-term Effects of PM2.5 On Acute Nasopharyngitis in 10 Communities of Guangdong, China”. Science of the Total Environment 688: 136–142. doi:10.1016/j.scitotenv.2019.05.470.
- Zheng, G., F. Duan, H. Su, Y. Ma, Y. Cheng, B. Zheng, Q. Zhang et al. 2015. “Exploring the Severe Winter Haze in Beijing: The Impact of Synoptic Weather, Regional Transport and Heterogeneous Reactions.” Atmospheric Chemistry and Physics 15 (6): 2969–2983. doi:10.5194/acp-15-2969-2015.
- Zhou, J., S. Liu, Y. Tan, F. Qian, Y. Liang, and J. Wu. 2016. “Anthropogenic Ammonia Emission Inventory and Its Spatial Distribution in Suzhou City.” Research of Environmental Sciences 29 (8): 1137–1144.