
 ?Mathematical formulae have been encoded as MathML and are displayed in this HTML version using MathJax in order to improve their display. Uncheck the box to turn MathJax off. This feature requires Javascript. Click on a formula to zoom.
ABSTRACT
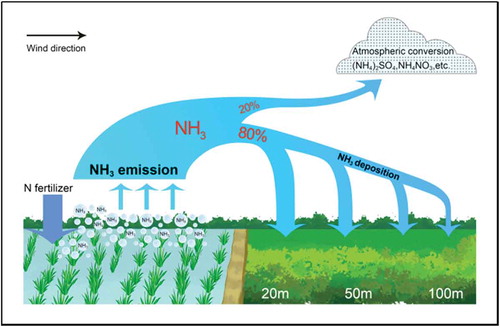
This study measured the ammonia (NH3) concentration and dry deposition within 100 m around paddy fields (0.6 ha) with double rice cropping in the subtropical hilly area in southern China, with the aims to quantify the dry deposition of NH3 around the emission source and to clarify its temporal and spatial variability. The results showed that high NH3 concentrations were found during the 15 d after nitrogen (N) fertilizer application at downwind sites within 100 m around the paddy fields, and the NH3 concentrations were 12–62, 2.8–7.3, 13–38, and 4.9–36 μg N m−3 during the 15 d after basal fertilizer application and topdressing in the early rice season and after basal fertilizer application and topdressing in the late rice season, respectively. The NH3 concentrations were relatively low (1.5–3.8 μg N m−3) during other periods of the rice season at the downwind sites, which indicated that N fertilizer application in paddy fields highly affected the NH3 concentration at downwind sites. The NH3 concentrations at the downwind sites decreased significantly with the increase in distance from the paddy fields. The total NH3 dry deposition around 100 m of the paddy fields accounted for approximately 79% and 81% of the emitted NH3 from the paddy fields in the early and late rice seasons, respectively. The results indicate that dry deposition of NH3 around emission sources may be an important way to remove the NH3 volatilized from croplands in this subtropical hilly area.
Graphical abstract
摘要
农业源在氨 (NH3) 排放清单中占比较大, 但农业排放的NH3是否全部进入大气亟待评估。本文选择亚热带丘陵区双季稻田为研究对象, 研究了农田排放NH3的去向和沉降过程。结果表明, 稻田 (0.6 ha) 下风向 100 m范围较高的NH3浓度主要出现在施用基肥和追肥后15 d内。随着距稻田距离的增加, 下风向大气中NH3浓度呈指数下降。稻田下风向 100 m范围内NH3沉降量约占挥发量的80%, 表明近源沉降是亚热带丘陵区稻田排放NH3的重要汇机制。该机制大幅减少了农业排放NH3进入大气的总量, 应该在清单编制过程中予以考虑, 以期客观评价农业排放对大气污染的潜在影响。
关键词:
1. Introduction
Ammonia (NH3), which mainly comes from NH3 volatilization from nitrogen (N) fertilizer application in farmland and livestock manure (Kang et al. Citation2016), is the most abundant alkaline gas in the atmosphere. NH3 in the atmosphere can react with acidic gases (sulfuric acid, hydrogen chloride, etc.) to form secondary aerosol particles containing ammonium salts, e.g., ammonium sulfate, ammonium bisulfate, ammonium nitrate, and ammonium chloride. These ammonium salts account for 30%–50% of PM2.5 and PM10 (atmospheric particulates with aerodynamic diameters less than 2.5 and 10 microns, respectively) in weight (Aneja, Schlesinger, and Erisman Citation2008; Shen et al. Citation2011). Ammonia and ammonium in the atmosphere can be returned to the surface through wet and dry deposition, which are the main components of atmospheric N deposition, and usually account for more than 50% of the total N deposition (Pan et al. Citation2012; Shen et al. Citation2013; Xu et al. Citation2015). Excessive N deposition will lead to water eutrophication, soil acidification, increased nitrous oxide (N2O) emissions from soil and water, reduced biodiversity, and other adverse ecological effects (Liu et al. Citation2011).
Because NH3 dissolves easily in water, its chemical property is active, and its dry deposition rate is fast (Hertel et al. Citation2012). Ammonia is mainly emitted from the ground or near the vents of animal farms, and thus may have a higher deposition rate around the emission sources. Studies on NH3 deposition around animal farms in Europe, America, and Australia have shown that there were high NH3 deposition rates around the sources of NH3 emissions (Fowler et al. Citation1998; Walker et al. Citation2008; Shen et al. Citation2016). Measures such as planting trees around the sources were proposed to increase the near-source deposition of NH3, and to reduce the long-distance transportation of NH3, so as to reduce its environmental hazards (Bealey et al. Citation2016). In the subtropical region of China, crop and animal production are flourishing, and there is a high intensity of NH3 emissions in the region (Huang et al. Citation2012; Kuang et al. Citation2016). The subtropical hilly region of China is located in the southeastern part of the country, mainly distributed in Hunan, Hubei, Jiangxi, Zhejiang, Fujian, Guangdong, and Guangxi provinces. The region has many mountains and hills, and relatively little arable land. Paddy and vegetable fields are mainly distributed in the valleys, tea plantations and orchards are distributed in the mountains and hills, and animal farms are often built near the mountains and hills. This pattern of distribution of croplands or animal farms accompanying the surrounding natural ecosystems may result in a higher near-source deposition ratio of NH3 in the subtropical hilly region than that in the plain areas. Recent observations also showed that the concentration of NH3 in the subtropical hilly areas of China was not very high (Liu et al. Citation2019), which indirectly indicates that there may be a high near-source deposition of NH3 in the subtropical hilly areas, but there is no direct experimental evidence.
In this study, the NH3 concentration and its dry deposition in the neighborhood of a typical paddy area in the subtropical hilly region of China were studied. The aim was to quantify the NH3 deposition around typical paddy fields in the subtropical hilly areas, and clarify its temporal and spatial variability. Our study will help to clarify the fate of the NH3 emitted from paddy fields, to evaluate the environmental effects of NH3 more reasonably, and to provide a scientific basis for the implementation of agricultural NH3 emissions reduction.
2. Materials and methods
2.1 Study site
In this study, a paddy area with double rice cropping (28°32′55″N, 113°19′50″E; 94 m above sea level) was selected in the hilly area of central Hunan Province (Jinjing Town, Changsha). The area has a subtropical monsoon climate, with an average annual temperature of 17.5°C and an average annual rainfall of 1330 mm. The rainfall mainly occurs during March to August of each year, accounting for more than 60% of the annual rainfall (Figure S1). The frost-free period is about 300 days, and northwest–southeast winds prevail perennially. The rice growing area was 200 m in length from north to south, and 30 m in length from east to west. In the paddy area, double rice was planted during April 2018 to October 2018. The average N, phosphorus pentoxide, and potassium oxide application rates were 95, 60, and 79 kg ha−1, respectively, in the early rice season, and 119, 60, and 79 kg ha−1 in the late rice season. Among them, phosphorus and potassium fertilizers were used as basal fertilizer on one occasion, N fertilizer was applied twice using urea, and the ratio of basal application to topdressing was 3:1. The application date of basal fertilizer in the early rice season was 28 April, and that of topdressing was 14 May. The application date of basal fertilizer in the late rice season was 29 July, and that of topdressing was 13 August. There are masson pine forests on the eastern and western sides of the paddy area, shrubs to the south, and organic vegetable fields to the north. For the organic vegetable fields, fertilizer was only applied in spring and autumn, but not during the growth period of rice. There was no livestock and industrial pollution in the 1-km area around the rice area.
Previous studies on NH3 deposition around emission sources (Fowler et al. Citation1998; Walker et al. Citation2008; Shen et al. Citation2016) have shown that the higher is the NH3 emissions intensity, the further the distance NH3 is deposited from the sources. Given that the studied paddy area had a moderate NH3 emissions intensity, the NH3 deposition measurement was conducted within 100 m from the paddy fields. The NH3 sampling points were arranged in the upwind direction and the downwind direction. The upwind direction points were set at 50 m from the paddy area along the upwind transect of the paddy area, while the downwind direction points were set at 0 m, 20 m, 50 m, and 100 m from the rice area, respectively, along the downwind transect (Figure S2). The locations of upwind and downwind sampling points varied with the change in the main wind direction. Owing to north and south winds being the prevailing winds during the sampling periods, the downwind sites were thus located in the south or north of the paddy fields, while the upwind sites were located in the north or south accordingly.
2.2. Measurement of NH3 concentration
The sampling period of this study was from April to October 2018, when early and late rice were planted. Atmospheric NH3 samples at sampling points were collected by a denuder system for long-term NH3 sampling (DELTA system) (Shen et al. Citation2013, Citation2016). The system had a low-flow sampling pump (0.2–0.4 L min−1) to collect air. When air passed through a denuder filter train, NH3 was absorbed by 5% citric acid methanol reagent impregnated on the wall of the two denuders connected in series, and the sampling volume was recorded by a gas meter. The sampling frequency was one sample per day by sampling continuously for 24 h (one sample every two days after topdressing in the early rice season) during the seven days after application of basal N fertilizer and topdressing, and then was one sample every two to three days (48–72 h continuously) in other periods at each sampling site. Samples were stored in a refrigerator at 4°C for chemical analysis within a week. The absorbed NH3 on the denuders was extracted with high purity water for half an hour. During sample analysis, ammonium-N in the extraction solution was determined by a continuous flow analyzer (AA3, Seal Analytical Inc., Germany). The NH3 concentration was calculated according to the NH3-N adsorbed by the diffusion tube and the sampling volume.
Meteorological parameters at the study site were measured by a weather station (Intelimet Advantage, Dynamax Inc., USA) about 500 m from the paddy area. The measured parameters included air temperature, wind speed, wind direction, air pressure, relative humidity, solar radiation, and rainfall.
2.3. Calculation of NH3 dry deposition
The inferential method was used to calculate the dry deposition of NH3; that is, the dry deposition of NH3 was the product of its concentration and its dry deposition velocity. Based on the big-leaf resistance model (Wesely and Hicks Citation1977), the dry deposition velocity (Vd) is the reciprocal of the sum of three different resistances, and its formula is as follows:
where Ra is the aerodynamic resistance, Rb is the laminar boundary layer resistance, and Rc is the canopy resistance. The parameterization methods of Ra, Rb, and Rc can be referred to in Erisman and Draaijers (Citation1995) and Wesely (Citation1989), and the details for the parameterization can be found in Kuang et al. (Citation2016).
3. Results
3.1. NH3 concentrations in the downwind direction from the paddy fields in the early and late rice seasons
The NH3 concentration in the downwind direction from the paddy fields had clear spatial and temporal variations. As shown in , in the early rice season, there were high NH3 concentrations at 0, 20, 50, and 100 m in the downwind direction after basal N fertilizer application. With increasing distance from the paddy fields, the concentration of NH3 decreased. The highest NH3 concentration at 0 m was 163 μg N m−3, while the highest concentration at 100 m was 40 μg N m−3. High concentrations of NH3 occurred mainly within five days after application of basal fertilizer, and then the NH3 concentration decreased significantly. However, the NH3 concentrations in the downwind direction within 100 m from the paddy fields were still higher than those at the background point (Figure S3) during the 15 days after fertilizer application. The concentration of NH3 only increased slightly in the downwind direction after topdressing of N fertilizer, and decreased with increasing distance from the paddy field. After 15 days of N fertilizer topdressing, the NH3 concentrations at downwind sites were always at a low level (< 5 μg N m−3).
Figure 1. Daily NH3 concentrations at downwind sites in the early rice season.
The NH3 concentrations were also higher in the downwind area of the paddy fields after N fertilizer application in the late rice season (). The highest concentration of NH3 at 0 m reached 200 μg N m−3, while the highest concentration of NH3 at 100 m was 49 μg N m−3. The concentration of NH3 also declined with distance from the paddy fields. However, different from the early rice season, the concentrations of NH3 in the downwind direction increased significantly after topdressing N fertilizer in the late rice season. In the 15 days after topdressing, the highest concentration at 0 m was 133 μg N m−3, and the highest at 50 m was 70 μg N m−3. Thereafter, the downwind NH3 concentrations were also at a low level (< 5 μg N m−3).
Figure 2. Daily NH3 concentrations at downwind sites in the late rice season.
3.2. Downwind NH3 mean concentrations during fertilization and non-fertilization periods in early and late rice seasons
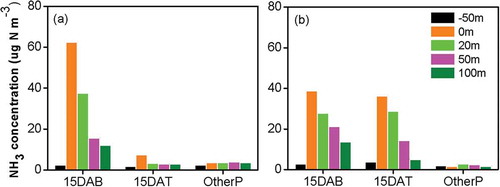
Previous work on NH3 volatilization from paddy fields has shown that NH3 volatilization mainly occurs in the 15 days after N fertilizer application (Wu et al. Citation2019). Thus, the mean concentrations of NH3 in the early and late rice seasons at the downwind sites of the paddy fields were calculated for the 15 days after basal fertilizer application, 15 days after topdressing, and other periods (). In the early rice season, the mean concentrations of NH3 within 15 days after basal fertilizer application and 15 days after topdressing were 12–62 and 2.8–7.3 μg N m−3, respectively. The mean concentrations of NH3 in the downwind direction were 5.2–27 and 1.6–4.1 times higher, respectively, than that those at 50 m in the upwind direction in the corresponding period. In the late rice season, the mean concentrations of NH3 at the downwind sites within 15 days after basal fertilizer application and 15 days after topdressing were 13–39 and 4.9–36 μg N m−3, respectively, and decreased exponentially (P < 0.05) with increasing distance from the paddy fields. The concentrations of NH3 at downwind sites were 5.0–14 and 1.3–49.7 times higher, respectively, than those at the background point during the same sampling period. In the other periods, the mean concentrations of NH3 at the downwind sites were 2.4–3.9 and 1.5–2.7 μg N m−3 in the early and late rice season, respectively. The trend of variation in NH3 concentration with distance was not significant, and the difference between the downwind and upwind direction was small.
Figure 3. Mean concentrations of NH3 during the 15 days after basal fertilizer application (DAB), 15 days after topdressing (DAT) and the non-fertilization period (OtherP) at the downwind and upwind sites of the paddy fields in the (a) early and (b) late rice seasons.
3.3. Dry deposition of NH3 in the neighborhood of paddy fields during fertilization and non-fertilization periods in early and late rice seasons
As shown in , the background NH3 deposition and the NH3 deposition caused by NH3 volatilization in paddy fields in the downwind area were calculated separately. In the early rice season, the proportions of south and north winds in all wind directions were 0.42 and 0.45, respectively, during the 15 days after basal fertilizer application (wind speed was usually less than 0.2 m s−1 during the other 13% of the period, which belonged to the calm wind state, and thus NH3 dry deposition could be neglected), and the calculated total NH3 deposition in the area of 100 m in the downwind direction was 2.3 kg. During the 15 days after topdressing and the other periods, the total NH3 deposition in the 100-m downwind area was 0.36 kg and 0.93 kg, respectively. The total amount of NH3 deposition in the area of 100 m in the downwind direction in the early rice season was 3.6 kg. Of all the NH3 deposition, the deposition caused by the background NH3 concentration was 0.90 kg, accounting for 25% of the total deposition.
Table 1. Ammonia dry deposition during the fertilization period (15 days after N application) and the non-fertilization period in the downwind area 100 m from the paddy fields in the early and late rice seasons.
In the late rice season, the total NH3 deposition in the 100-m downwind area was 2.0 kg, 1.8 kg, and 0.98 kg, respectively, during the 15 days after basal fertilizer application, the 15 days after topdressing, and the other periods. The total amount of NH3 deposition in the area of 100 m in the downwind direction in the late rice season was 4.8 kg. The total deposition caused by the background NH3 concentration was 1.3 kg, accounting for 27% of the total deposition.
4. Discussion
Our results show that there are high NH3 concentrations in the downwind area of paddy fields in the subtropical region of China. In this study, the NH3 concentrations at the downwind sites were mainly higher than those at the background site during the 15 days after N fertilizer application, and were stable and low during other periods in the rice season. This indicates that NH3 volatilization after N fertilization application is an important reason for high concentrations in downwind areas. The N fertilizer used in paddy fields of China is usually urea. In the process of urea hydrolysis, the pH of ponding water in the paddy fields will increase, which promotes a rapid increase in the ammonium ion content of the water, resulting in a large amount of NH3 volatilization (Wu et al. Citation2019). In addition, meteorological factors also play an important role in affecting NH3 concentrations at downwind sites. Ammonia volatilization increases with increasing temperature (Shen et al. Citation2011). The larger are the fluxes of NH3 volatilization, the higher are the concentrations of NH3 in the atmosphere (Wang et al. Citation2017). Temperatures in summer are higher than in spring in this study area, which may also be one of the reasons why there were two peaks of NH3 concentrations in the late rice season, i.e. with relatively high temperatures during the basal fertilization and topdressing periods, while there was only one peak after basal fertilizer application in the early rice season, i.e. with relatively low temperatures during the basal and topdressing fertilization periods. The concentrations of NH3 in the downwind area did not increase significantly after topdressing in the early rice season, which may be because there was abundant rainfall during this period, and the rainfall would have had a dilution effect on the concentration of ammonium-N in the ponding water, thus reducing NH3 volatilization.
Owing to the relatively low NH3 emissions intensity of the studied paddy fields, this study only carried out NH3 deposition monitoring in the downwind area within 100 m from the paddy fields. The results showed that the average concentration of NH3 at 100 m in the downwind area was still high within 15 days after applying basal fertilizer, which was 5.0–5.2 times that at the background site, but it had dropped by 65%–81% compared with that at 0 m. Within 15 days after topdressing, because the amount of topdressing N fertilizer was only one third that of the basal N fertilizer, the volatilization of NH3 might have been greatly reduced. Affected by the weakening of source strength, the concentration of NH3 at 100 m dropped to 1.3–1.6 times that of the NH3 concentration at the background site, and by 61%–86% compared with that at 0 m. Previous studies have also shown that the distance impacted by NH3 emission sources is closely related to the source strength. For example, Shen et al. (Citation2018) observed relatively high NH3 concentrations even at 1000 m from an intensive cattle farm with 15 000 beef cattle, which had an NH3 emissions intensity of 1.8 t NH3-N d−1. Fowler et al. (Citation1998) found that the NH3 concentration was still high at the farthest observation point of 276 m from a chicken farm with 120 000 chickens, which had an NH3 emissions intensity of about 13 kg NH3-N d−1. The N loss from NH3 volatilization usually accounts for approximately 10% of the applied N fertilizer (Zhu Citation2008). Based on this estimation, the average NH3 emissions intensity from the studied paddy fields was about 0.20–0.75 kg NH3-N d−1 during the periods of 15 days after N fertilizer application. This NH3 emissions intensity was relatively low, and thus the downwind area within 100 m from the paddy fields could be the main area affected by NH3 volatilization.
In this study, the total amounts of N fertilizer used in the early and late rice seasons were 34.2 kg and 42.8 kg, respectively, in the study paddy fields. Based on a 10% NH3 volatilization loss, the total amounts of NH3 volatilization in the early and late rice seasons were calculated to be 3.4 and 4.3 kg, respectively. The total NH3 depositions caused by NH3 volatilization in the paddy fields (total NH3 deposition in the downwind direction minus that in the background area) in the area of 100 m in the downwind direction in the early and late rice seasons were 2.7 and 3.5 kg, respectively. As a result, the proportions of near-source NH3 deposition in the area around the paddy fields (downwind area within 100 m) to NH3 volatilization in the early and late rice seasons were 79% and 81%, respectively. These ratios of NH3 deposition around the source to the NH3 emissions from the sources were much higher than the measured ratios of 8.3% for the NH3 deposition within 1 km from a cattle feedlot (Shen et al. Citation2016), and 10.4% for the NH3 deposition within 500 m from a swine farm (Walker et al. Citation2008). This indicates that the higher the NH3 emissions intensity, the smaller the proportion of NH3 deposition around the sources, and thus the larger the impacted area due to NH3 emissions.
Farmlands in this subtropical hilly area are mostly distributed near the hills, and the uniform cropland area is relatively small (ranging from less than 0.1 ha to 20 ha). Thus, the NH3 emissions intensity for the farmland source in this region is relatively small, which leads to a higher ratio of near-source NH3 deposition to NH3 emissions, and a lower ratio of long-range-transported NH3 to NH3 emissions. This may also be one of the reasons for the relatively low atmospheric NH3 concentration in subtropical hilly areas (Liu et al. Citation2019). In this study, the paddy area was relatively small, which resulted in a small source strength. It is still necessary to study the near-source deposition characteristics of NH3 in paddy fields with different emission intensities.
In view of the fact that the atmospheric N deposition of other active N species (e.g., ammonium-N and nitrate-N in rainfall and in aerosol, nitric acid gas) in the study region was also higher (Wang et al. Citation2017; OuYang et al. Citation2019), the NH3 deposition combined with other reactive N deposition around the sources will result in N enrichment around the emission sources. The resulting ecological and environmental effects thus can not be ignored. For the farmland around the sources, atmospheric N deposition is an important source of N (Wang et al. Citation2017), and thus needs to be considered in N nutrient management. For natural ecosystems such as woodlands and shrubs, large amounts of N deposition will bring many negative impacts on the environment, such as soil acidification, biodiversity reduction, weeds growing around farmland, and increasing soil N2O emissions (Liu et al. Citation2011). Therefore, it is necessary to take measures to optimize the application of N fertilizer in farmlands, so as to reduce NH3 emissions, and to alleviate the adverse environmental effects caused by NH3 deposition.
5. Conclusions
This study measured the NH3 concentrations at downwind sites within 100 m from a typical paddy region (about 0.6 ha) in the subtropical hilly region in southern China, and the NH3 deposition in this downwind area was also estimated. There were high NH3 concentrations at the downwind sites during the periods within 15 days after N fertilizer application. The concentrations of NH3 at 0 m, 20 m, 50 m, and 100 m from the paddy fields in the downwind area were as much as 5.0–27 and 1.3–9.7 times those at the background site after applying basal fertilizer and topdressing fertilizer, respectively, and decreased exponentially with distance from the paddy fields. Excluding background NH3 deposition, the total NH3 deposition in the 100-m downwind direction in the early and late rice seasons accounted for 79% and 81% of the NH3 emissions from the paddy fields, respectively. The results show that dry deposition of NH3 around emission sources may be an important way to remove the NH3 volatilized from croplands in this subtropical hilly area.
Supplemental Material
Download PDF (197.9 KB)Disclosure statement
No potential conflict of interest was reported by the authors.
Supplementary material
Supplemental data of this article can be accessed here.
Additional information
Funding
References
- Aneja, V. P., W. H. Schlesinger, and J. W. Erisman. 2008. “Farming Pollution.” Nature Geoscience 1 (7): 409–411. doi:10.1038/ngeo236.
- Bealey, W. J., A. J. Dore, U. Dragosits, S. Reis, D. S. Reay, and M. A. Sutton. 2016. “The Potential for Tree Planting Strategies to Reduce Local and Regional Ecosystem Impacts of Agricultural Ammonia Emissions.” Journal of Environmental Management 165: 106–116. doi:10.1016/j.jenvman.2015.09.012.
- Erisman, J. W., and G. P. J. Draaijers. 1995. Atmospheric Deposition in Relation to Acidification and Eutrophication. Amsterdam: Elsevier 1–404.
- Fowler, D., C. E. R. Pitcairn, M. A. Sutton, C. Flechard, B. Loubet, M. Coyle, and R. C. Munro. 1998. “The Mass Budget of Atmospheric Ammonia in Woodland within 1 Km of Livestock Buildings.” Environment Pollution 102 (S1): 343–348. doi:10.1016/S0269-7491(98)80053-5.
- Hertel, O., C. A. Skjøth, S. Reis, A. Bleeker, R. M. Harrison, J. N. Cape, D. Fowler et al. 2012. “Governing Processes for Reactive Nitrogen Compounds in the European Atmosphere.” Biogeosciences 9 (12): 4921–4954. DOI:10.5194/bg-9-4921-2012.
- Huang, X., Y. Song, M. M. Li, J. F. Li, Q. Huo, X. H. Cai, T. Zhu et al. 2012. “A High-resolution Ammonia Emission Inventory in China.” Global Biogeochemical Cycles 26 (1): GB1030. DOI:10.1029/2011GB004161.
- Kang, Y. N., M. X. Liu, Y. Song, X. Huang, H. Yao, X. H. Cai, H. S. Zhang et al. 2016. “High-resolution Ammonia Emissions Inventories in China from 1980 to 2012.” Atmospheric Chemistry and Physics 16 (4): 2043–2058. DOI:10.5194/acp-16-2043-2016.
- Kuang, F. H., X. J. Liu, B. Zhu, J. L. Shen., Y. P. Pan, M. M. Su, and K. Goulding. 2016. “Wet and Dry Nitrogen Deposition in the Central Sichuan Basin of China.” Atmospheric Environment 143: 39–50. doi:10.1016/j.atmosenv.2016.08.032.
- Liu, L., X. Y. Zhang, A. Y. H. Wong, W. Xu, X. J. Liu, Y. Li, H. Mi, et al. 2019. “Estimating Global Surface Ammonia Concentrations Inferred from Satellite Retrievals”. Atmospheric Chemistry and Physics 19: 12051–12066. doi:10.5194/acp-19-12051-2019.
- Liu, X. J., L. Duan, J. M. Mo, E. Du, J. L. Shen, X. K. Lu, Y. Zhang et al. 2011. “Nitrogen Deposition and Its Ecological Impact in China: An Overview.” Environmental Pollution 159 (10): 2251–2264. DOI:10.1016/j.envpol.2010.08.002.
- OuYang, X. Q., B. Wang, J. L. Shen, X. Zhu, J. F. Wang, Y. Li, and J. S. Wu. 2019. “Atmospheric Nitrogen Dioxide, Nitric Acid and Nitrate Nitrogen Concentrations, and Wet and Dry Deposition Rates in a Double Rice Region in Subtropical China.” Environmental Science 40 (6): 2607–2614.
- Pan, Y. P., Y. S. Wang, G. Q. Tang, and D. Wu. 2012. “Wet and Dry Deposition of Atmospheric Nitrogen at Ten Sites in Northern China.” Atmospheric Chemistry and Physics 12 (14): 6515–6535. doi:10.5194/acp-12-6515-2012.
- Shen, J. L., D. L. Chen, M. Bai, J. L. Sun, T. Coates, S. K. Lam, and Y. Li. 2016. “Ammonia Deposition in the Neighbourhood of an Intensive Cattle Feedlot in Victoria, Australia.” Scientific Reports 6: 32793. doi:10.1038/srep32793.
- Shen, J. L., D. L. Chen, M. Bai, J. L. Sun, S. K. Lam, A. Mosier, X. L. Liu, and Y. Li. 2018. “Spatial Variations in Soil and Plant Nitrogen Levels Caused by Ammonia Deposition near a Cattle Feedlot.” Atmospheric Environment 176: 120–127. doi:10.1016/j.atmosenv.2017.12.022.
- Shen, J. L., Y. Li, X. J. Liu, X. S. Luo, H. Tang, Y. Z. Zhang, and J. S. Wu. 2013. “Atmospheric Dry and Wet Nitrogen Deposition on Three Contrasting Land Use Types of an Agricultural Catchment in Subtropical Central China.” Atmospheric Environment 67: 415–424. doi:10.1016/j.atmosenv.2012.10.068.
- Shen, J. L., X. J. Liu, Y. Zhang, A. Fangmeier, K. Goulding, and F. Zhang. 2011. “Atmospheric Ammonia and Particulate Ammonium from Agricultural Sources in the North China Plain.” Atmospheric Environment 45 (28): 5033–5041. doi:10.1016/j.atmosenv.2011.02.031.
- Walker, J. T., P. Spence, S. Kimbrough, and W. Robarge. 2008. “Inferential Model Estimates of Ammonia Dry Deposition in the Vicinity of a Swine Production Facility.” Atmospheric Environment 42: 3407–3418. doi:10.1016/j.atmosenv.2007.06.004.
- Wang, J. F., X. Zhu, J. L. Shen, G. J. Zeng, J. Wang, J. S. Wu, and Y. Li. 2017. “Atmospheric Ammonia/ammonium-nitrogen Concentration and Dry Deposition in a Double Rice Region in Subtropical China.” Environmental Science 38 (6): 2264–2272.
- Wesely, M. L. 1989. “Parameterization of Surface Resistances to Gaseous Dry Deposition in Regional-scale Numerical Models.” Atmospheric Environment 23 (6): 1293–1304. doi:10.1016/0004-6981(89)90153-4.
- Wesely, M. L., and B. B. Hicks. 1977. “Some Factors that Affect the Deposition Rates of Sulfur Dioxide and Similar Gases on Vegetation.” Journal of the Air Pollution Control Association 27 (11): 1110–1116. doi:10.1080/00022470.1977.10470534.
- Wu, F., K. Q. Zhang, K. Xie, F. Wang, R. Q. Wang, G. F. Yin, and S. Z. Shen. 2019. “Characteristics of Ammonia Volatilization from Rice Paddy Fields under Different Fertilization Treatments in Typical Agricultural Areas of Erhai Basin.” Journal of Agro-Environment Science 38 (8): 1735–1742.
- Xu, W., X. S. Luo, Y. P. Pan, L. Zhang, A. H. Tang, J. L. Shen, Y. Zhang et al. 2015. “Quantifying Atmospheric Nitrogen Deposition through a Nationwide Monitoring Network across China.” Atmospheric Chemistry and Physics 15 (21): 12345–12360. DOI:10.5194/acp-15-12345-2015.
- Zhu, Z. L. 2008. “Research on Soil Nitrogen in China.” Acta Pedologica Sinica 45 (5): 778–783.