
ABSTRACT
China has experienced severe haze and visibility degradation problems in recent years because of rapid urbanization and industrialization. In this study, daily atmospheric fine-aerosol samples were concurrently collected at three sites over the Pearl River Delta (PRD) region during 1–29 October 2014. PM2.5 samples were analyzed for organic carbon and elemental carbon using a thermal/optical carbon analyzer. Major water-soluble inorganic ions including F−, Cl−, NO3−, SO42−, Na+, NH4+, K+, Mg2+, and Ca2+ were analyzed by ion chromatography. The results show that the temporal variations of PM2.5 concentration at the three sites were highly parallel, with particle pollution events simultaneously observed during 13–19 October (EP1) and 23–27 October (EP2), suggesting that pollution events in the PRD region are usually regional. This can most likely be attributed to the significant influences of synoptic conditions, which regionally facilitate or block diffusion of air pollutants. The chemical compositions of PM2.5 at the three sites were also found to be similar, dominated by organics and sulfates. The results indicate that accumulation of traffic emissions seems to play important roles in particle pollution for the PRD region, leading in this case to elevated nitrate contributions during both EP1 and EP2 at the three sites. Moreover, the authors found that locally emitted aerosols from biomass burning only markedly influenced the air condition at one site, Nanhai, during EP1, while regionally transported biomass burning aerosols from eastern and northern Guangdong Province influenced all three sampling sites when the PRD was dominated by polluted air from these directions during EP2.
Graphical abstract
摘要
为研究珠三角地区大气霾污染特征和形成机制, 于2014年秋季在区域内三个典型观测站同步开展了细颗粒物外场观测。结果表明, 三个站点大气细颗粒物及其化学组分质量浓度的时间变化趋势高度一致, 呈现出区域性特征。结合气象因素分析, 发现珠三角区域霾污染的形成受到中尺度的静态天气形势的影响。随着霾污染过程的发展, 细颗粒物中硝酸盐的比例显著增加, 移动源的贡献较大。结合后向气流轨迹和卫星火点分布, 证实区域内的生物质燃烧会加剧大气霾污染的强度。为进一步改善珠三角的空气质量, 建议在区域尺度上实施联防联控的减排方案。
1. Introduction
In the last few decades, atmospheric aerosol pollution has become one of the most important environmental issues faced by governments, scientists, and the public (Sun et al. Citation2014; Li et al. Citation2017a). Atmospheric aerosols can disturb the atmospheric radiation budget through direct absorbing/scattering of sunlight and indirect cloud formation (IPCC Citation2013), and can deposit in the human body through inhalation causing respiratory or even cardiovascular diseases (Pope and Dockery Citation2006). Furthermore, the radiation forcing properties and toxicity of particles are highly dependent on their chemical compositions, which vary with time and location. Thus, continual field observations of ambient aerosols at different sites are of great importance.
The Pearl River Delta (PRD) region is one of the fastest developing regions in China. Its rapid urbanization and industrialization and concurrent population increase are leading to enhanced anthropogenic emissions. Photochemical smog and particle pollution are frequent in this region (Liu et al. Citation2014; Zou et al. Citation2015; Zhou et al. Citation2018). Studies have reported that primary or anthropogenic emissions from industry, biomass burning, traffic, and coal combustion act as significant contributors to local particle emissions (Pan et al. Citation2016a; Fu and Chen Citation2017). In particular, traffic emissions, a symptom of the urbanization of the PRD, have been identified as one of the largest primary sources and are causing high concentrations of nitrates and hydrocarbon-like organic aerosols in the region. Furthermore, the accumulation of traffic emissions has frequently been reported as a primary cause of pollution events in urban areas of the PRD (Qin et al. Citation2017). In contrast, biomass burning, which is extremely rare at most times of the year, nonetheless plays more important roles in particle concentrations and pollution events in the PRD in harvest season (Zhang et al. Citation2010; Tao et al. Citation2014; Wang et al. Citation2016; Liu et al. Citation2018; Zhou et al. Citation2018). Influenced by multiple atmospheric conditions such as relative humidity and temperature, secondary processes, mainly generating sulfates, nitrates, and secondary organic aerosols, also substantially contribute to ambient aerosol concentrations (Hua et al. Citation2015; Li et al. Citation2018). However, because of the complicated precursors, diverse reaction pathways, and high dependence on atmospheric conditions such as relative humidity and temperature, detailed knowledge about secondary aerosol formation is still not adequate (Ding et al. Citation2012; Li et al. Citation2017c). Moreover, numerous studies have indicated that regional transport of air pollutants plays important roles in the formation of severe haze pollution over the North China Plain (Sun et al. Citation2014; Li et al. Citation2017b), Yangtze River Delta region (Tang et al. Citation2016; Ding et al. Citation2017), and Hong Kong/PRD region (Zhou et al. Citation2014).
Despite many studies having been conducted in the PRD region to characterize local particle pollution and further establish environmental policies, existing knowledge of the detailed sources, atmospheric processes, and chemical mechanisms of ambient aerosols is still far from enough (Huang et al. Citation2018; Zhou et al. Citation2018). Measurements have usually focused on pollution characteristics at a single site, failing to gain an overall insight into the regional air condition in the PRD region. Recently, the central government established the Guangdong–Hong Kong–Macao Greater Bay Area, which is expected to raise the profile of air quality issues in the region not only among the public but also government administrators and scientists. To improve our understanding of the features of regional atmospheric aerosol pollution in the PRD region and prepare for the further urbanization of the Guangdong–Hong Kong–Macao Greater Bay Area, we therefore discuss the chemical compositions, sources, and regional transport of atmospheric aerosols over the PRD region.
2. Methods
2.1. Sampling campaign
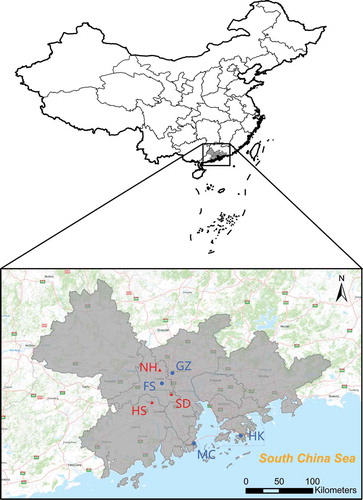
To capture a holistic picture of regional haze over the PRD region, three sites—Nanhai (NH), Shunde (SD), and Heshan (HS)—were selected along the western side of the Pearl River Estuary (). NH station is located 20 km west of downtown Guangzhou and 20 km north of the city center of Foshan (23°18ʹN, 113°10ʹE), which is a suburban site with farmland around it. SD station is located at the Shunde District Meteorological Bureau (22°51ʹN, 113°15ʹE), approximately 30 km south of downtown Guangzhou. SD is a district of Foshan City, home to numerous factories. HS station is located at the Heshan Meteorological Monitoring site (22°45ʹN, 112°59ʹE), approximately 50 km from the urban center of Guangzhou City.
Figure 1. Locations of the sampling sites. NH, HS, and SD represent Nanhai district, Heshan, and Shunde, respectively. GZ and FS represent the cities of Guangzhou and Foshan, respectively. MC and HK stand for Macau and Hong Kong, respectively.
The measurements were conducted during 1–29 October 2014. Daily PM2.5 samples were concurrently collected at the NH, SD, and HS sites near Foshan City. Teflon-membrane filters were used for determining the PM2.5 and trace element mass concentrations. Quartz fiber filters were used for measuring organic carbon (OC), elemental carbon (EC), and water-soluble inorganic ions.
2.2. Chemical analysis
Water-soluble inorganic ions, including F−, Cl−, NO3−, SO42−, Na+, NH4+, K+, Mg2+, and Ca2+, in PM2.5, were detected using an ion chromatograph (Dionex ICS-90, Sunnyvale, US). A thermal-optical carbon aerosol analyzer (DRI Model 2001, Atmoslytic Inc., CA, USA) based on the thermal-optical transmittance method was used to determine the abundance of OC and EC (Cheng et al. Citation2009). The IMPROVE temperature protocol was applied in this study (Chow et al. Citation2005).
The Teflon-membrane filters were analyzed by high-sensitivity X-ray fluorescence for Na, Mg, Al, Cl, K, Ca, Ti, V, Cr, Mn, Fe, Ni, Cu, Zn, Rb, Sb, Ba, and Pb (Cao et al. Citation2008).
Two typical anhydrosugars, levoglucosan (LG) and mannosan (MN), were measured by high-performance anion exchange chromatography with pulsed amperometric detection. Full details can be found in Zhang et al. (Citation2010), and a brief description of this method is provided in the supplementary information.
3. Results and discussion
3.1. General characteristics of PM2.5
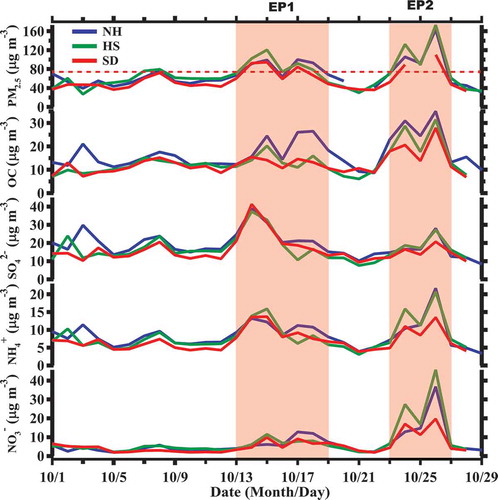
presents the PM2.5 concentration and its main chemical components during 1–29 October at the three sites. The monthly averaged PM2.5 concentrations were 66.8, 59.6, and 69.3 μg m−3 at NH, SD, and HS, respectively. On one third of the sampling days, the PM2.5 concentration was higher than the National Ambient Air Quality Standard (24-h average of 75 μg m−3). As can be seen, the downwind HS site had the highest PM2.5 concentration during the observation period. Another PM2.5 pollution characteristic was that the concentrations at the three sites generally tracked each other, indicating that PM2.5 pollution over the PRD is a regional phenomenon. The concentrations of major PM2.5 components, including OC, SO42−, NH4+, and NO3−, also presented similar temporal variations at the three sites during the observation period. Two atmospheric aerosol pollution (or haze) episodes, designated EP1 and EP2, were observed, both of which occurred simultaneously at the three sites. Normal days were defined as the days other than EP1 and EP2. EP1 occurred from 13 to 19 October, with PM2.5 concentration ranges of 63.8–100.1 μg m−3, 51.0–120.4 μg m−3, and 63.8–100.1 μg m−3 at NH, HS, and SD, respectively. EP2 started on 23 October and ended on 27 October. The concentration ranges of PM2.5 were 49.5–163.6 μg m−3, 60.8–173.1 μg m−3, and 47.5–110.4 μg m−3 at the three sites, respectively. The highest PM2.5 concentrations during the entire study were recorded on 26 October, with daily averaged values of 173.1, 163.6, and 110.4 μg m−3 at HS, NH, and SD, respectively.
Figure 2. Time series of PM2.5 and its major components (OC, SO42−, NH4+, NO3−) at the three sites (NH, HS, and SD) over the PRD region from 1 to 29 October 2014. The red dashed line stands for China’s daily ambient air quality standard of 75 μg m−3.
3.2. Chemical compositions of PM2.5
Table S1 shows the average values and standard deviations of the major components in PM2.5. Water-soluble inorganic ions, OC, and EC contributed more than 70% to the total PM2.5 at all three sites. The dominant water-soluble inorganic ions were SO42−, NH4+, and NO3−. The monthly averaged OC and EC concentrations were 16.9 ± 6.7 and 2.8 ± 1.2 μg m−3, 13.2 ± 5.9 and 2.1 ± 0.9 μg m−3, and 12.4 ± 4.3 and 1.7 ± 0.7 μg m−3 at NH, HS, and SD, respectively. The concentrations of LG, a biomass burning tracer, were 339.0 ± 183.9, 202.2 ± 125.6, and 178.6 ± 103.5 μg m−3, respectively, and we found that the LG concentration was the highest at the NH site. The total concentrations of trace elements were 2.4 ± 0.2, 2.4 ± 0.3, and 1.7 ± 0.2 μg m−3, accounting for about 3.5%, 3.5%, and 3.0% of the total PM2.5 at the three sites, respectively.
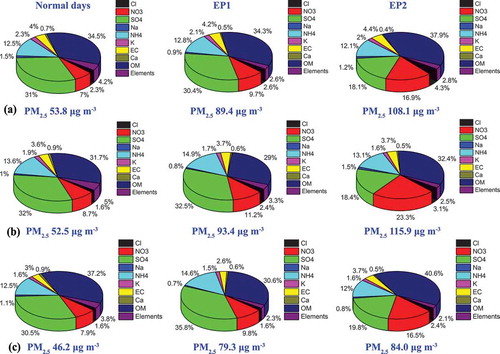
shows the relative contributions of the major chemical components in PM2.5 during normal days, EP1, and EP2. Sulfate was the main chemical component of PM2.5 at the HS and SD sites, which accounted for 32.5% and 35.8% of the total PM2.5 during EP1. For the NH site, organic matter (OM = 1.4 × OC) contributed the largest part of PM2.5 during EP1, the reason for which is discussed in the following section. OM was the major PM2.5 component during EP2 at the three sites. Nitrate concentrations were markedly higher during pollution episodes than on normal days at all three sites, increasing by as much as 4–5 times during EP2. The results indicate that nitrate is a significant driver of atmospheric aerosol pollution over the PRD region in autumn. Other studies have also suggested that nitrate comprises an increasing part of fine particles and plays an important role in haze pollution over the North China Plain due to the reducing SO2 emissions and increasing NOx emissions (Pan et al. Citation2016b; Wang et al. Citation2019). Transformations of atmospheric secondary organic carbon (SOC) have been reported in numerous studies in the PRD region as a signifiant contributor to the PM2.5 concentration. In this study, the SOC concentrations and SOC/OC ratios were measured in the above three periods and sites, as shown in Figure S1. For each classified period, neither the SOC concentration nor the SOC/OC ratio showed any remarkable differences among the three sites. Furthermore, a consistent trend at all three sites was observed in that the SOC concentration during the three periods ranked in the order of EP2 > EP1 > normal days. These results indicate high spatial homogeneity of air pollutants across the PRD region, suggesting the existence of a mesoscale weather system.
Figure 3. Chemical components in PM2.5 at (a) NH, (b) HS, and (c) SD, on normal days, in episode 1 (EP1, 13–19 October), and in episode 2 (EP2, 23–27 October).
3.3 Formation mechanism of regional atmospheric aerosol pollution
3.3.1 Meteorological effects
Synoptic weather conditions and atmospheric circulation have crucial effects on the regional aerosol concentrations. Figure S2 depicts the synoptic conditions representing the early pollution and heavily polluted stages of both EP1 and EP2. On 13 October, the start of EP1, the PRD was heavily influenced by Typhoon Vongfong, which brought clean air and strong advection supported by intense isobars (Figure S2(a)). Under this condition, the PM2.5 concentrations were not high but did undergo accumulation at NH, HS, and SD. However, when Typhoon Vongfong left the PRD on 17 October, the isobars controlling the region became sparse (Figure S2(b)), and the heavily polluted stage of EP1, with horizontally stagnant air conditions, was established. Under this circumstance, NH, HS, and SD maintained uniformly high PM2.5 concentrations of 100.0, 91.8, and 84.4 μg m−3, respectively. For EP2, we also found that the isobars were intense on 22 October (start of the episode), but turned significantly sparser on 26 October (heavily polluted stage) (Figure S2(c,d)). Thus, we conclude that air pollutant accumulation under stagnant air conditions resulted in these regional pollution events in the PRD. However, a remarkable difference was observed between the two pollution events: the PRD in the heavily polluted stage of EP2 was controlled by a high-pressure center, which was not detected in the same stage of EP1 (Figure S2(b–d)). High-pressure centers usually lead to vertical sinking of air masses, which not only reduces the possibility of precipitation but inhibits vertical diffusion of air pollutants. This might explain the consistently higher PM2.5 concentrations at NH, HS, and SD in EP2 than in EP1.
3.3.2 Sources and regional transport
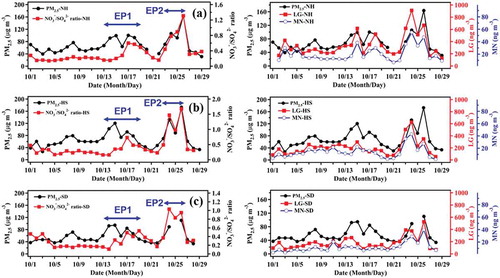
Despite the remarkable spatial homogeneity of the air pollutants, geographic differences among the PM2.5 concentrations at the three sites, caused by different environments and sources, were still observed. We found that the SOC/OC ratios at both HS and SD were reduced during the pollution events, while this ratio at NH was slightly higher in EP2 than on normal days. Due to limited data, a precise explanation for this particular temporal variation of SOC/OC at NH is still unknown. shows the temporal variations of PM2.5, [NO3−]/[SO42−] ratio, and biomass burning tracers (BBT) during the field study. We observed that the peak concentrations of PM2.5 during EP1 and EP2 overall corresponded to similar peak values of [NO3−]/[SO42−]. NO3− is chemically formed from the oxidation of NOx, which is chiefly contributed by traffic emissions in the PRD region. SO2, meanwhile, the precursor of SO42−, is mainly emitted from power plants (Bian et al. Citation2019). Thus, considering the consistently stagnant air conditions for both EP1 and EP2 as mentioned above, the accumulation of local traffic emissions in the PRD region (including suburban areas) likely played important roles in the PM pollution events. Differing from the straightforward correspondence between the PM2.5 concentrations and [NO3−]/[SO42−] at all three sites, the relationships between PM2.5 and BBT were much more complicated. During EP1, PM2.5 and BBT were highly correlated at NH, but this was not the case for HS and SD, likely suggesting that there was no obvious regional transport of biomass burning events during this period. NH is a typical suburban location surrounded by farmland, making it plausible that local biomass burning emissions rapidly accumulated in EP1 under stagnant air conditions. In contrast, the peaks of BBT concentration tracked those of PM2.5 at all three sites during EP2, indicating a significant contribution of regionally transported biomass burning aerosols to the PM2.5 concentration in the PRD region during this episode. To explore the possible geographic origins of these transported biomass burning aerosols, backward trajectories and MODIS fire data for normal days, EP1, and EP2 are presented in Figure S3. The 72-h backward trajectories for EP1, when Typhoon Vongfong was strong, mainly came from the northern continent (45% of the total) and ocean (55% of the total). In contrast, a high-pressure center controlled the PRD region during EP2, with the dominant air mass originated from the north and a local anticyclone (Figure S3). The contribution of the air masses from the ocean was extremely low (~5%). In general, continental air mass is more influenced by anthropogenic emissions and likely contains large proportions of BBT or nitrate, while oceanic air mass is less polluted by human activities. The distribution of fire spots did not significantly differ among the three periods, with most fire points located in the north or east of Guangdong Province (Figure S3). Thus, large amounts of oceanic air mass in EP1 would have diluted the contribution of anthropogenic emissions, leading to lower [NO3−]/[SO42−] ratio and BBT concentrations in EP1 than in EP2.
Figure 4. Temporal variations of PM2.5, LG (levoglucosan), MN (mannosan), and [NO3−]/[SO42−] ratio during the measurement period at (a) NH site, (b) HS site, and (c) SD site.
![Figure 4. Temporal variations of PM2.5, LG (levoglucosan), MN (mannosan), and [NO3−]/[SO42−] ratio during the measurement period at (a) NH site, (b) HS site, and (c) SD site.](/cms/asset/63234dd7-cb48-4d0c-bd15-9854a15defb3/taos_a_1740055_f0004_c.jpg)
4. Conclusions
Field measurements at three sites were conducted to characterize PM2.5 in the PRD region during October 2014. Two pollution events, both of which occurred simultaneously at all three sites, were observed during 13–19 October and 23–27 October, respectively, suggesting that atmospheric aerosol pollution in the PRD was regional in scale during this observation period. The chemical compositions of PM2.5 were similar among the three sites, with dominant contributions of organics and sulfates. In addition, a consistent trend was revealed in the PRD region in that the nitrate concentration became significantly higher during pollution events. Mesoscale synoptic systems, bringing stagnant air conditions such as high-pressure centers, triggered regional pollution events. Accumulation of traffic emissions was also found to play important roles in particle pollution across the PRD region. Finally, we explored the influence of regionally transported biomass burning aerosols in the PRD region, which contributed little in EP1 yet had a tremendous responsibility for the atmospheric aerosol pollution during EP2. The backward trajectories and satellite fire spot data showed that air mass from eastern or northern Guangdong brought abundant biomass burning aerosols to the PRD region.
Supplemental Material
Download PDF (692.9 KB)Disclosure Statement
No potential conflict of interest was reported by the authors.
Supplementary Material
Supplemental data for this article can be accessed here.
Additional information
Funding
References
- Bian, Y., Z. Huang, J. Ou, Z. Zhong, Y. Xu, Z. Zhang, X. Xiao, et al. 2019. “Evolution of Anthropogenic Air Pollutant Emissions in Guangdong Province, China, from 2006 to 2015.” Atmospheric Chemistry and Physics 19: 11701–11719. doi:10.5194/acp-19-11701-2019.
- Cao, J. J., J. C. Chow, J. G. Watson, F. Wu, Y. M. Han, Z. D. Jin, Z. X. Shen, and Z. S. An. 2008. “Size-differentiated Source Profiles for Fugitive Dust in the Chinese Loess Plateau.” Atmospheric Environment 42: 2261–2275. doi:10.1016/j.atmosenv.2007.12.041.
- Cheng, Y., K. B. He, F. K. Duan, M. Zheng, Y. L. Ma, and J. H. Tan. 2009. “Positive Sampling Artifact of Carbonaceous Aerosols and Its Influence on the Thermal-optical Split of OC/EC.” Atmospheric Chemistry and Physics 9: 7243–7256. doi:10.5194/acp-9-7243-2009.
- Chow, J., J. Watson, L. W. A. Chen, G. Paredes-Miranda, M. C. O. Chang, D. Trimble, K. Fung, H. Zhang, and J. Z. Yu. 2005. “Refining Temperature Measures in Thermal/optical Carbon Analysis.” Atmospheric Chemistry and Physics Discussions 5: 4477–4505. doi:10.5194/acpd-5-4477-2005.
- Ding, X., X. M. Wang, B. Gao, X.-X. Fu, Q.-F. He, X.-Y. Zhao, J.-Z. Yu, and M. Zheng. 2012. “Tracer-based Estimation of Secondary Organic Carbon in the Pearl River Delta, South China.” Journal of Geophysical Research: Atmospheres 117: D05313. doi:10.1029/2011jd016596.
- Ding, X. X., L. D. Kong, C. T. Du, A. Zhanzakova, H. B. Fu, X. F. Tang, L. Wang, X. Yang, J. M. Chen, and T. T. Cheng. 2017. “Characteristics of Size-resolved Atmospheric Inorganic and Carbonaceous Aerosols in Urban Shanghai.” Atmospheric Environment 167: 625–641. doi:10.1016/j.atmosenv.2017.08.043.
- Fu, H. B., and J. M. Chen. 2017. “Formation, Features and Controlling Strategies of Severe Haze-fog Pollutions in China.” Science of the Total Environment 578: 121–138. doi:10.1016/j.scitotenv.2016.10.201.
- Hua, Y., Z. Cheng, S. Wang, J. Jiang, D. Chen, S. Cai, X. Fu, et al. 2015. “Characteristics and Source Apportionment of PM2.5 During a Fall Heavy Haze Episode in the Yangtze River Delta of China.” Atmospheric Environment 123: 380–391. doi:10.1016/j.atmosenv.2015.03.046.
- Huang, X. F., B. B. Zou, L. Y. He, M. Hu, A. S. H. Prévôt, and Y. H. Zhang. 2018. “Exploration of PM2.5 Sources on the Regional Scale in the Pearl River Delta Based on ME-2 Modeling.” Atmospheric Chemistry and Physics 18: 11563–11580. doi:10.5194/acp-18-11563-2018.
- IPCC (Intergovernmental Panel on Climate Change). 2013. “Summary for Policymakers Climate Change 2013: The Physical Science Basis.” Contribution of Working Group I to the Fifth Assessment Report of the Intergovernmental Panel on Climate Change. Cambridge University Press.
- Li, H., Q. Zhang, Q. Zhang, C. Chen, L. Wang, Z. Wei, S. Zhou, et al. 2017a. “Wintertime Aerosol Chemistry and Haze Evolution in an Extremely Polluted City of the North China Plain: Significant Contribution from Coal and Biomass Combustion.” Atmospheric Chemistry and Physics 17: 4751–4768. doi:10.5194/acp-17-4751-2017.
- Li, J., H. Du, Z. Wang, Y. Sun, W. Yang, J. Li, X. Tang, and P. Fu. 2017b. “Rapid Formation of a Severe Regional Winter Haze Episode over a Mega-city Cluster on the North China Plain.” Environmental Pollution 223: 605–615. doi:10.1016/j.envpol.2017.01.063.
- Li, W., X. Liu, Y. Zhang, K. Sun, Y. Wu, R. Xue, L. Zeng, Y. Qu, and J. An. 2018. “Characteristics and Formation Mechanism of Regional Haze Episodes in the Pearl River Delta of China.” Journal of Environmental Sciences 63: 236–249. doi:10.1016/j.jes.2017.03.018.
- Li, Y. J., Y. Sun, Q. Zhang, X. Li, M. Li, Z. Zhou, and C. K. Chan. 2017c. “Real-time Chemical Characterization of Atmospheric Particulate Matter in China: A Review.” Atmospheric Environment 158: 270–304. doi:10.1016/j.atmosenv.2017.02.027.
- Liu, J., P. Ding, Z. Zong, J. Li, C. Tian, W. Chen, M. Chang, et al. 2018. “Evidence of Rural and Suburban Sources of Urban Haze Formation in China: A Case Study from the Pearl River Delta Region.” Journal of Geophysical Research: Atmospheres 123: 4712–4726. doi:10.1029/2017jd027952.
- Liu, J., J. Li, Y. Zhang, D. Liu, P. Ding, C. Shen, K. Shen, et al. 2014. “Source Apportionment Using Radiocarbon and Organic Tracers for PM2.5 Carbonaceous Aerosols in Guangzhou, South China: Contrasting Local- and Regional-Scale Haze Events.” Environmental Science & Technology 48: 12002–12011. doi:10.1021/es503102w.
- Pan, Y., S. Tian, D. Liu, Y. Fang, X. Zhu, Q. Zhang, B. Zheng, G. Michalski, and Y. Wang. 2016a. “Fossil Fuel Combustion-Related Emissions Dominate Atmospheric Ammonia Sources during Severe Haze Episodes: Evidence from 15N-Stable Isotope in Size-Resolved Aerosol Ammonium.” Environmental Science & Technology 50: 8049–8056. doi:10.1021/acs.est.6b00634.
- Pan, Y., Y. Wang, J. Zhang, Z. Liu, L. Wang, S. Tian, G. Tang, et al. 2016b. “Redefining the Importance of Nitrate during Haze Pollution to Help Optimize an Emission Control Strategy.” Atmospheric Environment 141: 197–202. doi:10.1016/j.atmosenv.2016.06.035.
- Pope III, C. A., and D. W. Dockery. 2006. “Health Effects of Fine Particulate Air Pollution: Lines that Connect.” Journal of the Air & Waste Management Association 56: 709–742. doi:10.1080/10473289.2006.10464485.
- Qin, Y. M., H. B. Tan, Y. J. Li, M. I. Schurman, F. Li, F. Canonaco, A. S. H. Prévôt, and C. K. Chan. 2017. “Impacts of Traffic Emissions on Atmospheric Particulate Nitrate and Organics at a Downwind Site on the Periphery of Guangzhou, China.” Atmospheric Chemistry and Physics 17: 10245–10258. doi:10.5194/acp-17-10245-2017.
- Sun, Y., Q. Jiang, Z. Wang, P. Fu, J. Li, T. Yang, and Y. Yin. 2014. “Investigation of the Sources and Evolution Processes of Severe Haze Pollution in Beijing in January 2013.” Journal of Geophysical Research: Atmospheres 119: 4380–4398. doi:10.1002/2014JD021641.
- Tang, L., H. Yu, A. Ding, Y. Zhang, W. Qin, Z. Wang, W. Chen, Y. Hua, and X. Yang. 2016. “. Regional Contribution to PM1 Pollution during Winter Haze in Yangtze River Delta, China.” Science of the Total Environment 541: 161–166. doi:10.1016/j.scitotenv.2015.05.058.
- Tao, J., J. Gao, L. Zhang, R. Zhang, H. Che, Z. Zhang, Z. Lin, J. Jing, J. Cao, and S. C. Hsu. 2014. “PM2.5 Pollution in a Megacity of Southwest China: Source Apportionment and Implication.” Atmospheric Chemistry and Physics 14: 8679–8699. doi:10.5194/acp-14-8679-2014.
- Wang, B., Y. Liu, M. Shao, S. Lu, M. Wang, B. Yuan, Z. Gong, et al. 2016. “The Contributions of Biomass Burning to Primary and Secondary Organics: A Case Study in Pearl River Delta (PRD), China.” Science of the Total Environment 569–570: 548–556. doi:10.1016/j.scitotenv.2016.06.153.
- Wang, Y., L. Wang, T. Petäjä, Q. Zha, C. Gong, S. Li, Y. Pan, B. Hu, J. Xin, and M. Kulmala. 2019. “Increased Inorganic Aerosol Fraction Contributes to Air Pollution and Haze in China.” Atmospheric Chemistry and Physics 19: 5881–5888. doi:10.5194/acp-19-5881-2019.
- Zhang, Z., G. Engling, C.-Y. Lin, C. C. K. Chou, S.-C.-C. Lung, S.-Y. Chang, S. Fan, C.-Y. Chan, and Y.-H. Zhang. 2010. “Chemical Speciation, Transport and Contribution of Biomass Burning Smoke to Ambient Aerosol in Guangzhou, a Mega City of China.” Atmospheric Environment 44: 3187–3195. doi:10.1016/j.atmosenv.2010.05.024.
- Zhou, S., P. K. Davy, M. Huang, J. Duan, X. Wang, Q. Fan, M. Chang, et al. 2018. “High-resolution Sampling and Analysis of Ambient Particulate Matter in the Pearl River Delta Region of Southern China: Source Apportionment and Health Risk Implications.” Atmospheric Chemistry and Physics 18: 2049–2064. doi:10.5194/acp-18-2049-2018.
- Zhou, S., T. Wang, Z. Wang, W. Li, Z. Xu, X. Wang, C. Yuan, C. Poon, P. K. Louie, and C. W. Luk. 2014. “Photochemical Evolution of Organic Aerosols Observed in Urban Plumes from Hong Kong and the Pearl River Delta of China.” Atmospheric Environment 88: 219–229. doi:10.1016/j.atmosenv.2014.01.032.
- Zou, Y., X. Deng, D. Zhu, D. Gong, H. Wang, F. Li, H. Tan, et al. 2015. “Characteristics of 1 Year of Observational Data of VOCs, NOx and O3 at a Suburban Site in Guangzhou, China.” Atmospheric Chemistry and Physics 15: 6625–6636. doi:10.5194/acp-15-6625-2015.