
ABSTRACT
Open biomass burning (OBB) has a significant impact on the heavy haze pollution in Northeast China (NEC) in recent years, which requires the investigation of the spatiotemporal variations of OBB with different vegetation types to better monitor and control OBB in NEC. The MODIS C6 fire and land cover products, together with the emissions inventory from the Global Fire Assimilation System, were used in this study. The changes in the total number of MODIS fire points in NEC from 2003 to 2017 demonstrated a fluctuating but generally rising trend, with a peak during 2013–2017. Most fire points concentrated in two key periods, i.e. March–April (37%) and October–November (46%). The total number of crop residue burnings in March–April was basically slightly fluctuating and increased sharply from 2013, whilst the number in October–November had a fluctuating and upward trend until 2015, when a decline appeared. The amount of OBB in March–April was higher than that in October–November during 2016–17. OBB in Heilongjiang Province comprised a major proportion of all fires, which accounted for 70.7% from 2003 to 2017; however, the proportion was only 66.2% during 2013–2017. The largest proportion of all fires was in cropland (90.8%), then forest (5.3%) and grassland (3.1%). The cumulative emissions of fine particulate matter, nitrogen oxides, and ammonia from agricultural open burning in NEC reached 78.43 Gg, 24.9 Gg, and 13.7 Gg for March–April during 2013–17, respectively, which were close to those in October–November.
Graphical abstract
摘要
近年来, 露天生物质燃烧对我国东北重霾污染影响显著。本文综合利用MODIS C6火点产品以及下垫面类型产品, 结合GFAS火点排放清单数据, 定量研究了2003–2017年东北的火点演变特征。结果显示, 东北区域近15年来火点震荡增加, 并在2013–2017年达到峰值。火点季节变化明显, 主要集中3–4月 (占37%) 和10–11月 (占46%), 2013年之后春季火点突增, 且在2016–2017年春季火点超过秋季。空间分布上, 火点主要位于黑龙江 (占71%), 其次是吉林 (16%) 和辽宁 (13%) 。相比森林和草地下垫面类型, 农田火点占比高达91%。本研究结果为东北区域露天生物质燃烧的重点监测时段和管控方案制订提供了参考依据。
1. Introduction
Open biomass burning (OBB) releases a large number of trace gases and particles, which influences the weather and climate change, public health, and air quality (Chen et al. Citation2017b; Koppmann, Czapiewski, and Reid Citation2005; Reid et al. Citation2005a, Citation2005b). Many studies have indicated that OBB elevates the haze pollution levels during harvest seasons in certain regions over China (Zhang, Liu, and Hao Citation2016; Yang et al. Citation2015, Citation2017). Particles and trace gases, e.g. nitrogen oxides (NOx), ammonia (NH3), and volatile organic compounds emitted from OBB play an important role in the formation of ozone and aerosol chemistry of the troposphere (Yokelson et al. Citation1999; Wang et al. Citation2015; Pfister, Wiedinmyer, and Emmons Citation2008). Northeast China (NEC), including three provinces, is the important crop production area in China, with an estimated cropland area of 2 × 10⁵ km2. Furthermore, the total amount of grain yield in NEC accounts for more than one-third of Chinese production, and thus the amount of crop residue is huge. Excessive crop straws are burned to clear land, which has induced serious air pollution in NEC (Chen et al. Citation2017c; Zhao et al. Citation2017; Zhuang et al. Citation2018a; Ma et al. Citation2017; Cao et al. Citation2017; Yang et al. Citation2017).
The spatial and temporal distribution of OBB with different vegetation types in China using satellite data has been investigated in some studies (Zhuang et al. Citation2018b; Ke et al. Citation2019; Chen et al. Citation2017a), and the results indicate that the highest number of fire spots occurs in NEC in spring and autumn over China. Results also indicate that crop residue burning in different regions featured an oscillatory increase from 2003 to 2017 and comprised a major proportion in NEC (Zhuang et al. Citation2018b). The majority of fires in NEC takes place on cropland and mainly occurs in spring and autumn (Ke et al. Citation2019). In addition, many forest fires also occur in NEC, and their interannual variations are large because such fires usually happen by accident (Chen et al. Citation2017a).
In particular, the Global Fire Assimilation System (GFAS), assimilating fire radiative power (FRP) observations by satellites, can produce a biomass burning emissions inventory on the daily scale (Kaiser et al. Citation2012), which is helpful in identifying small and weak intensity agricultural fires. Nitrate is one of the primary compounds in aerosol during heavy pollution episodes in urban or regional environments (Chen et al. Citation2017c; Yang et al. Citation2015). The emitted NOx and HN3 from OBB can react in the downwind area and facilitate the formation of nitrate and ammonium. Although the state ‘Air Pollution Prevention and Control Action Plan’ has been conducted since 2013, air pollution in NEC remains very heavy, especially in autumn and winter. Compared with anthropogenic emissions, biomass burning emissions are considerably important in certain periods for some pollutants in NEC (Ke et al. Citation2019).
Up to now, most studies have explored the variation in OBB on the national scale. However, a detailed understanding of the variations in OBB at multiple spatial and temporal scales with different vegetation types in different provinces over NEC is lacking. Therefore, by using MODIS fire and land cover products and GFAS emissions inventory data, the spatial and temporal distribution of OBB in NEC was explored thoroughly from 2003 to 2017. This research will help in evaluating the effectiveness of the burn-ban policy.
2. Data and methods
2.1. Study area
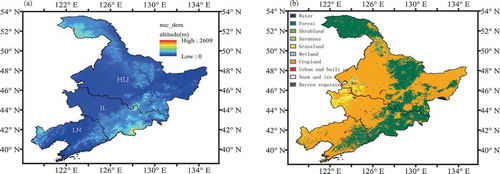
NEC, including three provinces, i.e. Heilongjing (HLJ), Jilin (JL), and Liaoning (LN), is shown in . The maps of topography and land cover type from the MODIS MCD12Q1 product reveal the dominant vegetation types are cropland and forest, which concentrate in the plains and mountains, respectively.
Figure 1. Maps of (a) topography and (b) land cover type from the MODIS MCD12Q1 product in Northeast China. HLJ, JL, and LN represent the provinces of Heilongjiang, Jilin, and Liaoning, respectively.
2.2. MODIS active fire products (C6)
MODIS active fire products (C6) were analysed in this study, which were downloaded from the Fire Information for Resource Management System (https://firms.modaps.eosdis.nasa.gov/download/). The horizontal resolution of these fire products is about 1 km2, and the temporal resolution is four times per day. The location of fire, detection time (in UTC), brightness temperature, fire radiation power, and confidence are provided.
2.3. GFAS fire emissions inventory (V1.2)
GFAS assimilates FRP observations from the NASA Terra MODIS and Aqua MODIS active fire products (http://modis-fire.umd.edu/) to produce daily estimates of biomass burning emissions (Kaiser et al. Citation2012). GFAS data include FRP, dry matter burnt, and biomass burning emissions with a horizontal resolution of 0.1° on a global scale, which can be downloaded from https://apps.ecmwf.int/datasets/data/cams-gfas/. Version 1.2 is used in this paper.
2.4. Land cover dataset
The MODIS Land Cover Type Product (MCD12Q1) supplies global maps of land cover at annual time steps and 500 m spatial resolution (https://lpdaac.usgs.gov/products/mcd12q1v006/). The primary land cover scheme is provided by an International Geosphere–Biosphere Programme land cover classification. The major vegetation types were reclassified as forests (evergreen needleleaf forest, evergreen broadleaf forest, deciduous needleleaf forest, deciduous broadleaf forest, mixed forest), savannas (woody savannas and savannas), grasslands, and croplands in this study. In addition, the map of MODIS land cover was resampled to two new resolution maps, i.e. a 1-km spatial resolution map for extracting MODIS fire spots and a 0.1° spatial resolution map for extracting GFAS emissions data in different land cover types.
3. Results and discussion
3.1. Temporal and spatial variability of OBB in NEC
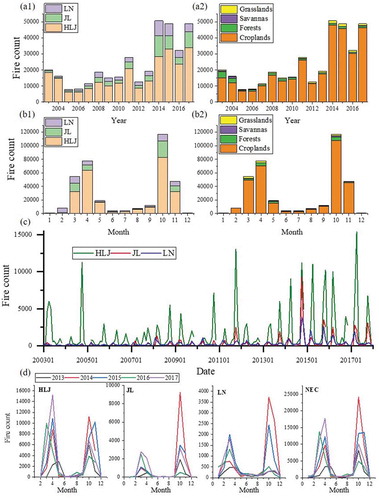
The variation in the total number of MODIS fire points in NEC demonstrated a fluctuating but generally rising trend from 2003 to 2017 (). It can be divided into three periods, i.e. the first period (2003–07) with a low amount of OBB; the second period (2008–2012) with a moderate amount; and the third period (2013–17) with a rather large amount. The total number of fires in the third period increased rapidly, which was 3.1 times and 2.2 times higher than that in the first and second period, respectively.
Figure 2. The (a1, a2) annual and (b1, b2) monthly variation in (a1, b1) MODIS fire count in different provinces and (a2, b2) the dominant land cover types in Northeast China. (c, d) Monthly series of fire counts in different provinces from (c) 2003 to 2017 and (d) 2013 to 2017. HLJ, JL, and LN represent the provinces of Heilongjiang, Jilin, and Liaoning, respectively.
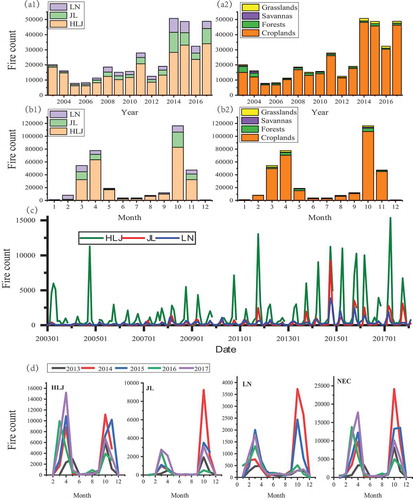
At the monthly scale, the fires mainly occurred in March–April (accounting for 37%) and October–November (46%), followed by a relatively lower number of fire points in May and September (9%). Generally, there was no significant variation in summer and winter, which remained at a low level. The majority of detected fire spots in March–April and October–November was in cropland, which was generally consistent with the ploughing and harvesting time of crops planted in these croplands of NEC, respectively. The total number of OBBs in March–April was basically slightly fluctuating and increased sharply from 2013, whilst the number in October–November had a fluctuating and upward trend until 2015, when a decline appeared.
At the provincial scale, the spatial distribution pattern of OBB in NEC was distinct. OBB in HLJ comprised a major proportion of the total number of fire spots in NEC, which accounted for 70.7%; while the proportions of OBB in JL and LN were small and close (16.2% and 13.1%, respectively). However, during 2013–17, the proportion in HLJ decreased to 66.2%, whereas the proportion in LN and JL increased to19.5% and 14.2%, respectively, especially in March, April, October, and November ( and ). Although the total number of OBBs in these three provinces all revealed an increasing trend from 2003 to 2017, the growth in JL and LN was faster. Compared with the total number of OBBs in the first period, the total number reached 2.5 times, 7.7 times, and 6.1 times in the third period for HLJ, JL, and LN, respectively. Generally, from a spatiotemporal perspective, this research reveals that OBB, especially crop residue burning, in NEC has been the most active among all regions both in spring and autumn in recent years.
Figure 3. Distributions of fire spots in different periods in NEC in (a) March and April, and (b) in October and November, from 2003 to 2017.

Four major vegetation types of fires demonstrated the largest proportion in cropland (90.8%), then in forest (5.3%) and grassland (3.1%), with the fewest in savanna, which was attributed to the larger proportion of cropland and forest to the entire vegetation coverage (). The fluctuation in the fire number of forests was slight, with higher values in 2003 and 2004. In addition, the amount of fires in forests was higher in April, October, and May. There was a large amount of fire spots in March and April in 2003, as well as October in 2004. That was because dry air in spring resulted in forest fires. Forest fire is associated with higher temperatures and lower precipitation in spring (Ke et al. Citation2019). Most forest fires concentrated in HLJ, accounting for 67%, and then the second highest proportion (24%) was in LN. Fire spots in grasslands still accounted for a very small proportion before 2013, then increased slightly, mainly distributed in the west of NEC (33% in HLJ and 55% in JL). Most fires in grasslands occurred in March, April, and October.
3.2. Temporal and spatial variability of OBB during 2013–17 in NEC
It is worth stressing that OBB experienced a significant increase after 2013, with peaks in 2014, 2015, and 2017. Fires occurred mainly in March, April, October, and November. The majority of OBB could be attributed to crop residue burning (94%). In addition, the majority of OBB generally shifted from October–November to March–April for all three provinces (), and the amount of OBB in March–April was higher than that in October–November after 2016. The proportion in October–November and March–April during 2013–15 was 52%–67% and 31%–37%, respectively, for different provinces, while the proportion changed to 31%–35% and 59%–61% during 2016–17. For the spatial distribution, the proportion in HLJ decreased, whereas the proportion in LN and JL increased quickly in these five years () and ).
NEC has a considerable quantity of crop residue owing to its relatively flat land and plenty of crops. Spring maize and japonica rice are planted in late April, and soybean is sown in mid-May; in addition, the harvest season for almost all agricultural crops is focused in October. Thus, the burning time of corn, rice, and soybean residues mainly concentrates before spring ploughing or after harvest, i.e. March, April, October, and November. To mitigate the heavy air pollution and enhance national environmental supervision, the national ‘Air Pollution Prevention and Control Action Plan’ started in 2013, and the control of crop residue burning has been conducted since January 2015. However, due to the lack of effective utilization approaches, the elevated living standards of rural peasants, and the decreasing rural labour force, massive amounts of crop straw are burned in the cropland of NEC, which is a direct, convenient, and costless way. In addition, because more days with stagnant weather and temperature inversion occur in autumn than in spring, heavy regional haze pollution frequently happens in autumn. Thus, the measures for banning straw burning in autumn are carried out substantially, which may contribute to the conversion of the majority of OBB from October–November to March–April. Generally, more effective utilization approaches for crop residue and strict policies should be taken to control the upward trend of crop residue burning in the future. In general, cloud coverage influences the detection of fire by satellites. However, previous research has revealed little change in the interannual variation of average cloud fractions in NEC during 2013–17, and thus cloud coverage consistently affected OBB in different years (Ke et al. Citation2019).
3.3. PM2.5, NOx, and NH3 emissions from agricultural open burning in NEC
By extracting crop residue burning spots using GFAS data and a spatial distribution dataset of land cover, this research attempted to quantify the emissions of fine particulate matter (PM2.5), NOx, and NH3 at a provincial scale in the dominant fire months in NEC. The reason why we considered the NOx and NH3 is that the emissions from crop straw burning boost the atmospheric chemistry in the downstream urban area (Yang et al. Citation2015; Wang et al. Citation2015). Notably, due to a wide range of forest fires in HLJ in March and April 2003 and October 2004, the emissions in these months were very high (). The higher FRP and greater fire number during forest fires are shown in Figure S1, compared with the lower FRP for normal agricultural burning, which indicates the fire intensity of cropland burning is lower than the other fire regime variables (Chen et al. Citation2017a).
Figure 4. The (a) PM2.5, (b) NOx and (c) NH3 emissions of open biomass burning in cropland in different months from 2003 to 2017. HLJ, JL, and LN represent the provinces of Heilongjiang, Jilin, and Liaoning, respectively.
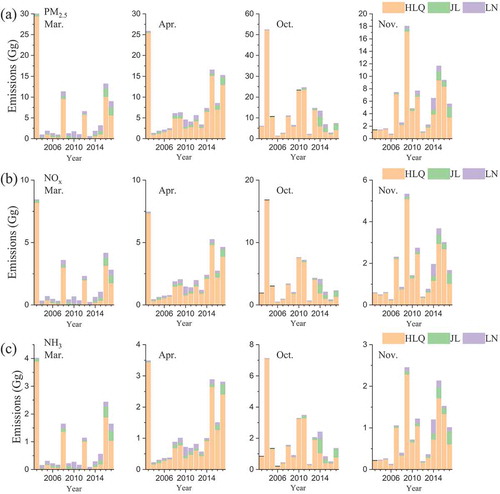
The emissions of crop residue burning revealed a significantly fluctuating increase in March and April, with a climb to a considerable level since 2013 for the three provinces. The cumulative emissions of PM2.5, NOx and NH3 reached 78.43 Gg, 24.9 Gg, and 13.7 Gg in March and April during 2013–17, respectively. High pollutant emissions concentrated in HLJ, with a proportion of 78%, which was related to the frequent agricultural activities in this region. However, the variation in crop residue burning emissions in October and November was a little different. For HLJ, a fluctuating and upward trend stopped in 2013 for the month of October, while it was 2015 for November, and then a decline appeared. For JL and LN, the gradual rising trend occurred from 2003 to 2017. The total emission amounts during 2013–17 in March–April and October–November were close. However, a significant difference in emissions amount appeared during 2003–12, which demonstrated much higher emissions in October–November in HLJ and in March–April in JL and LN. Although the time of the satellite overpass, cloud cover, and the neglect of small fires may result in underestimating the straw combustion emissions, it is crucial for us to quantify the long-term interannual variation of main pollutant emissions in different provinces in NEC.
4. Conclusions
By using the MODIS fire and land cover products, we attempted to capture the spatial and temporal distribution of OBB in NEC from 2003 to 2017, as well as the corresponding proportion of fire points in different vegetation types. This research provides scholars and decision-makers with a more comprehensive and long-term analysis of the spatiotemporal patterns of OBB in NEC.
The results revealed a fluctuating, upward trend of OBB in NEC since 2003. Three periods, i.e. the first period (2003–07) with a low amount of OBB, the second period (2008–12) with a moderate amount, and the third period (2013–17) with a rather large amount were defined. Fires were dominant in March–April (accounting for 37%) and October–November (46%), followed by a relatively lower number in May and September (9%). This phenomenon is generally consistent with the ploughing and harvesting time of crops planted in these croplands of NEC. OBB in HLJ comprised a major proportion in the total number of fire spots in NEC; however, the proportion decreased from 84.7% to 66.2% from the first to the third period. Four major vegetation types of fires demonstrated the largest proportion in cropland (90.8%), then in forest (5.3%) and grassland (3.1%), with the fewest in savanna. Notably, OBB (94% from crop residue burning) experienced a significant increase after 2013, with the peaks in 2014, 2015, and 2017; in addition, the majority of OBB generally shifted from October–November to March–April for all three provinces and the amount of OBB in March–April was higher than that in October–November during 2016–17. The cumulative emissions of PM2.5, NOx, and NH3 reached 158.46 Gg, 49.50 Gg, and 27.00 Gg in March, April, October, and November during 2013–17, respectively. The results indicate more effective utilization approaches for crop residue and strict policies should be taken to control the upward trend of crop residue burning in NEC.
Supplemental Material
Download Zip (392.1 KB)Disclosure statement
No potential conflict of interest was reported by the authors.
Supplementary material
Supplemental data for this article can be accessed here.
Additional information
Funding
References
- Cao, F., S. C. Zhang, K. Kawamura, X. Liu, C. Yang, Z. Xu, M. Fan, et al. 2017. “Chemical Characteristics of Dicarboxylic Acids and Related Organic Compounds in PM2.5 During Biomass-burning and Non-biomass-burning Seasons at a Rural Site of Northeast China.” Environmental Pollution 231 (Pt 1): 654–662. doi:10.1016/j.envpol.2017.08.045.
- Chen, D. M., J. M. C. Pereira, A. Masiero, and F. Pirotti. 2017a. “Mapping Fire Regimes in China Using MODIS Active Fire and Burned Area Data.” Applied Geography 85: 14–26. doi:10.1016/j.apgeog.2017.05.013.
- Chen, J., C. Li, Z. Ristovski, A. Milic, Y. Gu, M. S. Islam, S. Wang, et al. 2017b. “A Review of Biomass Burning: Emissions and Impacts on Air Quality, Health and Climate in China.” The Science of the Total Environment 579: 1000–1034. doi:10.1016/j.scitotenv.2016.11.025.
- Chen, W., D. Q. Tong, M. Dan, S. Zhang, X. Zhang, and Y. Pan. 2017c. “Typical Atmospheric Haze during Crop Harvest Season in Northeastern China: A Case in the Changchun Region.” Journal of Environmental Sciences (China) 54: 101–113. doi:10.1016/j.jes.2016.03.031.
- Kaiser, J. W., A. Heil, M. O. Andreae, A. Benedetti, N. Chubarova, L. Jones, J. J. Morcrette, et al. 2012. “Biomass Burning Emissions Estimated with a Global Fire Assimilation System Based on Observed Fire Radiative Power.” Biogeosciences 9 (1): 527–554. doi:10.5194/bg-9-527-2012.
- Ke, H. B., S. L. Gong, J. J. He, C. H. Zhou, L. Zhang, and Y. K. Zhou. 2019. “Spatial and Temporal Distribution of Open Bio-mass Burning in China from 2013 to 2017.” Atmospheric Environment 210: 156–165. doi:10.1016/j.atmosenv.2019.04.039.
- Koppmann, R., K. von Czapiewski, and J. S. Reid. 2005. “A Review of Biomass Burning Emissions, Part I: Gaseous Emissions of Carbon Monoxide, Methane, Volatile Organic Compounds, and Nitrogen Containing Compounds.” Atmospheric Chemistry and Physics Discussions 5 (5): 10455–10516. doi:10.5194/acpd-5-10455-2005.
- Ma, S. Q., W. W. Chen, S. C. Zhang, Q. S. Tong, Q. Y. Bao, and Z. T. Gao. 2017. “Characteristics and Cause Analysis of Heavy Haze in Changchun City in Northeast China.” Chinese Geographical Science 27 (6): 989–1002. doi:10.1007/s11769-017-0922-6.
- Pfister, G. G., C. Wiedinmyer, and L. K. Emmons. 2008. “Impacts of the Fall 2007 California Wildfires on Surface Ozone: Integrating Local Observations with Global Model Simulations.” Geophysical Research Letters 35 (19): 19. doi:10.1029/2008gl034747.
- Reid, J. S., R. Koppmann, T. F. Eck, and D. P. Eleuterio. 2005a. “A Review of Biomass Burning Emissions Part II: Intensive Physical Properties of Biomass Burning Particles.” Atmospheric Chemistry and Physics 5 (3): 799–825. doi:10.5194/acp-5-799-2005.
- Reid, J. S., F. E. Thomas, S. A. Christopher, R. Koppmann, O. Dubovik, D. P. Eleuterio, B. N. Holben, E. A. Reid, and J. L. Zhang. 2005b. “A Review of Biomass Burning Emissions Part III: Intensive Optical Properties of Biomass Burning Particles.” Atmospheric Chemistry and Physics 5 (3): 827–849. doi:10.5194/acp-5-827-2005.
- Wang, L. L., J. Y. Xin, X. R. Li, and Y. S. Wang. 2015. “The Variability of Biomass Burning and Its Influence on Regional Aerosol Properties during the Wheat Harvest Season in North China.” Atmospheric Research 157: 153–163. doi:10.1016/j.atmosres.2015.01.009.
- Yang, T., A. Gbaguidi, P. Yan, W. Zhang, L. Zhu, X. Yao, Z. Wang, and H. Chen. 2017. “Model Elucidating the Sources and Formation Mechanisms of Severe Haze Pollution over Northeast Mega-city Cluster in China.” Environmental Pollution 230: 692–700. doi:10.1016/j.envpol.2017.06.007.
- Yang, Y. R., X. G. Liu, Y. Qu, J. L. An, R. Jiang, Y. H. Zhang, Y. L. Sun, et al. 2015. “Characteristics and Formation Mechanism of Continuous Hazes in China: A Case Study during the Autumn of 2014 in the North China Plain.” Atmospheric Chemistry and Physics 15 (14): 8165–8178. doi:10.5194/acp-15-8165-2015.
- Yokelson, R. J., J. G. Goode, D. E. Ward, R. A. Susott, R. E. Babbitt, D. D. Wade, I. Bertschi, D. W. T. Griffith, and W. M. Hao. 1999. “Emissions of Formaldehyde, Acetic Acid, Methanol, and Other Trace Gases from Biomass Fires in North Carolina Measured by Airborne Fourier Transform Infrared Spectroscopy.” Journal of Geophysical Research: Atmospheres 104 (D23): 30109–30125. doi:10.1029/1999jd900817.
- Zhang, L. B., Y. Q. Liu, and L. Hao. 2016. “Contributions of Open Crop Straw Burning Emissions to PM2.5 Concentrations in China.” Environmental Research Letters 11 (1): 014014. doi:10.1088/1748-9326/11/1/014014.
- Zhao, H. M., X. L. Zhang, S. C. Zhang, W. W. Chen, D. Tong, and A. J. Xiu. 2017. “Effects of Agricultural Biomass Burning on Regional Haze in China: A Review.” Atmosphere 8 (12): 88. doi:10.3390/atmos8050088.
- Zhuang, Y., D. Chen, R. Li, Z. Chen, J. Cai, B. He, B. Gao, N. Cheng, and Y. Huang. 2018a. “Understanding the Influence of Crop Residue Burning on PM2.5 And PM10 Concentrations in China from 2013 to 2017 Using MODIS Data.” International Journal of Environmental Research and Public Health 15: 7. doi:10.3390/ijerph15071504.
- Zhuang, Y., R. Y. Li, H. Yang, D. L. Chen, Z. Y. Chen, B. B. Gao, and B. He. 2018b. “Understanding Temporal and Spatial Distribution of Crop Residue Burning in China from 2003 to 2017 Using MODIS Data.” Remote Sensing 10 (3): 390. doi:10.3390/rs10030390.