
 ?Mathematical formulae have been encoded as MathML and are displayed in this HTML version using MathJax in order to improve their display. Uncheck the box to turn MathJax off. This feature requires Javascript. Click on a formula to zoom.
ABSTRACT
A comprehensive agricultural inventory of ammonia emissions for 2017 in Hefei was established on the basis of the specific emission factors and county-level activity data. The emissions over a 1 km × 1 km grid and the associated monthly variations were distributed on the basis of land-use type and meteorological conditions, respectively. The total ammonia emissions were 27,242.7 t in 2017 in Hefei, to which livestock was the top contributor, accounting for 54.5%. Two major contributors to livestock waste were broilers and laying hens, which contributed 34.5% and 22.2% of the total emissions, respectively. Changfeng, Feixi, and Feidong counties, with more developed agriculture than other counties, accounted for a large proportion of the total ammonia emissions—as much as 28.5%, 24.5%, and 21.0%, respectively. The average emissions density of the whole region was 2.4 t km−2, and the higher values were mostly in areas with denser populations. Seasonally, peak ammonia emissions occurred in summer.
Graphical Abstract
摘要
大气氨是形成细颗粒物和过量氮沉降的主要前体物, 准确编制氨的排放清单对于氨减排策略的制定具有至关重要的指导意义。本研究利用本地化的排放因子, 建立了合肥市2017年高空间分辨率 (1公里) 的农业源氨排放清单。结果表明, 合肥市2017年农业源氨排放总量为27242.7 t, 畜禽源占氨排放总量的54.5%, 其中肉鸡和蛋鸡是畜禽养殖源中最主要的氨排放源。空间分布上, 合肥市平均的氨排放强度为2.4 t km−2, 高值主要出现在人口密度较大的区域, 其中长丰县和肥西县是合肥市农业源氨排放量和排放强度最大的两个城市。时间变化上, 合肥市7月份氨排放量最高。本研究掌握了合肥市农业源氨排放量及其时空变化特征, 有助于为合肥市大气污染防治提供有效的科学支撑。
1. Introduction
Ammonia (NH3) is a significant reactive nitrogen (N) compound in the atmosphere and has significant impacts on both atmospheric chemistry and ecosystems (Battye, Aneja, and Roelle Citation2003). As an alkaline gas, it can neutralize the acid gases (such as sulfur and nitrogen oxides) to form secondary aerosols that very effectively penetrate lung tissues and reduce visibility (Goebes, Strader, and Davidson Citation2003). N deposition may lead to a series of serious ecological issues, such as eutrophication of water bodies (Hamaoui-Laguel et al. Citation2014) and decreasing biodiversity (Galloway et al. Citation1996). When N is deposited in soils, NH3 compounds can be converted into nitrate by nitrification, simultaneously releasing protons and leading to soil acidification (Lin et al. Citation2007).
Many NH3 emission inventories have been established at various levels in China, including the national level (Huang et al. Citation2012) and regional level (Yin et al. Citation2010), as well as the provincial (Shen, Yu, and Xiang Citation2018; Hou et al. Citation2019) and city (Li et al. Citation2019; Su et al. Citation2016; Zhou et al. Citation2016) levels. Previous studies have shown that agricultural sources are major contributors to NH3 emissions and account for more than 80% of the total emissions in China (Dong et al. Citation2009). Because NH3 plays a key role in the formation of fine particle and N deposition, an accurate NH3 emissions inventory of agricultural sources is essential for knowing the current environmental problems and developing reasonable control strategies.
Hefei city is in the eastern part of China and is the political, economic and cultural center of Anhui Province. With the acceleration of urbanization, complex air pollution has become a very serious problem (Wang et al. Citation2018a). There are some NH3 inventories related to pollutant emissions from vehicle exhaust (Wang, Wang, and Hu Citation2018c) and waste treatment (Zhang Citation2012) sources in Hefei, but the emission characteristics of NH3 from agricultural sources have not been studied. Therefore, it is essential to establish an updated and accurate inventory of agricultural NH3 emissions in Hefei. In this study, our aim was to (1) compile NH3 emissions from agricultural sources for Hefei city in 2017; (2) carry out a 1 km × 1 km gridded emissions allocation; (3) analyze the NH3 emission magnitudes, the contribution of each source, and the spatiotemporal distribution characteristics; and (4) evaluate the emissions inventory according to comparisons with previous studies.
2. Methods and data
2.1. Research areas and objects
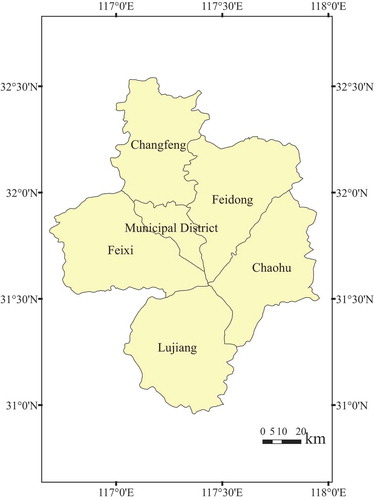
Hefei is located in the eastern part of China between 30°57′N and 32°32′N, and between 116°41′E and 117°58′E (). It comprises four counties (Changfeng, Feidong, Feixi, and Lujiang), one city (Chaohu), and Hefei Municipal District. The agricultural sources include three categories: (1) livestock waste management; (2) a farmland ecosystem (N fertilizer, crop residues, N-fixing crops and cropland soil); and (3) biomass burning. The specific emissions source classification and activity data are listed in Table S1.
Figure 1. Location and administrative divisions of Hefei city, China.
2.2. Data sources
The activity data were based on the local statistical yearbooks. The emission factors (EFs) were mainly adopted from the Technical Guidelines for the Preparation of Atmospheric Ammonia Emissions Inventory from the Ministry of Ecology and Environment of the People’s Republic of China (Citation2014) as well as domestic research results (Shen Citation2014), and the former is preferred.
2.3. Estimation method
The NH3 emissions inventory was established on the basis of activity data from various sources and corresponding EFs, as shown in EquationEquation (1)(1)
(1) :
where E is the agricultural NH3 emissions; i and j represent the county and the source type, respectively; A represents the county-level activity data; EF represents the source-specific EF; and γ is the conversion coefficient for N-NH3 emissions (1.214 for livestock waste, 1.0 for other sources).
2.3.1. Livestock waste management
NH3 emissions from livestock and poultry mainly come from the release of animal waste (Yang Citation2008). Livestock and poultry manure management stages include outside, house, storage, and spread. The last three stages occur indoors and excreta is divided into liquid and solid forms (Shen et al. Citation2014). We selected a total of 14 subcategories including yellow cattle, dairy cows, buffalo, reproductive sow, laying hens, laying ducks, goats, sheep, laying geese, beef cattle, hogs, broilers, meat ducks, and meat geese for the livestock NH3 emissions estimates based on the local statistical yearbooks. NH3 emissions from livestock were based on total ammoniacal nitrogen (TAN) (Beusen et al. Citation2008), and related parameters for estimating the amount of TAN are listed in Table S2. Table S3 shows the NH3 EFs for different livestock. The EFs for yellow cattle and buffalo were referenced from Shen (Citation2014). For livestock with breeding cycles greater than one year, the statistical herd size at the end of the year was used for emission estimates, while for livestock with breeding cycles less than one year, we used the number of slaughters. The proportions of free-range pigs, cattle, poultry, and sheep in Anhui were 10%, 5%, 5% and 50%, respectively (Liu et al. Citation2018). Referring to the latest technical guidelines from the Ministry of Ecology and Environment of the People’s Republic of China (Citation2014), we obtained calculation methods to estimate NH3 emissions from livestock waste.
2.3.2. Farmland ecosystem
Farmland ecosystem sources include N fertilizer application, cropland soil emissions, N-fixing crops and crop residue composting. After the application of N fertilizer, N volatilizes into the atmosphere in the form of NH3, which is an important source of atmospheric NH3 emissions (Zhang et al. Citation2010). N fertilizer types included urea, ammonium bicarbonate, ammonium nitrate, ammonium sulfate, and other nitrogenous fertilizers. The proportions of the different fertilizers used in applications are listed in Table S4. Based on Zhang et al. (Citation2011), we obtained the percentage of nitrogenous fertilizer applied each month in the study area (see Table S5). Affected by the fertilization rate and fertilization mode, the actual EF was corrected on the basis of benchmark EF, as shown in EquationEquation (2)(2)
(2) :
For EquationEquation (2)(2)
(2) , the benchmark EF is shown in Table S6. The soil in Hefei city is alkaline (Wang and Dai Citation2012). The average monthly temperature in Hefei city was obtained from the Anhui Statistical Yearbook (see Table S7). The fertilization rate correction factor, which is related to the N application rate per unit of cultivated land, was 1.18 when the N application rate per unit of cultivated land was greater than 19.5 t km−2 and 1 when the rate was less than 19.5 t km−2. The fertilization method correction factor was 0.32 when fertilizer was applied to the soil and 1.0 when fertilizer was applied on the surface. Due to the limited data on fertilization methods in Hefei city, we referred to the basal and topdressing ratios of rice, wheat, and maize in eastern China (Wang et al. Citation2008).
For other sources of emissions in farmland ecosystems such as agricultural soil, N-fixing crops and crop-residue compost, the calculation methods came from the latest technical guidelines from the Ministry of Ecology and Environment of the People’s Republic of China (Citation2014). NH3 emissions from cropland soil were based on the cultivated area. We calculated the emissions from N-fixing beans and peanuts within their planting area. For crop-residue compost, we used the amount of straw compost to estimate NH3 emissions. The crops in this study included rice, wheat, maize, cotton, beans, peanuts, and canola. The amount of compost was calculated based on EquationEquation (3)(3)
(3) :
where P is the crop yield (units: t) and N is the grass-valley ratio, and the corresponding values are listed in Table S8. f is the composted proportion, which was 42.3% (http://www.ndrc.gov.cn/zcfb/zcfbtz/201612/W020161207332838590161.pdf).
2.3.3. Biomass burning
Biomass burning is the fourth largest source of energy, after coal, oil and natural gas (Cao et al. Citation2005). According to the topography and vegetation in Hefei city, this study estimated the NH3 emissions from the open burning of waste straw, and the amount of burning was determined with EquationEquation (4)(4)
(4) :
where P is the crop yield (units: t), including rice, wheat, maize, cotton, beans, peanuts and canola; N is the grass-valley ratio, which is consistent with the value for straw compost; R is the ratio of open straw burning with an empirical value of 20%; and n is the burning rate, which is 0.9.
In this study, localized EFs in Hefei were used in most livestock and N fertilizer applications to calculate NH3 emissions, but other EFs were adopted from the Ministry of Ecology and Environment of the People’s Republic of China (Citation2014) (see Table S9).
2.4. Temporal and spatial allocation
2.4.1. Temporal distribution
The characteristics of emissions from N fertilizer application are affected by the N application rate, the fertilization mode, and environmental factors. The monthly average temperature can roughly reflect the monthly variation in NH3 emissions from N fertilizer application (Yin Citation2011). The monthly emissions from livestock were mainly due to ambient factors, such as temperature and wind speed (Wang et al. Citation2018b). We calculated the monthly livestock NH3 emissions using the model developed by Adelman and Baek (Shen Citation2014; Liu et al. Citation2018; Wang et al. Citation2018b). Meteorological data (site location, wind speed, and daily temperature) in Hefei were obtained from the Meteorological Station of Nanjing University of Information Science and Technology.
2.4.2. Spatial distribution
Livestock and N fertilizers dominated the spatial distribution of the total emissions, so we used a geographic information system (ArcGIS) to distribute the NH3 emissions from these two sources onto a 1 km × 1 km grid according to land-use data (Yin Citation2011). The 1 km × 1 km land-use data were provided by the Data Center for Resources and Environmental Science, Chinese Academy of Sciences (http://www.resdc.cn). The areas of livestock and poultry farming are mostly concentrated near rural residential areas, and the allocation of NH3 emissions was based on the distribution of rural settlements in each county. NH3 emissions from N fertilizer application sources mostly occurred on cultivated land, and the spatial distribution of NH3 emissions was based on the cultivated land area of each county.
3. Results and discussion
3.1. NH3 emissions inventory and its contribution
3.1.1. NH3 emissions inventory
The NH3 emissions from the agricultural sources in Hefei city in 2017 are displayed in . The NH3 emissions from agricultural sources totaled 27,242.7 t in 2017, of which livestock waste, farmland ecosystems, and biomass burning accounted for 54.5%, 43.7%, and 1.8%, respectively. Livestock was the dominant contributing source of agricultural NH3 emissions, which is consistent with the results in Li et al. (Citation2019) and Wang. et al. (Citation1997) and is mainly due to the large amount of livestock raised in Hefei. N fertilizer application accounted for as much as 85.0% of the farmland ecosystem emissions, which is related to the substantial amount of N fertilizer applied in the area. The NH3 emissions from cropland soil and crop residue compost were similar, accounting for 8.4% and 6.2% of the total emissions in farmland ecosystems, respectively. N-fixing crops accounted for the smallest proportion of the agricultural emission sources.
Table 1. NH3 emissions inventory for agricultural sources in Hefei city in 2017 (units: t).
3.1.2. Characteristics of NH3 emission contributions
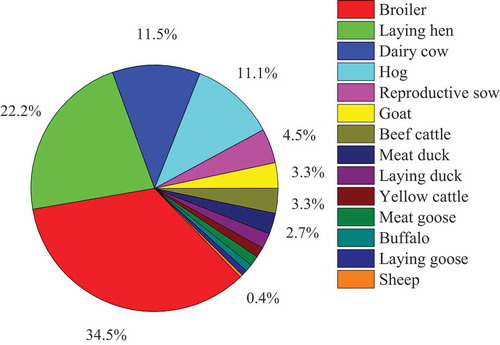
The contributions of NH3 emissions from various livestock are depicted in . A considerable proportion of emissions came from broilers and laying hens, accounting for 34.5% and 22.2% of the total livestock emissions, respectively. This scenario could be attributed to the relatively rapidly increasing consumption of meat and eggs, which has caused an increase in the output of these livestock to satisfy the needs of the human diet. Dairy cows and hogs had similar emission proportions, accounting for approximately 11% of the total livestock NH3 emissions. A hog has a fast feeding cycle that results in numerous slaughters each year. Dairy cows also generated relatively high NH3 emissions, with statistical data showing that the number of dairy cows in Hefei city in 2017 was approximately 31 688, which was relatively high compared to the number of other cows. In contrast, the smaller emission contributions from other large animals, such as beef cattle, yellow cattle and buffalo, were mainly due to the lower levels of activity. Other livestock (e.g. sows, meat ducks, egg ducks, meat geese and egg geese) had low NH3 emissions because of their low numbers and annual average N excretion.
Figure 2. Contribution of NH3 emissions from various types of livestock in 2017 in Hefei city.
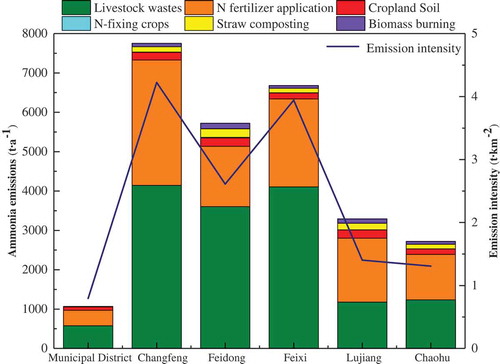
The agricultural NH3 emission contributions and emissions intensity from various sources in each county are described in . Changfeng County was the largest contributor to NH3 emissions, reaching 7753.3 t in 2017 and contributing 28.5% of the total emissions. Followed by Changfeng, the emissions of Feixi and Feidong contributed 24.5% and 21% of the total emissions, respectively. The above three counties had relatively high NH3 emissions because of their developed livestock industries, large sowing areas and substantial N application areas. However, the NH3 emissions in Lujiang and Chaohu were relatively low, accounting for approximately 10% of the total emissions. The municipal districts with the lowest NH3 emissions accounted for only 4.0% of the total emissions, which was relative to the small scale and output of agriculture in this region. The emissions intensity of NH3 was the highest in Changfeng County, as high as 4.2 t km−2 in 2017, followed by that in Feixi and Feidong counties. Overall, the average NH3 emissions intensity for the agricultural sources in Hefei in 2017 was 2.4 t km−2.
Figure 3. Characteristics of NH3 emissions and emissions intensity in Hefei city in 2017.

3.2. Temporal and spatial characteristics of NH3 emissions
3.2.1. Temporal distribution
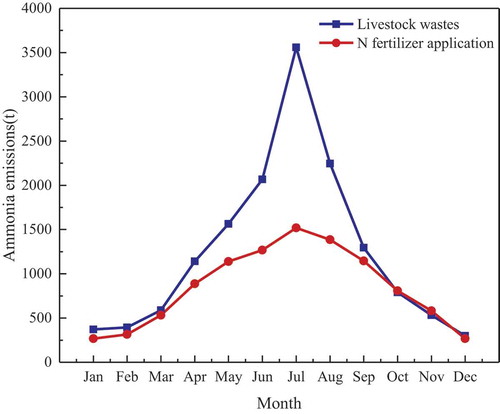
As depicted in , an obvious monthly variation in the NH3 emissions was found from livestock waste and N fertilizer. The highest NH3 emissions occurred in summer, with annual emissions from livestock waste and N fertilizer application. The monthly NH3 emissions variation from livestock waste showed a similar trend with the temperature change. With the increase in temperature, NH3 emissions from livestock waste increased, reaching a maximum of 3558.81 t in summer and decreasing to a minimum of less than 400 t in winter. These results mainly depend on the temperature. The monthly N fertilizer application emissions were affected by weather conditions and cultivation methods. The winter wheat–summer rice rotation system is a common farming practice in Hefei. NH3 volatilization began to increase with spring sowing and fertilizer application in March. The higher summer emissions, up to 1519.45 t, were mostly due to the application of tiller fertilizer to rice in June and the basal dressing to late rice in July. At the end of September and early October, substantial crop harvesting begins, and winter wheat is sown with basal fertilizer. Despite fertilizer was applied in October, NH3 emissions in October were still lower than in summer due to lower temperature.
Figure 4. Time series of NH3 emissions from agricultural sources in Hefei city in 2017.
3.2.2. Spatial distribution
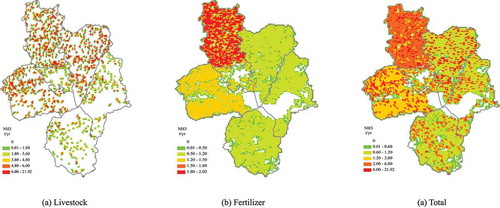
The 1 km × 1 km gridded NH3 emissions in Hefei are illustrated in for the spatial distribution of emissions from livestock and N fertilizers. The majority of emissions of livestock () were concentrated in Feixi, Changfeng, and Feidong, reaching 2.4, 2.3, and 1.6 t km−2, respectively. This result was mainly attributed to dense rural residential areas and numerous intensive livestock farms. Due to the large cultivated land area and substantial N application, the high NH3 emissions from N fertilizer application () occurred in Changfeng and Feixi with an emissions intensity of 1.7 and 1.3 t km−2, respectively. Generally, the distribution of agricultural sources () showed high emissions in the northern area of Hefei due to the high population density, the large area of arable land, and the high levels of agricultural activity. The counties of Changfeng and Feixi were the largest NH3 emitters, which was attributed to the frequent agricultural activities. The relatively high NH3 emissions in Feidong County were due to the large amount of livestock.
Figure 5. Spatial distribution of NH3 emissions from agricultural sources in Hefei city in 2017.
3.3. Evaluation of the NH3 emissions inventory
3.3.1. Comparison with previous studies
This study provides a detailed description of NH3 emissions from agricultural sources in Hefei in 2017. The NH3 emissions in different regions are compared and listed in . The amount of NH3 emissions from livestock and fertilizer accounted for almost 90% of the total emissions from agricultural sources, which was consistent with most of research results (Huang et al. Citation2012). We also compared the estimated results of this study with those for cities in the Yangtze River Delta and found that the NH3 emissions in Hefei were higher than those in Nanjing (Liu and Yang Citation2015), Suzhou (Zhou et al. Citation2016) and Hangzhou (Yu et al. Citation2016) due to the large amount of livestock and applied fertilizer. In addition, the alkaline soil in Hefei leads to a larger EF for N fertilizer applications, increasing the estimated values. However, compared with Shanghai (Dong et al. Citation2009), Hefei had little activity-level data for agricultural sources, resulting in relatively low NH3 emissions.
Table 2. Agricultural NH3 emissions in different regions (units: kt).
3.3.2. Uncertainty analysis
There are many uncertainties in emission estimations that affect the inventory accuracy, mainly due to the lack of activity data and EFs (Zhong et al. Citation2007). The activity-level data in this study were obtained from statistics from government departments, which ensured the reliability of the data. Moreover, we distinguished between intensive and free-range livestock. For N fertilizer application, we considered a number of parameters, such as the soil pH, weather conditions, and application method. Therefore, the uncertainty related to livestock waste and fertilization application was relatively low. In summary, the activity-level data and EFs used in this inventory are reliable. Therefore, the NH3 emissions from agricultural sources in Hefei city are comparable to those in other regions, and the established emissions inventory is rational and can reflect the actual emissions of agricultural NH3 in Hefei city to a certain extent.
4. Conclusions
In this study, we established an accurate 2017 NH3 emissions inventory for agricultural sources with a spatial resolution of 1 km × 1 km in Hefei based on specific activity-level data and the latest county-level EFs. Three main sources were considered: livestock waste management, farmland ecosystems, and biomass burning. The NH3 emissions totaled approximately 2722.7 t yr−1, to which livestock was the top contributor, accounting for 54.5%. Among livestock waste management, broilers and laying hens were the largest sources of emissions, accounting for 34.5% and 22.2% of the total NH3 emissions from livestock, respectively. Dairy cows and hogs were the next largest sources of emissions.
The highest agricultural NH3 emissions and emissions intensity was in Changfeng County, where the emissions and emissions density were as high as 7753.3 t and 4.2 t km−2 in 2017, respectively. The lowest emissions were in Hefei city, with annual emissions of only 1071.0 t and an emissions intensity of approximately 0.8 t km−2 in 2017. The average emissions intensity in Hefei in 2017 was 2.4 t km−2. Obvious seasonal variability was observed, with the highest emissions in July and the lowest emissions at the beginning and end of the year, associated with meteorological conditions and local agricultural practices. Simultaneously, the areas with higher emission intensities were mainly in northern Hefei, mainly attributed to the dense population and developed agriculture.
Supplemental Material
Download PDF (102.7 KB)Disclosure statement
No potential conflict of interest was reported by the authors.
Supplementary material
Supplemental data for this article can be accessed here.
Additional information
Funding
References
- Battye, W., V. P. Aneja, and P. A. Roelle. 2003. “Evaluation and Improvement of Ammonia Emissions Inventories.” Atmospheric Environment.” Atmospheric Environment 37 (27): 3873–3883. doi:10.1016/S1352-2310(03)00343-1.
- Beusen, A. H. W., A. F. Bouwman, P. S. C. Heuberger, G. Van Drecht, and K. W. Van Der Hoek. 2008. “Bottom-up Uncertainty Estimates of Global Ammonia Emissions from Global Agricultural Production Systems.” Atmospheric Environment 42 (24): 6067–6077. doi:10.1016/j.atmosenv.2008.03.044.
- Cao, G. L., X. Y. Zhang, D. Wang, and F. C. Zhang. 2005. “Inventory of Atmospheric Pollutants Discharged from Biomass Burning in China Continent.” China Environmental Science 25 (4): 389–393. doi:10.3321/j.issn:1000-6923.2005.04.002.
- Dong, Y. Q., C. H. Chen, C. Huang, H. L. Wang, L. Li, P. Dai, and J. H. Jia. 2009. “Anthropogenic Emissions and Distribution of Ammonia over the Yangtze River Delta.” Acta Scientiae Circumstantiae 29 (8): 1611–1617. doi:10.13671/j.hjkxxb.2009.08.012.
- Galloway, J. N., Z. Dianwu, V. E. Thomson, and L. H. Chang. 1996. “Nitrogen Mobilization in the United States of America and the People’s Republic of China.” Atmospheric Environment 30 (1011): 1551–1561. doi:10.1016/1352-2310(95)00456-4.
- Goebes, M. D., R. Strader, and C. Davidson. 2003. “An Ammonia Emission Inventory for Fertilizer Application in the United States.” Atmospheric Environment 37 (18): 2539–2550. doi:10.1016/s1352-2310(03)00129-8.
- Hamaoui-Laguel, L., F. Meleux, M. Beekmann, B. Bessagnet, S. Génermont, P. Cellier, and L. Létinois. 2014. “Improving Ammonia Emissions in Air Quality Modelling for France.” Atmospheric Environment 92 (13): 584–595. doi:10.1016/j.atmosenv.2012.08.002.
- Hou, X. H., X. N. Yu, L. Shen, R. D. Zhao, G. Z. Wang, and Y. X. Zhang. 2019. “Establishment and Characteristics of an Artificial Ammonia Emissions Inventory in Jiangsu Province from 2013 to 2017.” Environmental Science 40 (11): 4862–4869. doi:10.13227/j.hjkx.201904129.
- Huang, X., Y. Song, M. M. Li, J. F. Li, H. Qing, X. H. Cai, T. Zhu, M. Hu, and H. S. Zhang. 2012. “A High-resolution Ammonia Emission Inventory in China.” Global Biogeochemical Cycles 26 (1): GB1030. doi:10.1029/2011GB004161.
- Li, S. X., W. K. Guo, X. He, Y. F. Yu, and Q. Cheng. 2019. “Inventory and Spatiotemporal Distribution of Ammonia Emission from Agriculture and Animal Husbandry in Lanzhou City.” Environmental Science 40 (3): 1172–1178. doi:10.13227/j.hjkx.201807190.
- Lin, Y., L. Duan, Y. S. Yang, D. W. Zhao, D. B. Zhang, and J. M. Hao. 2007. “Contribution of Simulated Nitrogen Deposition to Forest Soil Acidification in Area with High Sulfur Deposition.” Environmental Science 28 (3): 640–646. doi:10.13227/j.hjkx.2007.03.035.
- Liu, B., Y. Tong, A. Li, W. Du, Y. J. Han, Y. Gao, J. Q. Fan, W. J. Li, and W. L. Wang. 2018. “Study on Ammonia Emission Inventory of Livestock over Yangtze River Delta.” Journal of Ecology and Rural Environment 34 (11): 1042–1049. doi:10.11934/j.issn.1673-4831.2018.11.012.
- Liu, C. L., and F. Yang. 2015. “Nanjing Anthropogenic Ammonia Emission Inventory and Its Characteristics in 2013.” Journal of Anhui Agricultural Sciences 43 (29): 263–266. doi:10.13989/j.cnki.0517-6611.2015.29.089.
- Ministry of Ecology and Environment of the People’s Republic of China. 2014. “Technical Guidelines for Preparation of Atmospheric Ammonia Emission Inventory (For Trial Implementation).” Accessed 19 August 2014. http://www.mee.gov.cn/gkml/hbb/bgg/201408/W020140828351293771578.pdf
- Shen, L., X. N. Yu, and L. Xiang. 2018. “Estimation of Ammonia Emissions Inventories in Jiangsu Province from 2006 to 2014.” China Environmental Science 38 (1): 26–34. doi:10.19674/j.cnki.1000-6923.2018.0003.
- Shen, X. L. 2014. “A Highly Resolved Anthropogenic Ammonia Emission Inventory in Guangdong Province and Assessment of Control Strategies.” Master thesis., South China University of Technology, Guangzhou, China (in Chinese).
- Shen, X. L., S. S. Yin, J. Y. Zheng, Q. Liu, and L. J. Zhong. 2014. “Anthropogenic Ammonia Emission Inventory and Its Mitigation Potential in Guangdong Province.” Acta Scientiae Circumstantiae 34 (1): 43–53. doi:10.13671/j.hjkxxb.2014.01.024.
- Su, H., D. J. Yan, X. M. Huang, W. B. Song, H. Q. Wang, and X. J. Song. 2016. “Inventory and Characteristics of Anthropogenic Ammonia Emission in Xi’an.” Environmental Science 37 (11): 4117–4123. doi:10.13227/j.hjkx.201605127.
- Wang, H. J., B. Zhang, H. Hu, and Y. J. Zhang. 2018a. “Evolution Characteristics and Spatial-Temporal Pattern of Air Pollutants in Anhui Province.” Research of Environmental Sciences 31 (4): 628–641. doi:10.13198/j.issn.1001-6929.2017.04.18.
- Wang, J. Q., W. Q. Ma, R. F. Jiang, and F. S. Zhang. 2008. “Analysis about Amount and Ratio of Basal Fertilizer and Topdressing Fertilizer on Rice, Wheat, Maize in China.” Chinese Journal of Soil Science 39 (2): 329–333. doi:10.3321/j.issn:0564-3945.2008.02.024.
- Wang, S., S. S. Yin, L. Bai, X. C. Zhang, X. K. Gu, H. Zhang, Q. Lu, and R. Q. Zhang. 2018b. “High-resolution Ammonia Emission Inventories with Comprehensive Analysis and Evaluation in Henan, China, 2006–2016.” Atmospheric Environment 193: 11–23. doi:10.1016/j.atmosenv.2018.08.063.
- Wang, W. J., and W. H. Dai. 2012. “Study on Soil pH and Acidic Buffering Properties in Anhui Province.” Chinese Agricultural Science Bulletin 28 (5): 67–72. doi:10.3969/j.issn.1000-6850.2012.15.014.
- Wang, Z. M., J. Q. Wang, and S. H. Hu. 2018c. “Study on Motor Vehicle Exhaust Emission Characteristics and Contribution Rates in Hefei City.” Journal of Hefei University of Technology(Natural Science) 41 (4): 539–544. doi:10.3969/j.issn.1003-5060.2018.04.020.
- Wang., W. X., X. F. Lu, Y. B. Pang, D. G. Tang, and W. H. Zhang. 1997. “Geographical Distribution of NH3 Emission Intensities in China.” Acta Scientiae Circumstantiae 17 (1): 3–8. doi:10.13671/j.hjkxxb.1997.01.002.
- Yang, Z. P. 2008. “Estimation of Ammonia Emission from Livestock in China Based on Mass-flow Method and Regional Comparison.” Master thesis, Peking University.
- Yin, S. S. 2011. “Study on Anthropogenic Ammonia Emission Inventory in the Pearl River Delta and Effects on Source Contribution to Particulate Matter Formation.” Master thesis, South China University of Technology, Guangzhou, China. (in Chinese).
- Yin, S. S., J. Y. Zhen, L. J. Zhang, and L. J. Zhong. 2010. “Anthropogenic Ammonia Emission Inventory and Characteristics in the Pearl River Delta Region.” Environmental Science 31 (5): 1146–1151. doi:10.13227/j.hjkx.2010.05.037.
- Yu, F. X., N. Chao, J. Wu, G. Q. Tang, G. S. Chen, H. Q. Wang, and Z. B. Wu. 2016. “Research on Agricultural Ammonia Emission Inventory of Zhejiang Province in 2013.” Environmental Pollution & Control 38 (10): 41–46. doi:10.15985/j.cnki.1001-3865.2016.10.008.
- Zhang, T., 2012. “The Study on Greenhouse Gas Emission from the Municipal Solid Waste Treatment and Strategy for Emission Reduction in Hefei.” Master thesis, Hefei University of Technology, Anhui, China. (in Chinese).
- Zhang, Y., A. J. Dore, L. Ma, X. J. Liu, W. Q. Ma, J. N. Cape, and F. S. Zhang. 2010. “Agricultural Ammonia Emissions Inventory and Spatial Distribution in the North China Plain.” Environmental Pollution 158 (2): 490–501. doi:10.1016/j.envpol.2009.08.033.
- Zhang, Y. S., S. J. Luan, L. L. Chen, and S. Min. 2011. “Estimating the Volatilization of Ammonia from Synthetic Nitrogenous Fertilizers Used in China.” Journal of Environmental Management 92 (3): 480–493. doi:10.1016/j.jenvman.2010.09.018.
- Zhong, L. J., J. Y. Zheng, G. Q. Lei, and J. Chen. 2007. “Quantitative Uncertainty Analysis in Air Pollutant Emission Inventories: Methodology and Case Study.” Research of Environmental Sciences 20 (4): 15–20. doi:10.13198/j.res.2007.04.19.zhonglj.004.
- Zhou, J., S. H. Liu, Y. Tan, F. Y. Qian, Y. Liang, and J. Wu. 2016. “Anthropogenic Ammonia Emission Inventory and Its Spatial Distribution in Suzhou City.” Research of Environmental Sciences 29 (8): 1137–1144. doi:10.13198/j.issn.1001-6929.2016.08.05.