
 ?Mathematical formulae have been encoded as MathML and are displayed in this HTML version using MathJax in order to improve their display. Uncheck the box to turn MathJax off. This feature requires Javascript. Click on a formula to zoom.
ABSTRACT
As the strongest typhoon in 2015, the rapid intensification (RI) process of Typhoon Mujigae is simulated at the cloud-resolving scale by utilizing the Weather Research and Forecasting model, coupled with observed sea surface temperature (SST) and reduced SST as the control and sensitivity experiments, respectively. The spatiotemporal distribution characteristics of upper-tropospheric potential vorticity (PV) and its response to SST changes are analyzed simultaneously. The results show a significant upper-tropospheric PV anomaly 6 h before RI, which indicates the approaching RI of Typhoon Mujigae. Deep convection overlies the strong signals of upper-tropospheric PV anomalies. More insight into the PV budget analysis verifies that the diabatic heating effect and vertical advection terms associated with deep convection dominate the upper-tropospheric PV anomaly, inferring that deep convection plays a crucial role in the upper-tropospheric PV anomaly. As SST decreases, diabatic heating and vertical advection effects are weakened due to reduced deep convection; therefore, the PV anomaly in the model run is not stronger than that in the control run, and the RI process of Mujigae disappears. Therefore, from the viewpoint of upper and lower-level interactions, how SST impacts upper-tropospheric PV anomalies and their interactions with RI are clarified. Thus, in addition to SST, the upper-tropospheric PV anomaly might be a significant factor in differentiating between RI and non-RI tropical cyclones.
GRAPHICAL ABSTRACT

摘要利用数值模拟, 研究了台风‘彩虹’快速增强 (RI) 前的高层位涡异常及其对海温改变的响应。发现 RI前6小时高对流层位涡异常显著, 伴随深对流的发展, 对RI有一定预示作用。位涡收支分析表明, 与深对流相关的非绝热加热项和垂直输送项是高层位涡异常的主要原因; 降低海温的数值模拟进一步验证了深对流对高层位涡异常的关键作用。本文从高低层相互作用的视角, 阐明除了海温, 高层位涡异常也成为区分RI与非RI热带气旋的重要因素之一。
1. Introduction
Although the track forecasting of tropical cyclones (TCs) has been improved dramatically in the past two decades, intensity prediction remains a great challenge, especially for rapidly intensifying TCs (DeMaria et al. Citation2014). The sudden change in the intensity of a TC is rather difficult to predict and easily leads to serious meteorological disasters, including strong winds, heavy precipitation, and flooding (Rappaport et al. Citation2009). These findings highlight the necessity to study the rapid intensification (RI) process of TCs.
Kaplan and DeMaria (Citation2003) defined RI as an increase in the maximum sustained 10 m wind speed (MSW) of at least 30 kt in the following 24 h. This criterion has been widely used (Rogers Citation2010; Chen and Zhang Citation2013; Wang and Wang Citation2014; Chen et al. Citation2017; Chen, Xue, and Fang Citation2018). Based on the RI definition, many favorable environmental conditions for RI, such as high ocean heat content, warm sea surface temperature (SST), low vertical wind shear (VWS), high relative humidity in the lower troposphere, and strong upper-tropospheric outflow, have been investigated and identified (Kaplan and DeMaria Citation2003; Lin et al. Citation2008). However, Hendricks et al. (Citation2010), using a global dataset, found that these environmental conditions were sufficient, but not necessary, for the RI of TCs. Meanwhile, they considered that the convective activity of internal processes might be the main reason for the RI of TCs.
Observational studies show that inner-core convective activity has an important influence on the process of RI (Guimond, Heymsfield, and Turk Citation2010; Molinari and Vollaro Citation2010; Nguyen and Molinari Citation2012; Rogers and Zhang Citation2015). For instance, Guimond, Heymsfield, and Turk (Citation2010) diagnosed Hurricane Dennis (2005) on the basis of NASA Tropical Cloud Systems and Processes test data and found that deep convection (>20 m s−1) extended up to 16 km high and that inflow from the top of the convective cloud extended toward the TC center. High-resolution numerical simulations have also confirmed the significance of inner-core convective activity in the process of RI (Rogers Citation2010; Zhang and Chen Citation2012; Chen and Zhang Citation2013; Wang and Wang Citation2014; Kanada and Wada Citation2015; Harnos and Nesbitt Citation2016; Hazelton, Hart, and Rogers Citation2017; Chang and Wu Citation2017; Chen, Xue, and Fang Citation2018). Zhang and Chen (Citation2012) examined Hurricane Wilma (2005) using the WRF model and found that deep convection within the eyewall transported the warm and moist atmosphere into the stratosphere and that its outflow sunk into the mid-upper troposphere to form a warm-core structure, which was conducive to the RI of Wilma.
In addition, the anomaly of the upper-tropospheric potential vorticity (PV) is also an effective indicator for the RI of a TC. For example, Rogers (Citation2010) and Miyamoto and Takemi (Citation2013) considered the increased PV and the following axisymmetric vortex structure that identified signals to determine whether a TC is undergoing RI. The upper-tropospheric PV anomaly near the TC could come from high-latitude high PV reservoirs or stratospheric origin regions by synoptic-scale PV advection through the upper-tropospheric trough before RI (Bosart et al. Citation2000; Ventham and Wang Citation2007). However, for the Typhoon Mujigae case, there is an upper-tropospheric PV anomaly at 6 h prior to RI, which has been proven to be growing in isolation instead of developing by synoptic-scale environmental PV advection in our previous study (Tang et al. Citation2018).
To further understand the features and attributions of the upper-tropospheric PV anomaly before and during the RI process, we choose Typhoon Mujigae as an example to perform numerical simulations and sensitivity experiments utilizing the WRF model in this study. The objectives are (i) to examine the spatiotemporal evolutions of the upper-tropospheric PV anomalies and their responses to SST change before RI and (ii) to elucidate the effect of deep convection on the upper-tropospheric PV anomaly and further explore the attributions to the upper-tropospheric PV anomaly. The model settings and experimental design are described in section 2. Section 3 illustrates the results from both the control and sensitivity experiments. The characteristics and attributions of the upper-tropospheric PV anomaly for rapidly intensifying Typhoon Mujigae are analyzed in detail. The major conclusions of this study are summarized in the last section.
2. Case description and model configuration
2.1. Case description
As the strongest typhoon that occurred in the West Northwest Pacific in 2015, Mujigae intensified from 28.0 m s−1 at 0600 UTC 3 October to 43.5 m s−1 at 0000 UTC 4 October (see the MSW of the Japan Meteorological Agency (JMA) in )) and experienced the RI process. Six hours later, the typhoon made landfall in Zhanjiang, Guangdong Province, causing numerous fatalities and economic impacts (Tang et al. Citation2018).
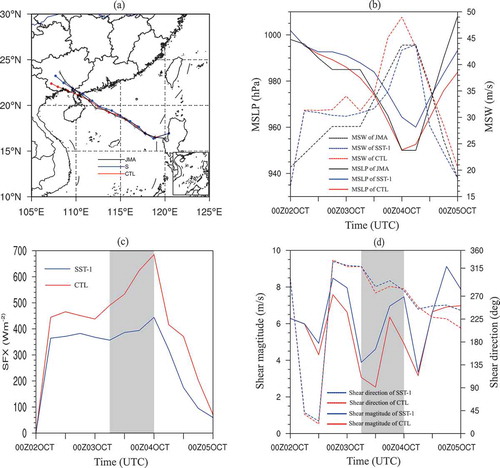
Figure 1. (a) The observed (black) and simulated (red/blue for control/sensitivity experiments) tracks. (b) The observed (black) and simulated (red/blue for control/sensitivity experiments) MSLPs (solid, hPa) and MSWs (dashed, m s−1), (c) surface heat fluxes (W m−2) averaged within a 100 km radius from the TC center, and (d) 850–200-hPa wind shear magnitude (solid line) and direction (dashed line) in a 600-km box centered on the TC. The SST-1 and CTL experiments are denoted by blue and red lines in each panel, respectively. The gray shading indicates the RI period.
2.2. Model configuration
In this study, we perform a 72-h numerical simulation by the Advanced Research Weather Research and Forecasting (WRF-ARW, version 3.7.1) model. Three domains are configured with horizontal resolutions of 18, 6, and 2 km, consisting of 253202, 415
415, 253
253 grid points, respectively. The 18-km and 6-km domains are fixed, whereas the innermost domain moves with the modeled TC (see Figure S1 in Supplementary Materials). Vertical grid meshes include 35 levels in the terrain-following coordinate from the surface to 50 hPa level. In the control experiment (CTL), GFS reanalysis data with a 0.5° × 0.5° horizontal resolution and NOAA’s SST with a 1°×1° horizontal resolution are utilized as the boundary conditions and initial field, respectively. Additionally, a set of sensitivity tests is conducted to test how reduced SST and associated changes in heat flux impact convection and further affect upper-tropospheric PV anomalies, in which SSTs are reduced by 1°C at every ocean point (SST-1). Details of the model’s physics schemes and parameter configuration are provided in .
Table 1. Configuration of parameters in WRF model.
3. Results
3.1. Track and intensity
The numerical model in the CTL experiment successfully reproduces the track and intensity evolution of Typhoon Mujigae (). The intensification rate of Mujigae began to increase at 0600 UTC 03 October, and the MSW increased from 32 m s−1 to 49 m s−1 within 18 h ()), meeting the condition of RI (Kaplan and DeMaria Citation2003). Therefore, 0600 UTC 03 October was identified as the time of RI onset for Mujigae. Compared to the simulated track and intensity in the CTL experiment, varied SST in the SST-1 experiment has little influence on the moving track of Mujigae but significantly affects the intensity change of Mujigae. The minimum surface level pressure (MSLP) rose from 950 hPa in the CTL experiment to 960 hPa, and the MSW was only 44 m s−1, which no longer was consistent with the condition of RI. It seems that reduced SST could determine whether RI occurs.
3.2. Sea surface temperature and vertical wind shear
) shows the surface heat flux (SFX) averaged within areas with a radius R = 100 km for both the CTL and S simulations. The SFX difference between the two experiments is approximately 100 W s−2 before 00 UTC 3 October, with an intense increase afterwards just prior to RI and even reaching 240 W s−2 during the RI process. ) shows the time series of the 200–850 hPa VWS within a 600-km box centered on the TC. The magnitude of the VWS is less than 8 m s−1, and the direction of the VWS is basically maintained at 270° starting at 1800 UTC 02 October (12 h before RI). This kind of pattern in which the VWS maintains a certain orientation is conducive to the RI of a TC (Molinari et al. Citation2006). In experiment SST-1, the direction of the VWS was basically the same as that of the CTL run, and the magnitude of the VWS was slightly larger than that in the CTL simulation, maintaining at less than 9 m s−1. VWS below 10–12 m s−1 is not detrimental to the development of the TC (Elsberry and Jeffries Citation1996; Shu, Wang., and Bai Citation2013). Therefore, VWS due to SST decrease has little impact on the RI of the TC. The reduced SST decreases the upward heat flux, which is unfavorable for RI occurrence.
3.3. Convective structures of Typhoon Mujigae
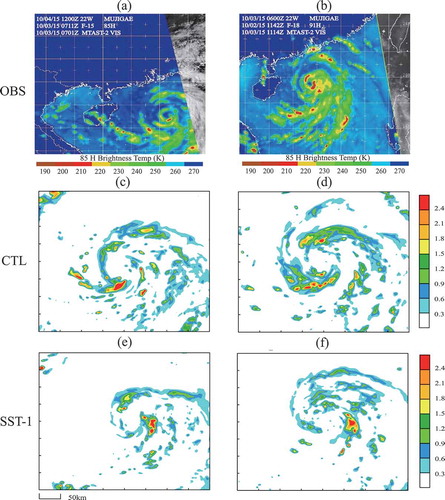
Verification of the TC structure is difficult because few ocean observations are available. In this study, the 85 GHz microwave image of the cloud-top brightness temperature observed by the TRMM satellite is utilized for comparison with the average ice phase (ice, snow, and graupel) mixing ratio at the 8–10 km altitude output by the CTL and SST-1 experiments (). Although the ice phase particle mixing ratio does not directly represent satellite microwave images, it can approximately reflect the structure of TC convection and precipitation (Hazelton, Hart, and Rogers Citation2017). At the onset of RI (), 85 GHz microwave images show multiple eye walls, manifesting a closing trend. During RI (), inner-core convection developed vigorously and presented a closed structure accompanied by a strong convective belt on the north side of Typhoon Mujigae. For the experiment CTL, the convection and precipitation structures of the ice phase particle mixing ratio are basically consistent with those of the satellite image (–)). Comparatively, the convection and precipitation of the TC in the SST-1 experiment are significantly reduced, which is mainly due to the weakened SFX induced by a decrease in SST (Chen, Xue, and Fang Citation2018).
Figure 2. Observed 85-GHz microwave image of Typhoon Mujigae (a) at 0600 UTC and (b) at 1200 UTC 3 October 2015. (c–d) the simulated (CTL) maximum ice-phase mixing ratio (g kg−1) at heights of 8–10 km. The times are the same as in (a–b). (c–f) As in (c–d) but for the SST-1 experiment.
3.4. Upper-tropospheric PV anomaly
To check whether there is an upper-tropospheric PV anomaly before the RI of Mujigae, we give the horizontal distributions of the mean (10–15 km) high-level PV before RI (). At –12 h relative to RI onset ()), the PV is mainly concentrated in the southeast quadrant of the typhoon circulation. After 3 h ()), the upper-tropospheric PV developed in the northeast quadrant by cyclonic advection. At –6 h relative to the RI onset ()), the PV gradually moves into the entire inner-core region, with its maximum value exceeding 16 PVU at R = 60–80 km. Subsequently, from –3 h (,e)), the upper-tropospheric PV is weakened somewhat, and the large-value PV is basically located within a radius of 40 km.
Figure 3. The averaged upper-tropospheric potential vorticity (PVU) at z = 10–15 km, horizontal wind vectors at z = 2 km and deep convection (black crosses) for the CTL simulation (left panel) at (a) 1800 UTC, (b) 2100 UTC 2 Ocotober, (c) 0000 UTC, (d) 0300 UTC, and (e) 0600 UTC 3 October. (f–j) As in (a–e) but for the SST-1 experiment (right panel).

Interestingly, the deep convection linked with the upper-tropospheric PV anomaly experiences a similar evolution as PV, i.e., an increase before –6 h then a slight decrease. Furthermore, deep convection overlies the strong signals of the PV anomalies. Note that the deep convection plotted in is defined as the vertical velocity at an altitude of 11 km being greater than 7.5 m s−1 (Wang and Wang Citation2014)), thereby ensuring that this kind of deep convection could move upwards and be closely tied to the upper-tropospheric PV anomaly. We also give the results of SST-1 in the same time period (–)). The upper-tropospheric PV also presents a gradual increasing trend. However, the amount of deep convection is largely reduced due to decreased heat flux ()), which weakens the deep convection activities of the TC (Chen, Xue, and Fang Citation2018). Correspondingly, the associated upper-tropospheric PV anomaly is weakened, and the TC does not present explosive growth compared to that of the CTL experiment.
3.5. More insight into the PV budget
We now quantitatively evaluate the role of deep convection on upper-tropospheric PV growth before and during RI by utilizing the PV budget analysis. Based on the PV tendency equation (Wu, Wu, and Wei Citation2016), the PV tendency is determined by horizontal advection (HA), vertical advection (VA), the diabatic heating effect (DH), and the friction term (FR). The FR term is ignored herein because of its smaller magnitude relative to the other three terms. For a more detailed explanation of the equation, please refer to Equation (1) in Wu, Wu, and Wei (Citation2016).
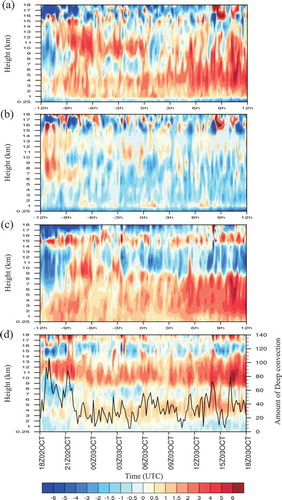
shows the time-height series of the PV budget terms within the inner-core region from the CTL experiment. The PV tendency shows a large anomaly in the upper and middle troposphere from –9 h to –4 h before RI, exceeding 4 PVU hr−1 ()), which provides a clue for the approaching RI of Mujigae. This large upper-tropospheric PV anomaly is dominated by diabatic heating ()) and vertical advection ()), while the horizontal advection term is too small to be considered ()), suggesting that the VA and DH terms play a critical role in the upper-tropospheric PV anomaly. For instance, the large value of the DH term mainly occurs at z = 7–10 km prior to RI ()), and the large value of the VA term mainly occurs in the upper troposphere (10–15 km), reaching its maximum value at –6 h before RI. These strong DH and VA terms are closely related to the explosive growth in deep convection (see the black curve in )). Deep convection plays a role in the DH term via latent heat release through vertically upward moisture transport and acts on the VA term via directly upward PV advection. Accompanying the weakening deep convection starting at –3 h ()), DH transfers to the lower level ()). Although there is a positive VA value above the 10 km height, the net effect after cancellation between the positive VA and negative DH largely weakens the upper-tropospheric PV anomaly, which results in the lower-level PV anomaly concentrated at z = 2–6 km during RI ()). The results of the sensitivity test () further verify the above argument. As SST decreases (see the results of SST-1 in ), the DH and VA effects () are weakened due to reduced deep convection (); therefore, the PV anomaly in the model is not stronger than that in the CTL run (cf. and ), and the RI process of Mujigae disappears ().
Figure 4. Time–height series of the potential vorticity budget (PVU h−1) from −12 h to 12 h relative to the RI onset for the CTL experiment. (a) PV tendency; (b) HA term; (c) DH term; (d) VA term. The black line superposed in (d) denotes the amount of deep convection.
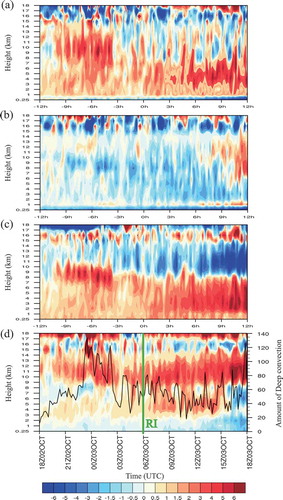
Figure 5. Time–height series of the potential vorticity budget (PVU h−1) from −12 h to 12 h relative to the RI onset for the SST-1 run. (a) PV tendency; (b) HA term; (c) DH term; (d) VA term. The black line superposed in (d) denotes the amount of deep convection.
From the above analyses, the upper-tropospheric PV anomaly has a close relationship with deep convection during Typhoon Mujigae. To further explore their relationship, we examine the configuration between upper-tropospheric PV and deep convection (Figures S2 and S3). Figure S2 gives the distributions of deep convection and the VA term at the z = 10–15 km altitude, which are the dominant factors affecting the PV anomaly ( and ). The strong VA term includes dense, deep convection elements (Figure S2). The fact that deep convection occurs within the regions of enhanced VA supports that deep convection can increase PV anomalies by vertical advection through the VA term. Figure S3 shows the vertical structures of the VA and deep convection at 0300 UTC 3 October. The VA peak (80 PVU hr−1) occurred 15–30 km from the center of the TC circulation and was overlaid by intense deep convection, further demonstrating that deep convection contributes to the upper-troposphere PV anomaly by the VA term. Thus, through the VA effect, the linkage between deep convection and the PV anomaly is strengthened. The combined effect of deep convection, the VA term, and the upper-tropospheric PV indicates that vertical transport through deep convection was an important cause of upper-tropospheric PV anomalies during Typhoon Mujigae.
4. Conclusion
In this study, the WRF-ARW model was utilized to simulate the RI process of Typhoon Mujigae in 2015 to investigate the upper-tropospheric PV anomaly prior to RI. It is demonstrated that the WRF model reasonably reproduces the track, intensity and RI process, as verified when compared with various observations. On this basis, the evolution characteristics of the upper-tropospheric PV anomalies within the inner-core region before RI are analyzed. Simultaneously, how the PV anomaly and RI respond to SST change is explored. The possible causes of upper-tropospheric PV anomalies are discussed, and the following conclusions are drawn.
The spatiotemporal distribution characteristics of upper-tropospheric PV are investigated for the rapidly intensifying Mujigae. An isolated PV column develops vertically near the TC. The upper-tropospheric PV manifests a strong anomaly before RI at – 9 h to – 4 h relative to the RI onset, which provides a clue for the approaching RI of Typhoon Mujigae.
As SST decreases, the PV anomaly of the model is not stronger than that in the CTL run, and the RI process of Mujigae disappears. Thus, the upper-tropospheric PV anomaly might be a significant factor in differentiating between RI and non-RI TCs.
The attributions of the upper-tropospheric PV anomaly and its changes due to reduced SSTs are explored by the PV budget. Deep convection overlies the strong signals of upper-tropospheric PV anomalies. The combined effect of deep convection and upper-tropospheric PV indicates that vertical transport through deep convection may be an important cause of upper-tropospheric PV anomalies. More insight into the PV budget analysis verifies that the diabatic heating effect and vertical advection terms associated with deep convection dominate the upper-tropospheric PV anomaly. In an additional sensitivity experiment, the DH and VA effects are weakened due to reduced deep convection, accounting for the decrease in PV anomaly. The following absence of RI supports the above viewpoint in terms of the significance of the upper-tropospheric PV anomaly, indicating the RI of TC.
Supplemental Material
Download PDF (665.1 KB)Acknowledgments
The valuable comments of the two anonymous reviewers, which helped considerably in improving the original manuscript, are greatly appreciated.
Disclosure statement
No potential conflict of interest was reported by the authors.
Supplementary material
Supplemental data for this article can be accessed here.
Additional information
Funding
References
- Bosart, L. F., C. S. Velden, W. E. Bracken, J. Molinari, and P. G. Black. 2000. “Environmental Influences on the Rapid Intensification of Hurricane Opal (1995) over the Gulf of Mexico.” Monthly Weather Review 128 (2): 322–352. doi:10.1175/1520-0493(2000)128<0322:EIOTRI>2.0.CO;2.
- Chang, C. C., and C. C. Wu. 2017. “On the Processes Leading to the Rapid Intensification of Typhoon Megi (2010).” Journal of the Atmospheric Sciences 74 (4): 1169–1199. doi:10.1175/JAS-D-16-0075.1.
- Chen, H., and D. L. Zhang. 2013. “On the Rapid Intensification of Hurricane Wilma (2005). Part II: Convective Bursts and the Upper-tropospheric Warm Core.” Journal of the Atmosphere Science 70 (1): 146–162. doi:10.1175/JAS-D-12-062.1.
- Chen, X. M., M. Xue, and J. Fang. 2018. “Rapid Intensification of Typhoon Mujigae (2015) under Different Sea Surface Temperatures: Structural Changes Leading to Rapid Intensification.” Journal of the Atmospheric Sciences 75 (12): 4313–4335. doi:10.1175/JAS-D-18-0017.1.
- Chen, X. M., Y. Wang, K. Zhao, and D. Wu. 2017. “A Numerical Study on Rapid Intensification of Typhoon Vicente (2012) in the South China Sea. Part I: Verification of Simulation, Storm-scale Evolution, and Environmental Contribution.” Monthly Weather Review 145 (3): 877–898. doi:10.1175/MWR-D-16-0147.1.
- DeMaria, M., C. R. Sampson, J. A. Knaff, and K. D. Musgrave. 2014. “Is Tropical Cyclone Intensity Guidance Improving?” Bulletin of the American Meteorological Society 95 (3): 387–398. doi:10.1175/BAMS-D-12-00240.1.
- Elsberry, R. L., and R. A. Jeffries. 1996. “Vertical Wind Shear Influences on Tropical Cyclone Formation and Intensification during TCM92 and TCM93.” Monthly Weather Review 124 (7): 1374–1387. doi:10.1175/1520-0493(1996)124</>VWSIOT>2.0.CO.
- Guimond, S. R., G. M. Heymsfield, and F. J. Turk. 2010. “Multiscale Observations of Hurricane Dennis (2005): The Effects of Hot Towers on Rapid Intensification.” Journal of the Atmospheric Sciences 67 (3): 633–654. doi:10.1175/2009JAS3119.1.
- Harnos, D. S., and S. W. Nesbitt. 2016. “Varied Pathways for Simulated Tropical Cyclone Rapid Intensification. Part II: Vertical Motion and Cloud Populations.” Quarterly Journal of the Royal Meteorological Society 142 (697): 1832–1846. doi:10.1002/qj.2778.
- Hazelton, A. T., R. E. Hart, and R. F. Rogers. 2017. “Analyzing Simulated Convective Bursts in Two Atlantic Hurricanes. Part II: Intensity Change Due to Bursts.” Monthly Weather Review 145 (8): 3095–3117. doi:10.1175/MWR-D-16-0268.1.
- Hendricks, E. A., M. S. Peng, B. Fu, and T. Li. 2010. “Quantifying Environmental Control on Tropical Cyclone Intensity Change.” Monthly Weather Review 138 (8): 3243–3271. doi:10.1175/2010MWR3185.1.
- Kanada, S., and A. Wada. 2015. “Numerical Study on the Extremely Rapid Intensification of an Intense Tropical Cyclone: Typhoon Ida (1958).” Journal of the Atmospheric Sciences 72 (11): 4194–4217. doi:10.1175/JAS-D-14-0247.1.
- Kaplan, J., and M. DeMaria. 2003. “Large-Scale Characteristics of Rapidly Intensifying Tropical Cyclones in the North Atlantic Basin.” Weather and Forecasting 18 (6): 1093–1108. doi:10.1175/1520-0434(2003)018<1093:LCORIT>2.0.CO;2.
- Lin, I. I., C. C. Wu, I. F. Pun, and D. S. Ko. 2008. “Upper-ocean Thermal Structure and the Western North Pacific Category 5 Typhoons. Part I: Ocean Features and the Category 5 Typhoons’ Intensification.” Monthly Weather Review 136: 3288–3306. doi:10.1175/2008MWR2277.1.
- Miyamoto, Y., and T. Takemi. 2013. “Atransition Mechanism for the Spontaneous Axisymmetric Intensification of Tropical Cyclones.” Journal of the Atmosphere Science 70: 112–129. doi:10.1175/JAS-D-11-0285.1.
- Molinari, J., and D. Vollaro. 2010. “Rapid Intensification of a Sheared Tropical Storm.” Monthly Weather Review 138 (10): 3869–3885. doi:10.1175/2010MWR3378.1.
- Molinari, J., P. Dodge, D. Vollaro, K. L. Corbosiero and J. F. Marks. 2006. “Mesoscale aspects of the downshear reformation of a tropical cyclone.” Journal of the Atmospheric Sciences63(1): 341–354. doi:10.1175/JAS3591.1.
- Nguyen, L. T., and J. Molinari. 2012. “Rapid Intensification of a Sheared, Fast-moving Hurricane over the Gulf Stream.” Monthly Weather Review 140 (10): 3361–3378. doi:10.1175/MWR-D-11-00293.1.
- Rappaport, E. N., J. L. Franklin, L. A. Avila, S. R. Baig, L. J. Beven, E. S. Blake, C. A. Burr, et al. 2009. “Advances and Challenges at the National Hurricane Center.” Weather and Forecasting 24 (2): 395–419. doi:10.1175/2008WAF2222128.1.
- Rogers, R., and J. A. Zhang. 2015. “Multiscale Structure and Evolution of Hurricane Earl (2010) during Rapid Intensification.” Monthly Weather Review 143 (2): 536–562. doi:10.1175/MWR-D-14-00175.1.
- Rogers, R. F. 2010. “Convective-scale structure and evolution during a high-resolution simulation of tropical cyclone rapid intensification.” Journal of the Atmosphere Science, 67: 44–70. doi:10.1175/2009JAS3122.1
- Shu, S. J., Y. Wang., and L. N. Bai. 2013. “Insight into the Role of Lower-layer Vertical Wind Shear in Tropical Cyclone Intensification over the Western North Pacific.” Acta Meteorologica Sinica 27 (3): 356–363. doi:10.1007/s13351-013-0310-9.
- Tang, X. B., F. Ping, S. Yang, M. X. Li, and J. Peng. 2018. “A Comparison Study of Atmospheric Circulations and Potential Vorticity Anomaly between the Two Rapid-intensified Typhoons.” Atmospheric and Oceanic Science Letters 11 (6): 481–490. doi:10.1080/16742834.2018.1527656.
- Ventham, J. D., and B. Wang. 2007. “Large-Scale Flow Patterns and Their Influence on the Intensification Rates of Western North Pacific Tropical Storms.” Monthly Weather Review 135 (3): 1110–1127. doi:10.1175/MWR3327.1.
- Wang, H., and Y. Q. Wang. 2014. “Full Access a Numerical Study of Typhoon Megi (2010). Part I: Rapid Intensification.” Monthly Weather Review 142: 29–48. doi:10.1175/MWR-D-13-00070.1.
- Wu, C. C., S. N. Wu, and H. H. Wei. 2016. “The Role of Convective Heating in Tropical Cyclone Eyewall Ring Evolution.” Journal of the Atmospheric Sciences 73 (1): 319–330. doi:10.1175/JAS-D-15-0085.1.
- Zhang, D. L., and H. Chen. 2012. “Importance of the Upper-level Warm Core in the Rapid Intensification of a Tropical Cyclone.” Geophysical Research Letters 39: L02806. doi:10.1029/2011GL050578.