
 ?Mathematical formulae have been encoded as MathML and are displayed in this HTML version using MathJax in order to improve their display. Uncheck the box to turn MathJax off. This feature requires Javascript. Click on a formula to zoom.
ABSTRACT
The allocation of financial risks among project stakeholders is an important decision affecting the project success after the unexpected political and economic changes took place in Egypt and changes from 2011-2016. Some financial risks in a project are uncontrollable and impacted project stakeholders. Therefore, the research focuses on the know -how of applying modelling financial risk management from different perspectives. This paper presents FRAM is a dynamic model to identify and assess financial factors of risks with reference to project stakeholders; an owner/developer , contractor, financial agencies/ banks and project management companies before construction phase takes place using multi analysis tools.
Introduction
Another aspect of risk management extends beyond pricing. It investigates potential changes in asset value caused by changes in interest rates. A single interest rate is used to discount all bonds. This will be our main source of concern. Take the case of the Middle East has witnessed many political changes in developing countries in the past 10 years. Actually, Egypt started to reestablish its economic levels. Although others are still facing obstructions. The leading cause of researchers examining the most sources of risk. On the other hand, the developing countries had limited research concerning financial risk management. As an example, Egypt applied a group of changes in regulations that took place in November 2016 followed by; liberalizing the exchange rate against the dollar. Thus, the construction raw materials were raised by 200% [Citation1]. As a matter of fact, the steel prices raised after the floating pound from 4,963 LE/ton to 9,836 ***LE/ton [Citation2, Citation3]. The leading cause of stakeholders’ bankruptcy and interruption of many construction projects. As an illustration, the research objective is the identification of financial risks being widely considered in risk contingencies. Providing a Model to instruct not to encourage acceptance of projects that are not financially effective and modeling financial risk into construction plans to be controlled through the project updates. To facilitate for project stakeholders applying the process of financial risk management through the planning phase by; identifying, qualitative and quantitative analysis for the financial risk factors through a model software, which facilitates financial risk analysis. It is recommended to implement the financial risk analysis in a form of model software. The research goal is to solve the issue of determining project financial barriers and support the contingency plan by assessing financial risk identification to project stakeholders during the planning phase. One of the research goals is to predict prices for steel reinforcement per ton and cement per kilogram for the upcoming years.
Literature review
Financial risk identification
The leading cause of research has mentioned financial risks that are important for construction organizations [Citation4,Citation5]. As an illustration, the financial risks affected the construction industry in delivering project outcomes. A vital factor was the financial risk in construction comes from the inaccessibility of funds from the owner, rate of exchange fluctuations, inflation, and financial default of a contractor[27]. Along the same lines, the researcher considered top risks related to the financial were funding, shortage of material and equipment, cash flow coverage, bad weather, communication, and trust with suppliers [Citation6]. Take the case of the cost affecting risk factors on soil in infrastructure [Citation7]. In addition, 29 crucial risk factors were examined that come from the modular integrated construction projects MIC and classified by four principles and extracted that the first crucial factor illustrating the cost of MIC are Financial risks. Contrariwise, the research was not anticipated considering the fewest number of the critical risk factors examined in the research behind it [Citation8]. Without a doubt, many researchers discovered crucial risk factors for construction projects and most of them endorsed the financial risks. An example of risks stemmed from the three main sources in the financial risk management represented in the following:
Financial Market Risks (FMR) – The leading cause of losses is due to movements in financial market costs or volatilizes. Many researchers identified Financial Market Risk (FMR) into four elements included; interest rates, commodity prices, currency risk, and equity risk [Citation9–11,]. An example of identified factors that affected steel reinforcement and cement prices are the cost of production, cost of raw materials, cost of Energy, macroeconomic variables, and industry-related factors [Citation12]. As a matter of fact, researchers stated that financial risk is one of the critical risks faced by any construction industry as financial problems may lead to the complete bankruptcy of the Construction Companies [Citation13]. Although many kinds of research on market risks, there is a lack of factors classified according to the four elements.
Financial Credit risks (FCR) – the losses arising if a counterparty (obligor/bank) to the Central Bank of Egypt (CBE) fails to meet a financial obligation for full or partial value on the due date. However, many kinds of research identified Financial Credit Risks (FCR), which turned into Portfolio risks [Citation14]. Widely considered to be the factors contributing to credit risk, there is no research breakdown of the financial factors correlated with bankers and the construction sector together.
Financial Operational risks (FOR)- Take the case of process risk. Widely considered to be subdivided into four sources of such as information technology risk, mechanical risks, quality, safety, human error risks, and infrastructure risks [Citation15]. Recent research stated that Egypt is affected from 2011 to 2013 by the top significant risks, such as currency price changes, new tax rates, lack of fuel, unsecured roads, official changes, workers’ strikes, and fire risk [Citation5].
Risk assessment and modeling techniques
The aim of modeling financial risks is to consider different factors for different users to build a financial model in construction projects [Citation16]. As a matter of fact, different modeling approaches in construction proved that there is no single analysis model technique that can be considered to be the best choice for construction projects [Citation17]. Because of this, 14 factors in international construction projects were analyzed by using ISM & MICMAC [Citation18]. Only considered the contractor’s view only examined a combined analytical network processes ANP for rating risks, in infrastructure construction projects used the Analytic hierarchy process (AHP) for evaluating the cost of risk and classified such factors into two sources internal and external risks, which assists decision-makers to choose factors that are critical in decision phases [Citation7,Citation19]. Take the example of the construction supply chain, the researchers used the severity index as a tool for analyzing the top risks [Citation6]. Modular integrated construction projects used fuzzy modeling to evaluate 29 crucial risk factors that affected MIC and explained that the four principles proved that the top critical risk factor is a financial risk [Citation20,Citation21].
Research objectives and framework
The overall aim of the research discussed in this paper is to develop a statistical financial risk model for identifying and analyzing financial risk factors affecting construction budget performance from Developer, Banker, and Contractor perspectives and at a project level. The study is concerned with financial risk categories/factors rather than hazards, to achieve the overall objective the research will:
Review literature on the Identification of financial risk (Categories/Factors).
Review risk assessment and Modeling techniques.
Considering the Egyptian case study, identify the most critical factors that contribute to financial risk categories from different perspectives.
Design questionnaire for identification and assessment by the two assessment techniques were (Qualitative and quantitative analysis).
Review the correlation between the financial risk factors by interviewing experts.
Review the historical data for the fluctuating prices of the main material of construction (Steel reinforcement and cement)
Forecasting the material prices to help the decision-makers in construction budgeting.
Formalize such knowledge and build a statistical model for handling financial risks in construction projects as shown below in .
Figure 1. Research framework.
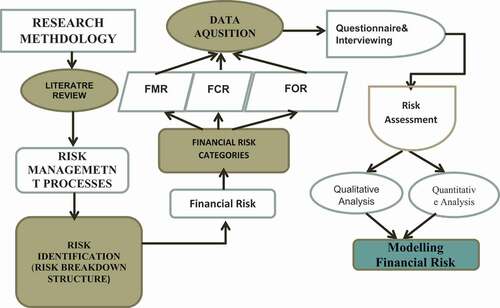
Identification, data acquisition, and measurement
Widely considered to be the identification and modeling risks, however, the other stated sources of risks, but not tend to highlight the responsible factors in Financial Market Risks (FMR), Financial Credit Risks (FCR), and Financial Operational Risks (FOR) [Citation9,Citation14]. As an illustration, the presents the categories in which this research identifies their contribution to financial risk factors. Along the same lines, the research designed questionnaires to identify and measure 24 factors of (FMR), 15 factors of (FCR), and 33 factors of (FOR).
Table 1. Financial RISK Factors.
Without a doubt, the research has been designed questionnaires targeting the stakeholders of the projects that are affected by financial risks. As an illustration of the categories of risks, FMR is targeting the experts of construction materials (Factories of Steel and Cement), FCR is targeting the funding agencies (Banks), and FOR is targeting the development and construction companies. Data were collected and analyzed based on the below for questionnaire design respondents. The research paper used the calculation of the sample size with a level of confidence of 86% as considered in the below equation.
Table 2. Questionnaire design & respondents.
Where N is the population size, P is population proportion, where Z equals 1.77 for a confidence level of 86% as considered to be E is the margin of error. The research paper examined the questionnaires that analyzed the data collected from interviews using the relative importance index method RII. For illustration, the total number of respondents’ factories, Developer companies, contractor companies, and Banks are 32, 25, 25, and 29 consequently. The total number of respondents was 111 out of 129.
Such knowledge achieved the aim of the research by increasing the awareness of identifying risk factors to handle the upcoming financial risks in different conditions. This research used the relative importance index for evaluating the financial risks from different perspectives. The four scale points were from one (the very little degree of effect) to four (the highest level of degree of importance) and were transformed into relative indices (RII) for each factor as shown below in a sample . Avital factors in the ranking are considered in the below equation 2.
Table 3. Financial risk categories/factors.
Where W is the weight given to each factor by the respondents (ranging from one to four), A is the highest weight (i.e. four in this case), and N is the total number of respondents. Higher the value of RII, contribute to financial risks.
Analysis tools
Probabilistic tool – impact cost on financial risks
How could the identification of the financial risks assess the project’s stakeholders in evaluating the impact on the project’s budget? Because of this, the research focused on the impact cost of risk for the identified risks. As an illustration, it could probably be classified into 5 levels, for example, very low, low, medium, high, or very high [Citation18]. Along the same lines, the research paper examined the impact into four percentages based on the level of risk. Take an example, very low is a probability, the impact of the cost is less than 1%. If the probability is low, it influenced the risk with a cost average between 1 and 5%. In the case of medium level, it influenced the risk with a cost between 6 and 10%. At the high level of risk, the cost is between 11 and 20%. Finally, a very high level impacted with a cost greater than 20%. As a part of the interviews, experts in construction projects analyzed the impact cost of risks. Which concluded with the following, an example of the exchange rate of the dollar. The developer’s perspective achieved the goal of the research by analyzing the impact of the exchange rate of the dollar on the project budget from 1 to 5%. On the other hand, from the contractor’s perspective, the impact cost on the project budget ranged from 11 to 20%. Set to become, the goal of the research is the quantification of the financial risk factors on construction projects.
Statistical tool – fluctuating prices of material and forecasting values
No question could answer as, to why fluctuating prices have taken place in most developing countries in recent years? How does it affect construction projects? Along the same lines of the literature, the research found that fluctuating material prices were among the top significant (FMR) factors that affect financial construction projects. Because of this, the uncertainties that come from the market sector deserve decision-makers. Widely considered to be many researchers have suffered from the prediction of the CPI in the building [Citation22]. Set to become, the relation between construction projects and steel and cement prices. This attempts this research to focus on prediction by using time series analysis. As an illustration, (Steel and Cement) prices have been collected from Central Agency for Public Mobilization and Statistics and the Central Bank of Egypt. The data collected are analyzed by using the time series analysis technique from 2009 to 2019 [Citation1,Citation23,]. The research has predicted the construction material prices to assess the project’s stakeholders in considering the risk of fluctuating prices contingencies.
Correlation analysis tool
Along the same line with the literature section, the Structure Self-Interaction Matrix Technique (SSIM) is used as a tool of correlation in Indian construction projects [Citation24]. This research used the interaction between factors resulting from interviews with experts through questionnaires to show the correlation between factors that contribute to financial risks by using (SSIM). Such a technique identified the relationships between any two financial factors. Such as (I, J) and direction of relationships are presented in four symbols as V = risk factor I excite risk factor J, an A = risk factor that will be excited by risk factor j, X = J & I will excite each other, and O = I & J are not related to each other, all the factors are shown in a binary matrix. A vital factor in this research is the correlation between Financial risks conducted by experts through interviewing. Along the same lines, the research methodology converted it into a binary matrix consisting of 72 whole categories factors. Take the example of the exchange rate of the dollar, set to become aggravated a lot of factors Labor/Equipment/material fluctuating prices, cost overrun, cost of fuel & power supply, etc. Hence, the relationship is V, in contrast, like the floating pound where the two factors are exciting each other, so the relationship is X. Widely considered to be the inaccurate reporting factor is not related to the exchange rate of the dollar, so it took symbol 0 and so on until finished the entire matrix as shown in sample .
Table 4. Sample of Correlation analysis tool by self-structure interaction matrix.
Questionnaires and results
The research aim is widely considered by identifying the most significant factors contributing to financial risk. Along the same lines of findings, the ranking factors’ results were subjective from different perspectives. A critical category was conducted, take an example of the Developer: the research found the high contribution factors were come from (FOR); time overrun, cost overrun, and poor quality of work. As an illustration, measured consequently by 65%, 70%, and 73% RIII. In addition, it influenced the project budget with an average cost of 11–20%. Along the same lines, which found the low contribution factors were from (FMR); the exchange rate of the dollar and the floating pound were measured consequently by 20, 45%. As result, it impacted the project budget by 1–5%. On the other hand Contractor’s Perspective, the research found that the contractor was highly impacted by the three categories. The contractor contributes with (FMR), the exchange rate of the dollar, and the floating pound which is highly impacted the cost of risk on the project budget by average from 11 to 20%. The relative importance index, which is considered for them, is consequently 80% and 94%. Concerning (FCR) the factor of credit rating reputation for the companies have a high impact cost of risk with an average of 11 to 20% on the project budget. Finally, considering the (FOR) the factors of; labor/Material/equipment/fluctuation prices, payment mechanisms, revenue/income risks, cost overrun, claims & disputes between stakeholders, and Type of contract were considered the highly impacted cost of risk with average 20% on the project budget.
Financial risk analysis model – fram
FRAM Structure
This research has achieved the proposed objective by establishing the financial risk analysis model to be a simple statistical model for handling Financial Risks with project stakeholders. The research proposed FRAM using computerized tools to handle consolidated financial risk reports/registers for decision-makers in construction projects. FRAM model was structured based on all the gathered data and calculations explained above from the research framework sections to be a database in the FRAM model as shown below in .
Figure 2. FRAM Proposed Model
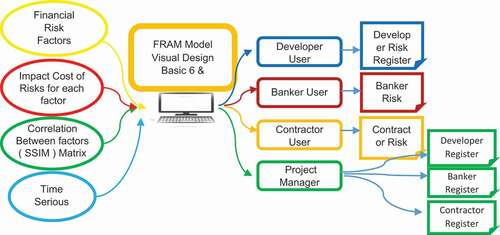
FRAM Limitation and Parameters After the determination of FRAM structure, the research has been limited to a selected group of stakeholders based on their contributions to the construction financial risks. The leading cause of the FRAM model has been structured to open in screens as shown below in . As an illustration, each stakeholder shall open his own screen. However, the project manager developed to be responsible for opening all screens of the other stakeholders for monitoring financial risks from different opinions.
Figure 3. FRAM main screen (stakeholders)
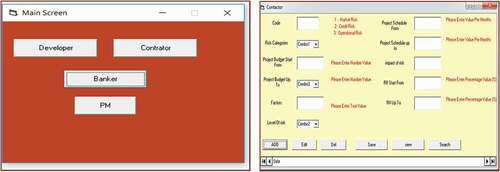
Figure 4. illustrate main parameters advanced parameters.
Project types (heavy projects or building projects)
Project budget (started from 10 million to 3 billion)
Project schedule (started from 8 up to 36 months)
Code of Category (1, 2, and 3)
Risk Category (Market, Credit, and Operational)
Factors (Specific Factor name)
Weight of risk (0.2, 0.4, 0.6 …, etc.)
Level of risk (Very low, Low, Medium, High, and Very High)
Impact Cost of risk (0%, 1%, 5%, 10%, and 20%)
FRAM advanced tools
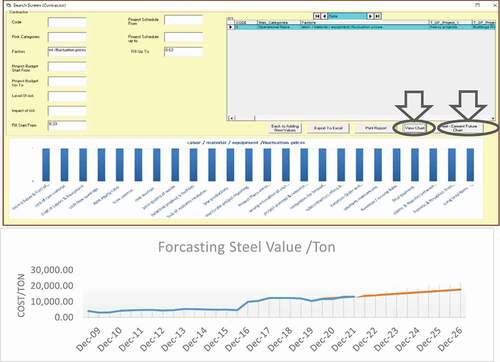
A vital parameter has been considered in the proposed FRAM, the correlation between the financial risk factors. The leading cause of explanation above. As an illustration, the research proposed to show the correlation analysis in the chart view button in the contractor/developer search screen. In a region facing fluctuating prices, the leading cause of the research has been provided by the proposed FRAM by forecasting charts for steel and cement prices. Along the same lines, the research determined the statistical analysis tool explanation in the above section. As a matter of fact, fluctuating prices of the material are considered from questionnaires results determined to be from high impact cost of risk that should be quantified.
Because of this, the research objective has been considered to consolidate the forecasting of construction material to be proposed in the FRAM model as shown below in .
Figure 5. Contractor Advanced screen
FRAM objective
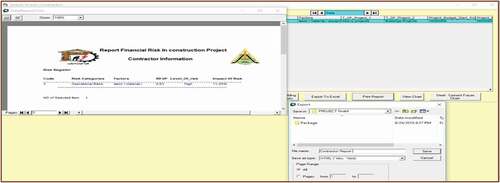
The FRAM model was built for handling projects’ stakeholder risk register for each one as shown below in . It is designed to extract the analyzed factors in spreadsheet files, notepad files, and HTML files used to be supporting documents in the project’s risk management plan during project phases. Each risk register/report consists of;
Figure 6. Contractor Reports
The factors that contribute to financial risk
Risk level
Weight of risk according to the RII
Impact cost of risk
Correlation factor chart
Expected values for Steel & Cement
Print Screen for the Advanced Charts.
Fram model validation
The research evaluated the performance of FRAM on a construction project from a Contractor perspective. An expansion project of food industries was planning to implement revamping for around 1000 sqm ‘Kitchen area’ within its existing factory on 06th October City, 2nd industrial zone, plot 36 Giza, Egypt.
Project scope of work
The contractor was responsible for requesting procurement and construction services for the revamping of the kitchen. Which is defined to be limited to the following: demolishing existing spices room, demolishing kitchen slab on grade, preparing the Geotechnical studies, checking the constructability of the design, procurement of foreign equipment, construction kitchen area, compressor room, and relevant utilities as per drawings and BOQ, and commissioning and start-up.
Project information
Along the same lines, the contract mentioned the total cost amount (11,805,767 LE) during 60 calendar days for completion and start-up. Because of this, there were significant clauses in the contract where the contractor’s total penalties that shall be extracted from the total contract was the amount (1.2%). As an illustration for the violations and the amount payable due to compensating engineers’ damage in case of delays. The Avital factor that should be considered as the percentage values of materials are 60% and the plant value is to be paid progressively through invoices every cycle of 21 days. Furthermore, the advance payment was 25% of the total amount of the project.
Project milestones
The contract mentioned three main milestones that the contractor should implement to take his invoices were;
Mobilization should be finished after 30 calendar days.
The end date of concrete works after 60 calendar days.
The Compressor room should be finished before 45 calendar days and the completion of concrete works and masonry work.
Project financial risks
The project started the mobilization activities on 45 calendar days due to a lack of coordination between the contractor team and the plant team.
The contractor submitted two claims to the developer for increasing the percentage of advance payment from 25% up to 50% and extended the project duration to 120 calendar days.
The project faced different factors of Financial Operational Risk (FOR) factors, such as the lack of knowledge and experience at the managerial level led to an incident during the operation time of the plant. Presented in changing the project management team many times.
Meanwhile, the financial risk factors resulted from the operational (FOR) source. At the end of 2016, a group of regulations changed in Egypt that affected the contractor during purchasing foreign equipment by delay in the schedule and influenced the project budget. At the same time, with the fluctuating prices in the main materials for concrete works, the steel price increased per ton by 200%. Finally, the central bank of Egypt floated the pound against foreign currencies, such as the dollar, Euro, …, etc.
FRAM application
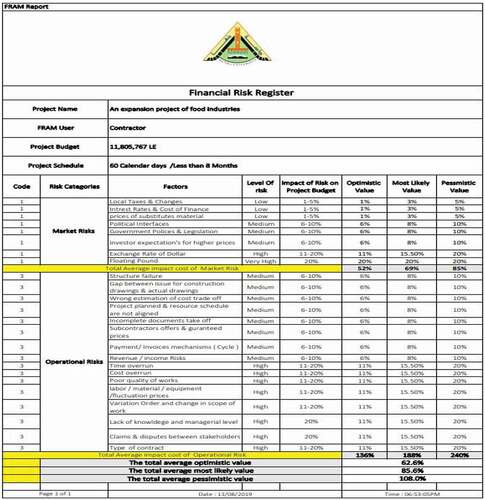
The contractor entered the project parameters into FRAM Model. The research case practices have resulted in the excel template format extracted from FRAM as shown in Figure 8. The financial risk register consisted of eight factors from (FMR) and 16 factors from (FOR). The final report/risk register estimated the impact cost of the financial risk factors occurred as shown below.
Impact cost of risk equation 2.
The project included eight financial factors of risk inside FMR that assessed in three impact cost of risk stated in optimistic impact cost of FMR = 52%, most likely impact the cost of risk of FMR = 69%, pessimistic impact cost of FMR = 85%. The project did not include FCR so it will be zero. The project included 16 Financial risk factors inside FOR stated in the optimistic impact cost of FOR = 136%. Most Likely impact the cost of FOR = 188% and pessimistic impact cost of FOR = 240%.
The total average optimistic value = ⅀52%+136%+0%/3 = 62.6%
The total average most likely value = ⅀69%+188% = 0%/3 = 85.6%
The total average pessimistic value = ⅀85%+240%+0%/3 = 108%
Discussions
The research findings agree with researchers who identified the factor that affected the critical risk and success factor in construction projects as a financial risk [Citation6]. Moreover, followed the classification of Horcher in the financial risk and categories in FMR, FCR and FOR [Citation9]. As an illustration of the most identified factors affected by such classified categories. The leading cause of the research agreed with the explanation of most factors related to financial market risk FMR [Citation12]. Along the same lines, the currency risks the research identified the following factors; inflation and fluctuation prices, exchange rate, and Floating pound [Citation5,Citation13]. As an explanation for collected data, this research represented other sources of financial risk from the market sector. As an illustration of the introduced factors, the equity risk factors and commodity prices factors, and Interest risk factors, have been determined by experts in construction management through questionnaires and during interviews. Take the case of the FCR factors, the identification phase explained the main source of credit risk is portfolio risk as mentioned before [Citation22]. Set to become established as a finding from the research, the top factors have been determined through interviews with experts in the Central Bank of Egypt [Citation1,Citation23]. Finally, FOR where the research proposed to split into four subcategories [Citation15]. Along the same lines, the most predominant subcategories are the information technology risks, and the infrastructure risks [Citation6].
The research objective has been achieved successfully by considering a Financial risk analysis model FRAM. A case in point of expediting the application of Financial risk management processes in construction projects by expressing the concern of different project stakeholders’ opinions in identifying, assessing, and forecasting the uncertainties and keeping them away from the project milestones . The research discussed the importance of the improper identification of financial risk management which has been proved by applying the FMCG case study on FRAM. After, reviewing experts in the construction industry on the effectiveness of FRAM. The contractor teams expressed satisfaction with the practice of the application and the advanced tools described in correlation tools and Forecasting charts for the main material. This research recommends focusing on choosing the most appropriate type of contract, identifying the financial risks in the project allows a reasonable logical estimate. Finally, research stated that FRAM Model is going to link with scheduling applications as an example of Primavera P6 & Primavera Risk Analysis to show the impacted time and cost of the project’s schedules.
Figure 7. Financial risk report for industrial food expansion plant.
Conclusions
The objective of financial risk management benefits beyond their cost limits. the research considered how to Identify those risks away from the randomness of the emergency reserve. The leading cause reflects specific risk factors and instructs not to encourage acceptance of projects that are not financially effective through uncertain conditions. The research paper expressed the financial risk into three main categories; (FMR), (FCR) and (FOR). As an illustration, the factors were identified and determined through questionnaires and interviews with experts in construction projects. Throughout the data collected and measurements, in fact, FRAM achieved the proposed objective of the research. The research expressed the concern of modeling the financial risks by providing consolidated financial risk registers consisting of; categories, weighted factors, level of risk, and impact cost represented through the user applying it. Finally, FRAM succeeded in supporting the project management team during the construction project phases. Which examined the impact cost of risk at the industrial food expansion, as a pessimistic value was 108% increase over its budget. Out of this research, FRAM Model is suitable for construction projects in Egypt and similar countries, which have the same conditions.
Disclosure statement
No potential conflict of interest was reported by the author(s).
References
- Central Bank of Egypt, CBE. 2019. Central bank of Egypt. Inflation and exchange rates statistics: [accessed by 2019 Feb 12] https://www.cbe.org.eg/en/EconomicResearch/Statistics/Pages/InflationRates&Exchangerates.aspx.
- CAMPAS 2019. Central agency for public mobilization and statistics. Egypt. Steel and Cement Prices: [accessed by 2019 Jan 10 https://www.capmas.gov.eg/Pages/IndicatorsPage.aspx?page_id=6130&ind_id=2542
- Elfahham Y. Estimation and prediction of cost index using neural networks, time series, and regression. Alex Eng J. 2019;58(2):499–506.
- Gudienẻ N, Banaitis A, Banaitiene N. Evaluation of critical success factors for construction projects – an empirical study in Lithuania. Int J Strategy Prop Manage. 2011;17(1):21:31.
- Khodeir LM, Mohamed AH. Identifying the latest risk probabilities affecting construction projects in Egypt according to political and economic variables. HBRC. 2015; 11(1): 129–135. Jan 2011 Jan 2013.
- Abas M, Khattak BS, Habib, et al. Assessment of critical risk and success factors in the construction supply chain: a case of Pakistan. Int J Construct Manage. 2020:1–9. 10.1080/15623599.2020.1783597.
- Low WW, Wong KS, Lee JL. Cost-influencing risk factors in infrastructure projects on soft soils. Int J Construct Manage. 2019.
- Zou PXW, Zhang G, Wang J. Understanding the key risks in construction projects in China. Ijpm. 2007;25:601–614.
- Horcher KA. Essentials of financial risk management. Canada(New Jersey): John Wiley & Sons, Inc, HobokenEssentials Serious; 2005.
- Jorion P. 2003. Financial risk manager handbook. Second. Canada; John Wiley & Sons, Inc; Hoboken(New Jersey). Chapter 1, Bond FundamentalsVol. P 3–26.
- Record N 2003. Currency overlay. England John Wiley, Sons Ltd. 4, Foreign Exchange Market-History and Structure; p 61–82.
- Ashley DB, Bonner JJ. Political risks in international construction. J Constr Eng M Asce. 1987;113(3):447–467
- Kolhatkar MJ DR, Dutta AB. Financial risks in construction projects. Ijaiem. 2013;2(11):2319–4847.
- Gad NA, Abdel Monem M, El-Dash K, et al. 2018. Factors contributing to Construction financial risks in Egypt. Proceeding of the 2nd International Conference Sustainable Construction and Project Management-Sustainable Infrastructure and Transportation for the future. 18 Dec 2019. Aswan, Egypt : Housing and Building National Research Center. ICSCPM. P. 20.
- Simplicable.2019. Singapore: spacey J; [accessed 2017 Mar 20]. https://simplicable.com/new/operational-risk.
- Project Management Institute (PMI). A guide to project management body of knowledge – PMBOK®Guide –. Sixth ed. United States (US) 2017.
- September 1-3: Heriot-Watt University: Association of Researchers in Construction Management. P.141–152.
- Lavanya N, Malarvizhi T. Risk analysis and management: a vital key to effective project management. In Proceeding of the PMI® Global Congress, 1. Australia(New South Wales):Project Management Institute;2008. Conference paper, 15 march 2019.
- Bassioni H, Elmasry MI, Ragheb M, et al. Time series analysis for the prediction of RC material components prices in Egypt. In: Smith SD, Eds., Proceeding of the 28th Annual ARCOM Conference. Edinburgh(UK): Association of Researchers in Construction Management; 2012 September 3-5. p. 381–390.
- Wuni IY, Shen GQ, Osei-Kyei R, et al. Modeling the critical risk factors for modular integrated construction projects. Int J Construct Manage. 2020.
- Yazdani M, Alidoosti A, Zavadskas E. Risk analysis of critical infrastructures using fuzzy copras. Econ Res. 2010;24(4):27:40.
- Feuerman TA 2016 Apr 26. Financing trends in the construction industry. Construction global: accessed 2017 Apr 20]; Construction industry 2017 Apr 20. https://www.constructionglobal.com/facilities-management/financing-trends-construction-industry.
- Boateng P, Ahiaga-Dagbui D, Chen Z, et al. 2015. Modeling economic risks in megaproject construction: a systemic approach. In: Raidén. Proceeding of the 31st Annual ARCOM Conference; September 7-9: Lincoln, (UK): Association of Researchers in Construction Management. P. 115–124.
- Kumar JHA, Devaya M. Modelling the risks faced by Indian construction companies in international projects. Constr Manag Econ. 2008;26(4):337–348