
ABSTRACT
Coastal vulnerability is a multidimensional and vital issue in many parts of the world, as well as in Egypt. Accelerated human activities such as industry growth, tourism, and urbanization in coastal regions, together with climatic stresses – particularly Sea Level Rise (SLR) – have increased the intensity of potential risk. This review article aims to provide a coherent review of the various methods and approaches used in the coastal vulnerability assessment studies for the Egyptian northern Mediterranean coastal region. The PRISMA method was used to review and analyze coastal vulnerability assessment studies of a total of 26 Scopus peer-reviewed documents according to the selected methods, scales, and used variables in the time frame of 2012–2022. This review reveals the gaps of the current research, which are the following: lack of usage of predictive assessment methods, lack of temporal dynamic dimension in the selected methods and variables (present in only 3.8%), lack of local scale assessments (present in only 7.6%), and lack of transparency regarding the rationale for variable selection. Furthermore, the current challenges found in the reviewed coastal vulnerability assessment methods have been discussed to provide a more comprehensive, dynamic approach to assist researchers and coastal planners in preparing and protecting the vulnerable Egyptian northern coastal region.
Introduction
In coastal zones, natural (physical and ecological) and societal subsystems interact dynamically [Citation1]. Coastal regions undergo a lot of pressure due to natural and anthropogenic processes in the climate system [Citation1–3]. Climate change and other associated drivers have subjected the coastal regions to a chain of serious impacts, leading to higher vulnerability due to their high population densities, diverse ecosystems, high productivity, and the continuous urbanization taking place in those areas [Citation1,Citation2,Citation4]. Therefore, coastal regions, especially the low-lying ones, are threatened by rising sea levels, which are one of the key impacts of climate change [Citation2,Citation3,Citation5]. Coastal vulnerability is dynamic; and not only dependent on the rate of the SLR but also differs according to the context, with its environmental characteristics and human interventions [Citation2,Citation3]. Flooding, salinization, storm surges, and other effects of SLR will have an impact on coastal regions’ socioeconomic and ecological systems [Citation2].
The serious threats posed by SLR are raising concerns about the increasing potential impacts in coastal regions, which has prompted the academic community to develop many approaches to assessing the vulnerability of these highly threatened coastal regions [Citation5]. Scenario studies were originally developed by academics to alert decision-makers of the future’s uncertainties and potential impacts due to SLR. And as Nguyen, et al. [Citation5] noted, there is a great deal of diversity in emerging vulnerability definitions, concepts, and assessment methods, which is due to the differences in context, socioeconomic systems, politics, etc. This review focused on the definition of vulnerability by Klein & Nicholls [Citation6], p. 183, ‘Vulnerability to impacts is a multi-dimensional concept, encompassing bio-geophysical, economic, institutional and socio-cultural factors. Vulnerability is usually considered to be function of a system’s ability to cope with stress and shock. In line with this, vulnerability of coastal zones has been defined as the degree of incapability to cope with the consequences of climate change and accelerated sea-level rise. Thus, vulnerability assessment includes the assessment of both anticipated impacts and available adaptation options’. Hence, Coastal vulnerability required the development of a variety of methods, such as scenario development, used models, and others, to be able to support the right decisions and actions taken [Citation4]. Coastal vulnerability assessment is a multidimensional approach that improves decision-making and disaster risk reduction processes [Citation7].
Ali, et al. [Citation8] and Torresan, et al. [Citation9] indicated that the temperature of the sea water and the atmosphere in the Mediterranean Basin region has been increasing, the region is considered a climate change hotspot. Egypt is one of the most vulnerable countries to the potential effects of climate change, with its northern coastal region being a particularly vulnerable area with a diverse ecosystem and socioeconomic activities. Human activities like high population density, rapid population growth, unplanned urbanization, and climate factors like SLR stress Egypt’s northern coastal region [Citation10,Citation11]. The Nile Delta region is one of the most vulnerable low-lying coastlines in the Mediterranean Basin and Egypt’s northern coast, with a high vulnerability to SLR [Citation2,Citation11,Citation12]. And the IPCC [Citation2] clarified that by 2100, the global mean sea level will rise by 0.44 m, and estimated 2,660 km2 of the northern Nile Delta will be submerged. There is a significant risk of flooding and saltwater intrusion in the Nile Delta region as a result of future SLR. Both the tourism and agricultural industries will be highly affected [Citation10]. Also, Raey [Citation10] also noted that Egypt has low community and technical preparedness for extreme weather events.
Therefore, it was pertinent to review the development of the vulnerability assessment field in our local context. Many vulnerability assessment studies have already been done in the Egyptian Mediterranean coastal region. In this review, we carry out a systematic review of coastal vulnerability assessment studies that took place in the Mediterranean coastal region in the Egyptian context. The focus was given to SLR resulting from climate change impacts. The aim of this review is to give a full picture of the previous work on coastal vulnerability assessment in the Egypt’s northern coastal region. In order for future vulnerability assessment research to be more thorough and assist decision makers, it may be useful to identify areas that require additional research. Also, the following questions guided the reviewing and analysis process: (1) what vulnerability assessment methods were most commonly used? (2) What spatial scale predominated? (3) What variables are most commonly used to measure vulnerability to flooding in coastal regions? (4) To what extent did these studies apply uncertainty and dynamic-related indices, considering future dynamism? (5) Did these studies consider adaptive or coping capacity in their vulnerability assessments? In addition to highlighting existing challenges, we also point out directions for further research.
This review is divided into three sections. The first section is devoted to illustrate the methods and techniques adopted in the reviewing process. The second section displays the results and discussion from the reviewed documents, and the final section concludes this review.
Methods and methodology
Research method
The current study is a systematic review of existing research on coastal vulnerability assessments of the Egyptian northern Mediterranean coastal region. This review followed the PRISMA (Preferred Reporting Items for Systematic Reviews and Meta-Analyses) 2020 method described by Page, et al. [Citation13]. This type of review was carried out to consider all the stages of the review process, from identification, screening, and eligibility to data generalization. Data were selected, simplified, and analyzed using database search and snowballing.
Search strategy
In this review, the Scopus database was used primarily to select peer-reviewed documents published during the last decade. The search was done within the ‘Article title, Abstract, Keywords’ only, using the following keywords: (‘coastal’ AND ‘vulnerability’) OR (‘flood’ AND ‘vulnerability’ AND ‘assessment’) OR (‘social’ AND ‘vulnerability’ AND ‘assessment’) AND (‘Nile’ AND ‘Delta’) OR (‘Egypt’) AND (‘sea’ AND ‘level’ AND ‘rise’) OR (‘climate’ AND ‘change’). The documents used were chosen to cover the time period 2012–2021. Documents published in 2022 were also reviewed and analyzed, in order to include the most recent published documents in the reviewing process. The Scopus database search elicited 48 documents published between 2012 and 2022. In addition, snowballing was done using Google Scholar database, using keywords such as ‘coastal vulnerability assessment’, ‘vulnerability’’”, SLR”, ‘Egypt’, and ‘Nile Delta’. After scanning the first 4 pages from Google Scholar, 17 documents were found to be published within the same temporal coverage, and 14 of these documents were found to be Scopus-indexed and were added to the reviewing process.
Eligibility and exclusion criteria
As shown in the section above, keywords and the date of publication were the first refining criteria used. The PRISMA flowchart in illustrates the used exclusion criteria;
Figure 1. PRISMA flowchart – Study methodology of excluded and included documents. Source: adapted from [Citation13].
![Figure 1. PRISMA flowchart – Study methodology of excluded and included documents. Source: adapted from [Citation13].](/cms/asset/39ba994c-ccda-44f3-9c54-fdcc1ba8166a/thbr_a_2241964_f0001_oc.jpg)
During the screening process, it was found that 11 documents were duplicates. After removing the duplicate documents, the reviewing process will be completed for a total of 51 Scopus-indexed documents.
An initial review for the abstracts of the 51 documents showed that 15 were not relevant to this review due to different research objectives and technical details, such as vulnerability assessments of: coastal aquifers, soil, food security, flash floods, etc.
Documents with no access to the full text were excluded as it couldn’t be reviewed in detail. Although the abstract content seemed to be quiet fitting to this review.
Qualitative research that looked at vulnerability was also left out because it didn’t fit with the goal of this review.
After the screening phase, 36 documents were assessed for eligibility to be included in the study and 26 were finally included.
Reviewing and analysis process
Each document was reviewed and analyzed according to the three main parts of the coastal vulnerability assessment: the used assessment method, the selected scale for the study area, and the used variables.
Assessment method: the documents were classified based on whether the method used was an indicator and index-based method, a Geographic Information System (GIS)-based method, or a dynamic models-based method.
Study area scale: documents were classified according to the following categories: neighborhood, city, regional, national, and international scales. Also, during the reviewing process, it was found that a couple of assessments covered more than one city or governorate. However, the study area did not cover a whole region, so the sub-regional scale was added as a category between the city and regional scales.
Variable used: variables for each assessment were collected. Duplication of variables was checked first, and variables with the same meaning and objective were merged and named under a common name. Based on the resulting collective set of variables, 5 categories were generated for variables classification. These categories were; social, economic, physical, biophysical and coping capacity.
The reviewing and analyzing process excluded the part about variable reduction methods. There was a gap in the explanation of the reduction methods used in the vulnerability assessment studies. It was only mentioned in a couple of the reviewed documents; however, the majority of the documents didn’t explain it, so it was disregarded from this review.
Results and discussion
Review on coastal vulnerability assessment method
Coastal vulnerability assessments have various forms and approaches [Citation5,Citation7]. They can be classified based on the study area’s goal and required spatial scale (top-down and bottom-up approaches), subject matter (scenario-driven, resilience-driven, or vulnerability-driven approaches), and methods used (indicator- and index-based approaches, GIS-based methods, and dynamic models) [Citation3]. This review focuses on the latter classification of vulnerability assessment methods. It is also important to determine the approach of the study (socio-economic, biophysical, adaptive-related, etc.). And it is essential to highlight that some documents didn’t clearly state the method or framework, but the classification was determined based on authors’ analysis. A section for documents using multiple methods has been created under the heading ‘Indicators and GIS integrated method’.
Indicator and index-based methods
Coastal Vulnerability Index (CVI)
The following reviewed documents used the CVI method in their studies. Mohamed [Citation14] used seven CVI variables and added two more variables (shore protection structures and land cover) to assess the coastal vulnerability of Alexandria and El Beheira. The study identified 17.52% of the study area as having high vulnerability. Torresan, et al. [Citation9] used the Climate-improved Coastal Vulnerability Index (CCVI) to assess the vulnerability of the Egyptian Mediterranean coastal region, including biophysical and socio-economic variables. The study revealed that 5% of Damietta and Kafr el-Sheikh coastal regions, 4% of El Beheira, and 1–2% of Alexandra have coastal regions with high to very high coastal vulnerability. Emam, et al. [Citation15] assessed the coastal vulnerability of Zaranik protectorate area in North Sinai including six biophysical variables. The study analyzed shoreline dynamics using the Digital Shoreline Analysis System DSAS tool integrated into ArcGIS software and found the area highly vulnerable to sea level rise. Frihy [Citation16] assessed the coastal vulnerability of the Nile Delta from Alexandria to El Suez Canal. The method included seven variables: six biophysical variables and one coping capacity variable. The study found that 37.6% of the study area has high to very high vulnerability, 19.7% is moderate, and 42.8% is low. Hereher [Citation17] used six biophysical variables to assess the coastal vulnerability of the Egyptian Mediterranean. The study found that the Nile Delta and North Sinai coasts are high-risk regions for sea level rise. The study considered the physical aspect as the most important factor for determining the degree of vulnerability.
Social Vulnerability Index (SoVI)
Waly, et al. [Citation18], used a composite social vulnerability index with 14 variables, measured on a neighborhood scale, to evaluate Alexandria’s coastal region’s social vulnerability. The study found that adding housing and infrastructure-related variables to socio-economic variables increased the percentage of vulnerable areas in Alexandria’s neighborhoods. Previous World Bank studies found that high-to-medium physically vulnerable areas were the most socially vulnerable.
Integrated Vulnerability Index
Hzami, et al. [Citation19] used an integrated coastal vulnerability index (ICVI) that combined the CVI with a socio-economic vulnerability index to assess Nile Delta’s vulnerability. The study used a multi-criteria approach to map physical and socioeconomic variables, showing high risk scores of 70% due to anthropogenic factors and coastal population growth. Gouda [Citation20] integrated the biophysical, socio-economic, institutional, and adaptive capacity aspects. The study focused on the impact of urbanization and climate change on socioeconomic life in the Nile Delta. Schilling, et al. [Citation21] assessed Mena countries’ climate change vulnerability with a focus on water resources and social implications.
GIS-based methods
It is primarily used to assess vulnerability to SLR scenarios using interactive maps and digital elevation models (DEMs) [Citation3,Citation22]. Abdrabo, et al. [Citation23], assessed the physical vulnerability of the coastal northwest region using GIS-based models to assess land use land cover (LULC) dynamics and SLR vulnerability. The study found that uncontrolled urban expansion could double the vulnerability of these urban areas. Abdelgawad, et al. [Citation24] mapped Alexandria’s flood vulnerability using remote sensing, satellite data, DEMs, and GIS modeling, considering 12 social, physical, and biophysical variables. Results showed that a 1.0-meter SLR will submerge 30% of the city, while a 3-meter rise will result in over 50% loss of residential, agricultural, industrial, leisure, and port areas in the North West. Marzouk, et al. [Citation25] used a Climate-Coastal model to assess the vulnerability of Al-Alamein New City by examining 10 biophysical climate variables and land cover/use changes using remote sensing and GIS techniques. The study period covered 30 years of monitoring changes due to climate change, and no very low or very high vulnerability areas were found.
Solyman & Monem [Citation26] used GIS to map SLR scenarios in the Nile Delta and found Kafr El-Shikh to be the most vulnerable governorate, and Fouh the most affected district. Refaat and Eldeberky [Citation27] analyzed the topography of the northern coast of Egypt from Alexandria to the western coast of Sinai to assess flooding risk due to storm surges and SLR using DEMs. The study identified that 7% of the Nile Delta’s total surface area is vulnerable to expected flooding, distributed in the coastal governorates of Beheira, Kafr El Sheikh, Damietta, Dakahlia, Port Said, and North Sinai. Hasan, et al. [Citation28], assessed the Nile Delta’s SLR vulnerability using three variables: two socioeconomic and one physical. The study used two available DEMs and MODIS to evaluate SLR and extract land cover information.
Batisha [Citation29] used fuzzy decision making technique (FDMT) to assess Nile Delta vulnerability, showing high vulnerability. Zaid, et al. [Citation30], mapped Damietta, Alexandria, Beheira, and Kafr El-Sheikh’s vulnerability to SLR and land subsidence using GIS, modeling, and ground-based surveys. The study concluded that Alexandria is at the highest risk of land use land cover change. Hassaan & Abdrabo [Citation31] used GIS to assess the Nile Delta’s vulnerability to SLR and land subsidence, using four biophysical variables: relative SLR, land subsidence, topography, and LULC. The study emphasized the importance of assessing the effects of SLR on different LULC types. Hassaan [Citation32] used the same approach to assess SLR vulnerability in Kafr El Sheikh, with inundation damage depending on the types of land uses affected. SLR will inundate 5 of Kafr el Sheikh’s 10 districts, with 40% of the five districts in the eastern governorates of the Nile Delta expected to be lost. Both Hassaan & Abdrabo [Citation31] and Hassaan [Citation32] noted that the presence of adaptive measures can affect vulnerability calculations. Eastern Nile Delta governorates were found to be more vulnerable to SLR inundation than those on the western side.
Index and GIS integrated methods
ElMasry, et al. [Citation33] used an integrated method that included both biophysical and socioeconomic variables to assess tourism vulnerability to climate change in El Hammam city, Al Alamein. The study also assessed SLR vulnerability using DEM and inundation models. Baumert & Kloos [Citation34] used a mixed approach to assess the socio-economic and ecological vulnerability of Alexandria using seven variables, highlighting the high exposure to future threats due to SLR and rapid urbanization in some areas. Community resettlement was found to be the only option for some coastal regions in the future.
Elboshy, et al. [Citation35] used 18 variables to assess climate change-related pluvial flood risk in Alexandria using GIS software. High risk levels were found to be concentrated in the informal areas due to high flood scenarios and a lack of adequate emergency response. Satta, et al. [Citation36] assessed Mediterranean coastal climate and non-climate risks, including Egypt’s northern coast, using the Coastal Risk Index (CRI-MED) map. The CRI-MED method is a spatial risk index with 13 variables: eight socio-economic and five biophysical. The study found the Egyptian northern coast to be moderately to extremely vulnerable compared to other Mediterranean coastal regions. However, some of the extremely high, high, and moderately vulnerable regions turned out to be under high, moderate, and low risk due to lower levels of exposure when applying all the index variables.
Dynamic models
Dynamic models are categorized into: Sectoral models focus on one climate change impact, while integrated assessment models analyze multiple climate change impacts [Citation22]. Vousdoukas, et al. [Citation37] assessed African coast heritage sites’ vulnerability using a hydrodynamic model and geographical information for shoreline changes. Egypt was categorized as having four exposed sites. (Elshinnawy & Almaliki [Citation38] used GIS and Visual MODFLOW 4.2 software for saltwater intrusion and shoreline analysis to assess coastal vulnerability from Gamasa to Ras El Bar. The method included eight biophysical variables and one physical variable, with only 2.16% of the area threatened by inundation due to rising groundwater. Sharaan and Udo [Citation39] used the Bruun Rule model to assess the future projections of SLR, coastal erosion, and land subsidence on Egyptian northern coast beach profiles, taking into consideration the presence of coastal protection measures. The study used satellite images and GIS tools.
shows that 34.6% of the reviewed studies used quantitative indicator and index-based methods for vulnerability assessments, with nine documents using this method. Five documents used CVI; however, three of them added one or two socio-economic-related variables. According to Ramieri, et al. [Citation40], the CVI is one of the simplest spatial methods for assessing coastal region change. CVI originally included six to seven variables. It can be applied locally, regionally, and supra-regionally, and the results are mostly mapped using GIS to show vulnerability on a fine spatial scale. The CVI-based method was always criticized for ignoring socio-economic factors when assessing study area vulnerability [Citation40]. Although integrating socio-economic variables affects vulnerability assessment, only one document used SoVI. The last two documents used a multi-criteria approach.
Figure 2. Number of documents using each coastal vulnerability assessment method.
Ten of the reviewed studies (38.4%) used the GIS-based method, which is popular for mapping vulnerable areas, especially for physical variable assessments. Four studies (15.3%) combined the GIS-based method with quantitative index methods for socio-economic variables and spatial mapping for physical and biophysical variables. Three studies (11.5%) used integrated model assessment approaches for dynamic models.
Review on study areas scales
SLR impacts vary by spatial scale and will be unequally distributed across and within countries, regions, and communities [Citation41]. Vulnerability assessments must consider the appropriate spatial and temporal scales for accurate results [Citation42]. When conducting a vulnerability assessment, data selection should prioritize the ability to explain changes, not just data availability. Coastal vulnerability assessments range from national to regional to local scales and study area scale depends on the assessment objectives [Citation43]. Torresan, Critto, et al. [Citation44] illustrated that vulnerability assessments on national and international scales assess climate change impacts on coastal systems and inform central government policies, while regional, sub-regional, and local assessments identify specific vulnerable sectors and aid in designing adaptation strategies. illustrates the number of documents on each scale.
Table 1. Spatial scales found in reviewed documents.
Neighborhood scale
Only two documents examined neighborhood vulnerability assessment using indicator and index-based methods. Waly, et al. [Citation18] assessed the vulnerability of Sheiakha in Alexandria using SoVI, focusing on socioeconomic and physical variables. Emam, et al. [Citation15] studied the vulnerability of the Zaranik protectorate’s ecosystem, using CVI’s biophysical variables.
City scale
Six documents assessed city-scale vulnerability, mainly using biophysical variables, but most integrated physical and socioeconomic variables. One of the documents included institutional and coping capacity variables, and two included LULC change.
Abdelgawad, et al. [Citation24], Elboshy, et al. [Citation35] and Baumert & Kloos [Citation34] assessed Alexandria’s vulnerability considering physical, biophysical, and socioeconomic variables; however, Elboshy, et al. [Citation35] added institutional and coping capacity variables, and Baumert & Kloos [Citation34] also considered ecological variables and urban development. ElMasry, et al. [Citation33] assessed El Hammam’s vulnerability using biophysical, socioeconomic, and tourism climate variables. Marzouk, et al. [Citation25] assessed Al-Alamein New City’s vulnerability using biophysical variables and integrating the dynamic factor for LULC change. And Hassaan [Citation32] assessed Kafr El Sheikh’s vulnerability using biophysical and economic variables.
Sub-regional scale
Three documents assessed sub-regional vulnerability using biophysical and physical variables. Abdrabo, et al. [Citation23] assessed the vulnerability of the northwestern Nile Delta from Alexandria to Rosetta. Elshinnawy & Almaliki [Citation38] assessed coastal vulnerability from Gamasa to Ras El Bar. Both used biophysical and physical variables; however, Abdrabo, et al. [Citation23] added the LULC change variable. Mohamed [Citation14] assessed Alexandria and El Beheira vulnerability, considering biophysical variables, coping capacity variables, and LULC change variable.
Regional scale
Six documents reviewed assessed Nile Delta vulnerability on a regional scale. All assessed Nile Delta vulnerability. Gouda [Citation20], Hasan, et al. [Citation28], and Batisha [Citation29] mainly assessed biophysical and socioeconomic factors. Frihy [Citation16], and Hassaan & Abdrabo [Citation31] focused on the biophysical variables. Importantly, Gouda [Citation20] and Frihy [Citation16] included coping capacity variables. And Hasan, et al. [Citation28] as well as Hassaan & Abdrabo [Citation31] included the LULC information in their assessments. Also Zaid, et al. [Citation30] assessed Damietta, Alexandria, Beheira, and Kafr El-vulnerability. Sheikh’s both relied on biophysical and coping capacity variables.
National scale
Five documents assessed Egyptian northern Mediterranean coastal vulnerability on a national scale. All studies on the national scale mainly used biophysical variables. However, Torresan, et al. Citation9 included the LULC, Sharaan & Udo [Citation39] integrated coping capacity variables, and Solyman & Monem [Citation26] included socioeconomic variables in their study.
International scale
Four documents assessed international-scale vulnerability. Vousdoukas, et al. [Citation37] assessed African coast vulnerability, while Schilling, et al. [Citation21] worked on the MENA region’s countries, Hzami, et al. [Citation19] and Satta, et al. [Citation36] worked on the Mediterranean coast. And Schilling, et al. [Citation21] and Satta, et al. [Citation36] considered socioeconomic factors.
After classifying the documents according to their spatial scales used in the vulnerability assessment studies, as shown in . The reviewed vulnerability assessment studies were mainly concentrated in the Nile Delta region, with Alexandria, El-Beheira, Kafr El Sheikh, Damietta, and Port Said being the most studied areas. North Sinai and the north coast were only studied once, but the results indicated a significant vulnerability that cannot be overlooked.
Figure 3. Relationship between assessment studies’ locations and spatial scale.Source: Authors.
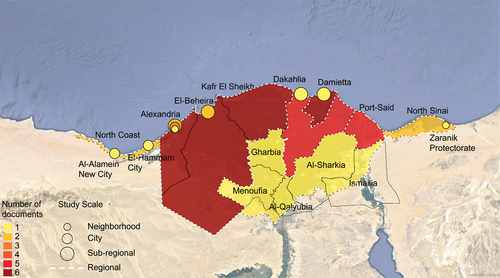
Only two documents studied the neighborhood scale despite its data availability from census tracks [Citation45]. Smaller scales always provide more detailed and reliable data for decision-makers. Alexandria was the most assessed area at city, sub-regional, and regional scales. Some studies integrated LULC change and coping capacity variables across city to national scales. No sub-regional studies included socioeconomic variables.
Review on used variables
Variables are quantitative concepts used to measure vulnerability and identify future risks and vulnerable communities [Citation46]. The 26 reviewed documents were categorized into five main categories of variables: social, economic, physical, biophysical, and coping capacity. The most commonly used variables were analyzed and presented in a matrix showing the relationship between variable selection and study spatial scale for each category. These matrices can reveal research gaps and guide index contextualization in the Egyptian context.
Social variables
Social and economic variables can affect community’s social vulnerability to natural or man-made disasters. Social variables for example: demographic density, population age, education, etc., can affect a community’s disaster preparedness [Citation47]. The IPCC [Citation48], recommends studying social vulnerability locally. Studying coastal social vulnerability can guide prevention and mitigation strategies. Table A1 in Appendix 1Footnote1 shows the number and scale of social variable studies. General and wider variables, such as population density, growth, and illiteracy rate, were used more frequently, while detailed social variables are mostly used at the neighborhood and city scales. The matrix shows that 30% of reviewed vulnerability assessments considered social factors.
Economic variables
As illustrated before, economic and demographic variables determine a community’s social vulnerability. Economic status can impact disaster preparedness [Citation47]. Therefore, vulnerability studies include economic variables to reduce the impact of future risks.
Table A2 in Appendix 1 illustrates the number and scale of economic variable studies. It was found that income related variables such as GDP per capita can only be used on larger scales, while per capita income and monthly income can be used on neighborhood and city scales. The LULC variable was used in most of the ten studies reviewed, starting at the city scale. Also, integrating the dynamic temporal aspect of the LULC could improve future threat mitigation measures. Gouda [Citation20] used agriculture-related variables in the economic aspect due to the importance of the agricultural sector in the Nile Delta region as an economic base. Although the assessment studies are carried out for coastal regions, the tourist-related variables only appeared in the study by Satta, et al. [Citation36]. We can also conclude from the following matrix that 53% of the reviewed studies included the economic aspect, with 34% of them focusing only on the LULC variable in their vulnerability assessments.
Physical variables
Physical built environment variables are critical in vulnerability assessments, including them in assessment studies helps to reduce socioeconomic vulnerability and provides relevant tools for a comprehensive planning context [Citation18]. As illustrated in Table A3 in Appendix 1
Biophysical variables
Biophysical variables are impact-driven variables that assess the degree of exposure to a certain hazard [Citation5]. Biophysical variables indicate the potential inundation that could impact a coastal region [Citation5,Citation43]. Table A4 in Appendix 1 shows that 65% of assessment studies used relative SLR and 57% used coastal elevation. Note that not all studies using the previous two variables were the same. For example, the neighborhood scale assessments did not use the coastal elevation variable; instead, they worked on the coastal slope, which fits the study scale better and also included the variable of the SLR. Coastal slope, seabed materials, shoreline change rate, land subsidence, tidal range, and average wave height were common variables used by several studies with different spatial scales. The rest of the variables were used based on the approach of each study, focusing on specific details. The matrix shows that 84% of reviewed studies considered biophysical vulnerability.
Coping capacity variables
IPCC defined vulnerability as susceptibility, exposure, and coping, covering input variables required in any vulnerability assessment study [Citation49]. Coping capacity variables are a significant component of vulnerability assessments but are rarely used due to the great efforts and time needed for data collection [Citation45] In vulnerability assessments, 23% included coping capacity, and shore protection structures were the most common variable (Table A5 in Appendix 1)
Coastal vulnerability assessments often focus on biophysical and physical aspects, with an increasing consideration of socioeconomic variables [Citation43]. However, as we reviewed the assessment studies, we found a lack of explanation for variable selection in vulnerability assessment studies. And as shown in Across different scales, relative SLR rate and coastal elevation are commonly used biophysical variables, while local assessments also consider factors such as coastal slope, shoreline change rate, land subsidence, average wave height, tidal range, and seabed material.
Figure 4. Number of documents using each variable across different scales.Source: Authors.
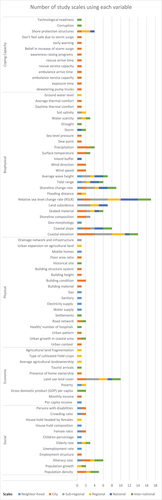
Local assessments commonly overlooked physical, social, economic, and coping capacity variables, except for a few instances where variables such as LULC, population density, and shore protection structures were considered. Social variables such as the elderly rate, illiteracy rate, and population density were more commonly used in local assessments.
After analyzing each study’s methods, study scales, and aspects, we merged them into a single matrix (Fig. A6 in Appendix 2) to identify the method selection patterns and their scales and aspects. Indicator and index-based methods can be conducted on various scales, and integrating different indices can enrich the study’s results. GIS-based methods were mainly conducted for studies from city to regional scales, with a focus on biophysical variables, but some studies included other aspects. Dynamic models work on larger scales and only include physical, biophysical, and coping capacity-related variables.
Gaps and future research needs
The review revealed a number of existing gaps. The first gap refers to the assessment methods used; only three documents adopted the dynamic model method, and the review highlights the importance of integrating several methods that may improve the results of future vulnerability assessments. The second gap refers to the selection of the study’s spatial scale. Only two documents (7.6%) assessed vulnerability at local scales (neighborhood or city scale), with one of them focusing on social vulnerability. Some study locations, such as Kafr el Sheikh, Damietta, and El-Beheira, were included in 35.3% of the studies, while Alexandria and Dakhalia were included in 29.4% of the studies. Port Said was present in 23.5% of the studies, and North Sinai, the north coast, Al-Alamein New City, and El Hammam City were each included in 5.9% of the studies. And only one document (3.8%) assessed the vulnerability of Al-Alamein new city.
The third gap focuses on the variables’ selection. The study highlights that the reviewed documents lack illustrations of the concepts behind the variables’ selection, normalization, and weighting processes. Fig. A7 in Appendix 3 is a network analysis that explains the relationship between the used variables and the reviewed studies; the size of each variable indicates the number of times it was used; the larger it is, the more it was used among the documents. And the more lines connecting it with author names and other variables, the more important and common it is. The network visualization shows that the most frequently used variables are the biophysical ones. The percentage among all studies using each social or economic variable did not exceed 23% except for the LULC variable. Before 2017, the direction of the assessment studies was all directed toward assessing the biophysical variables, and some of them integrated the LULC variables as well. However, starting in 2017 and continuing until 2022, the vulnerability assessment studies started to integrate diverse physical, social, and economic variables, which gave the studies more accuracy in their results. Therefore, it is important to include socioeconomic aspects in coastal vulnerability assessments. Also, it is important to highlight that coping capacity variables did not appear in the previous network visualization. And this indicates that it has been used in a small percentage of the documents. We recommend the inclusion of the coping capacity variables, as they are a main component of the vulnerability assessment, for more realistic results. Also, it was found that only one of the reviewed documents mentioned post-event variables. However, it is highly recommended that variables included in the vulnerability assessments be examined pre- and post-event. Finally, it is worth mentioning that tourist-related variables have been used only in one study and should also be integrated into the vulnerability assessment studies carried out in coastal regions, especially the ones with rich tourist attractions.
Following the individually identified gaps illustrated above. It was crucial to integrate and analyze these gaps collectively across the three components in order to highlight their interrelationships as shown in . This comprehensive approach will provide valuable guidance for future research, directing them toward areas that require further investigation.
Figure 5. Collective chart between the used methods, spatial scale, and variables..
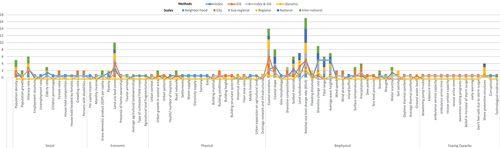
By studying the previous figure and examining each layer separately, the authors have identified future research directions. The accompanying highlights the variables that were missing in each method, which, when included, would enhance the comprehensiveness of the methods. Additionally, the table identifies the scales that have higher priority to be assessed in the future researches using the selected methods and variables. The selection of scales was based on the identified shortage in scales within each method, as well as the gaps identified in the previous chart between each selected method and the different existing scales utilizing each variable.
Table 2. Future research vulnerability assessment approaches.
Conclusion
The study reviewed 26 Egyptian coastal vulnerability assessment documents using content analysis. After conducting this systematic review for our local assessments, we were able to identify existing research gaps that were classified into three parts: used assessment methods, spatial scales, and variables. Due to the dynamic nature of coastal regions, the study advocates for using integrative methods in coastal vulnerability assessments. Moreover, it highlights the importance of integrating temporal-dynamic aspects into vulnerability assessments to consider future projections and changes. Vulnerability assessment cannot be just a snapshot of the current status at one time; it should consider future projections and potential changes. The reviewed studies highlighted a noteworthy absence of variables’ selection justification. And the absence of some variables related to coping capacity aspects and post-event variables, which should be included in future assessment studies. Also, it encourages and directs future research to work on more local spatial scales for more defined and reliable results. The research findings emphasize the significance of reevaluating assessments of vulnerable areas in our local context and provide insights that can be used to provide a more comprehensive and dynamic vulnerability assessment approach.
Disclosure statement
No potential conflict of interest was reported by the author(s).
Notes
1. Appendices (1–3) DOI can be retrieved through the following link
References
- UNDP. National Coastal Vulnerability Assessment and Designing of Integrated Coastal Management and Adaptation Strategic Plan for Timor-Leste. 2018. https://www.undp.org/timor-leste/publications/national-coastal-vulnerability-assessment-and-designing-integrated-coastal-management-and-adaptation-strategic-plan-timor
- IPCC. IPCC SR Ocean and cryosphere, chapter 4: sea level rise and implications for low lying islands, coasts and communities. s.l: s.n. 2019.
- Oloyede M, Williams A, Benson N. A review of coastal vulnerability assessment methods. Int J Clim. 2022;14(2):95–103. doi: 10.18848/1835-7156/CGP/v14i02/95-103
- Nicholls RJ, Wong PP, Burkett V, et al. Climate change and coastal vulnerability assessment: Scenarios for integrated assessment. Sustainability Sci. 2008;3(1):89–102. doi: 10.1007/s11625-008-0050-4
- Nguyen TATX, Bonetti J, Rogers K, et al. Indicator-based assessment of climate-change impacts on coasts: a review of concepts, methodological approaches and vulnerability indices. Ocean Coast Manag. 2016;123:18–43. doi: 10.1016/j.ocecoaman.2015.11.022
- Klein, Richard J. T., Nicholls, Robert J. Assessment of Coastal Vulnerability to Climate Change. JSTOR. 1999;28(2):182–187 (6 pages). https://www.jstor.org/stable/4314873
- Birkmann Jo¨rn. Indicators and criteria for measuring vulnerability : theoretical bases and requirements. In Measuring vulnerability to natural hazards : towards disaster resilient societies. UNU-Press; 2006. p.55–77.
- Ali Elham, Cramer Wolfgang, Carnicer Jofre, et al. Cross-Chapter Paper 4: Mediterranean Region. In: Climate Change 2022: Impacts, Adaptation and Vulnerability. Contribution of Working Group II to the Sixth Assessment Report of the Intergovernmental Panel on Climate Change. Cambridge University Press; 2022.
- Torresan Silvia, Furlan Elisa, Critto Andrea, et al. Egypt’s coastal vulnerability to sea‐level rise and storm surge: present and future conditions. Integrated Environmental Assessment and Management. 2020;00(00):1–12.
- El Raey Mohamed. Impacts and Implications of Climate Change for the Coastal Zones of Egypt. Coastal zones and climate change. Vol. 7. Washington, DC: The Henry L. Stimson Center; 2010. p. 31–50.
- Sharaan M, Iskander M, Udo K. Coastal adaptation to sea level rise: an overview of Egypt’s efforts. Ocean Coast Manag. 2022;218:106024. doi: 10.1016/j.ocecoaman.2021.106024
- Glavovic Bruce, Dawson Richard, Chow Winston, et al. Cross-Chapter Paper 2: Cities and Settlements by the Sea. In: Climate Change 2022: Impacts, Adaptation and Vulnerability. Contribution of Working Group II to the Sixth Assessment Report of the Intergovernmental Panel on Climate Change. Cambridge, UK and New York, NY, USA: Cambridge University Press; 2022.
- Page MJ, et al., 2020. The PRISMA 2020 statement: an updated guideline for reporting systematic reviews, s.l.: BMJ.
- Mohamed SA. Coastal vulnerability assessment using GIS-Based multicriteria analysis of Alexandria-northwestern Nile Delta, Egypt. J Afr Earth Sci. 2020;163:103751. doi: 10.1016/j.jafrearsci.2020.103751
- Emam WW, Khalil MT, Nassif MG, et al. Applying geospatial technology in assessing the coastal vulnerability of zaranik protectorate to sea-level rise. Egypt J Aquat Biol Fish. 2019;23(4):697–719. doi: 10.21608/ejabf.2019.202267
- Frihy OE. Evaluation of future land-use planning initiatives to shoreline stability of Egypt ’s northern Nile delta. Arabian J Geosci. 2017;109(10). doi: 10.1007/s12517-017-2893-4
- Hereher ME. Coastal vulnerability assessment for Egypt’s Mediterranean coast. Geomatics Nat Hazards Risk. 2015;6(4):342–355. doi: 10.1080/19475705.2013.845115
- Waly NM, Ayad HM, Saadallah DM. Assessment of spatiotemporal patterns of social vulnerability: A tool to resilient urban development Alexandria, Egypt. Ain Shams Eng J. 2021;12(1):1059–1072. doi: 10.1016/j.asej.2020.07.025
- Hzami A, Heggy E, Amrouni O, et al. Alarming coastal vulnerability of the deltaic and sandy beaches of North Africa. Nature. 2021;11(1). doi: 10.1038/s41598-020-77926-x
- Gouda Dalia M. Climate Change, Agriculture and Rural Communities’ Vulnerability in the Nile Delta. In Omran El-Sayed Ewis, Negm Abdelazim M, editors. Climate Change Impacts on Agriculture and Food Security in Egypt. 1st ed. Springer Cham; 2020. p. ;525–576. doi:10.1007/978-3-030-41629-4
- Schilling J, Hertig E, Tramblay Y, et al. Climate change vulnerability, water resources and social implications in North Africa. Reg Environ Change. 2020;20(1). doi: 10.1007/s10113-020-01597-7
- Oloyede Mary O, Benson Nsikak U, Williams Akan B. Climate change and coastal vulnerability assessment methods: A review. International Conference on Energy and Sustainable Environment, 23-25 June 2020, Covenant University, Nigeria. United Kingdom: IOP Publishing Ltd; 2021; 665. doi: 10.1088/1755-1315/665/1/012069
- Abdrabo MA, Abdelwahab RG, Hassaan MA. Urban dynamics and potential vulnerability of coastal urban areas to sea level rise in the southeastern Levantine Basin. Urban Climate. 2022;44:101212. doi: 10.1016/j.uclim.2022.101212
- Abdelgawad D, Dwidar S, Abdelsattar A, et al. Using flood map analysis for coastal city resiliency and sea rise level adaptation plan. IOP Conference Series: Earth And Environ Sci. 2022;1026(1):012038. s.l., s.n. doi: 10.1088/1755-1315/1026/1/012038
- Marzouk M, Attia K, Azab S. Assessment of coastal vulnerability to climate change impacts using gis and remote sensing: a case study of Al-Alamein new city. J Clean Prod. 2021;290:125723. doi: 10.1016/j.jclepro.2020.125723
- Solyman A, Monem TA. Mapping Egypt vulnerability to sea level rise scenarios. In: Climate change impacts on agriculture and food security in Egypt. s.l: Springer Water; 2020. pp. 183–201. doi:10.1007/978-3-030-41629-4_9.
- Refaat MM, Eldeberky Y. Assessment of coastal inundation due to sea-level rise along the Mediterranean Coast of Egypt. Mar Geod. 2016;39(3–4):290–304. doi: 10.1080/01490419.2016.1189471
- Hasan E, Khan SI, Hong Y. Investigation of potential sea level rise impact on the Nile Delta, Egypt using digital elevation models. Environ Monit Assess. 2015;187(10). doi: 10.1007/s10661-015-4868-9
- Batisha AF. Implementing fuzzy decision making technique in analyzing the Nile Delta resilience to climate change. Alexandria Eng J. 2015;54(4):1043–1056. doi: 10.1016/j.aej.2015.05.019
- Zaid SM, Mamoun MM, Al-Mobark NM. Vulnerability assessment of the impact of sea level rise and land subsidence on north Nile Delta region. World Appl Sci J. 2014;32:325–342.
- Hassaan MA, Abdrabo MA. Vulnerability of the Nile Delta coastal areas to inundation by sea level rise. Environ Monit Assess J. 2013;185(8):6607–6616. doi: 10.1007/s10661-012-3050-x
- Hassaan MA. GIS-based risk assessment for the Nile Delta coastal zone under different sea level rise scenarios case study: Kafr EL Sheikh. J Coast Conserv. 2013;17:743–754. doi: 10.1007/s11852-013-0273-0
- ElMasry EA, El-Sayed MK, Awad MA, et al. Vulnerability of tourism to climate change on the Mediterranean coastal area of El Hammam–EL Alamein, Egypt. Environ Dev Sustain. 2022;24(1):1145–1165. doi: 10.1007/s10668-021-01488-9
- Baumert N, Kloos J. Anticipating emerging risks and vulnerabilities from sea level rise induced preventive resettlement in greater Alexandria, Egypt. In: Environmental change and human security in Africa and the Middle East. s.l: Springer International Publishing; 2017. pp. 133–157.
- Elboshy B, Kanae S, Gamaleldin M, et al. A framework for pluvial flood risk assessment in Alexandria considering the coping capacity. Environ Syst Decis. 2019;39(1):77–94. doi: 10.1007/s10669-018-9684-7
- Satta A, Puddu M, Venturini S, et al. Assessment of coastal risks to climate change related impacts at the regional scale: The case of the Mediterranean region. International Journal Of Disaster Risk Reductionquery. 2017;24:284–296. doi: 10.1016/j.ijdrr.2017.06.018
- Vousdoukas MI, Clarke J, Ranasinghe R, et al. African heritage sites threatened as sea-level rise accelerates. Nature Clim Change. 2022;12(3):256–262. doi: 10.1038/s41558-022-01280-1
- Elshinnawy IA, Almaliki AH. Vulnerability assessment for sea level rise impacts on coastal systems of Gamasa Ras El Bar Area, Nile Delta, Egypt. Sustainability. 2021;13(7):3624. doi: 10.3390/su13073624
- Sharaan M, Udo K. Projections of future beach loss along the mediterranean coastline of Egypt due to sea-level rise. Appl Ocean Res. 2020;94: doi: 10.1016/j.apor.2019.101972
- Ichim Tiberiu, Ramieri Emiliano, Hartley Andrew, et al. Methods for assessing coastal vulnerability to climate change. (no. Technical Paper 1). Bologna, IT: ETC/CCA; 2011.
- Mahapatra M, Ratheesh R, Rajawat AS. Sea level rise and coastal vulnerability assessment: A review. Int J Geol Earth Environ Sci. 2013;3:67–80.
- Abuodha PA, Woodroffe CD. International assessments of the vulnerability of the coastal zone to climate change, including an Australian perspective. s.l: s.n; 2006.
- VanZomeren C, Acevedo-Mackey D. A review of coastal vulnerability assessments: definitions, components, and variables. (no. ERDC/EL SR-19-5). U.S.: Environmental Laboratory, Engineer Research and Development Center; 2019. doi: 10.21079/11681/33289
- Torresan S, Critto A, Dalla Valle M, et al. Assessing coastal vulnerability to climate change: comparing segmentation at global and regional scales. Sustain Sci. 2008;3(1):45–65. doi: 10.1007/s11625-008-0045-1
- Moreira LL, Brito MMD, Kobiyama M. Review article: A systematic review and future prospects of flood vulnerability indices. Nat Hazards Earth Sys Sci. 2021;21(5):1513–1530. doi: 10.5194/nhess-21-1513-2021
- Hinkel J. “Indicators of vulnerability and adaptive capacity”: Towards a clarification of the science–policy interface. Glob Environ Change. 2011;21(1):198–208. doi: 10.1016/j.gloenvcha.2010.08.002
- Lima CO, Bonetti J. Bibliometric analysis of the scientific production on coastal communities’ social vulnerability to climate change and to the impact of extreme events. Nat Hazards. 2020;102(3):1589–1610. doi: 10.1007/s11069-020-03974-1
- IPCC. Contribution of working groups I, II and III to the fifth assessment report of the intergovernmental panel on climate change. In Core Writing Team, Pachauri RK, Meyer LA, editors. Climate Change 2014 Synthesis Report. Geneva, Switzerland: IPCC; 2014. p. 151.
- Romieu E, Welle T, Schneiderbauer S, et al. Vulnerability assessment within climate change and natural hazard contexts: revealing gaps and synergies through coastal applications. Sustainability Sci. 2010;5(2):159–170. doi: 10.1007/s11625-010-0112-2