
ABSTRACT
The purpose of this article is to characterize and examine the possible uses of Mashashe deposits (clay [MC] and its overburden [OD]), which incorporate industrial wastes (cement kiln by-pass [CKD], water-cooled slag [WCS]), to create alkali-activated binders. For this purpose, six mixes (M-1 to M-6) were investigated, while the calcined clay (MCC) was partially replaced by CKD and calcined overburden deposits (COD) at different ratios (0%, 1.5%, and 3 wt.%). Additionally, a NaOH solution containing 10 and 8 M of alkali was utilized. The raw clay sample and its overburden were collected from Wadi Mashashe area (north-central Sinai, Al-Arish city, Eastern side of Gabal Libni, Egypt), then were calcined [MCC, COD] at 850°C to increase the reactivity. The used materials and lab-made cured specimens were characterized by various analytical methods and techniques including XRF, thermal analyses, infrared spectroscopy, X-ray diffraction, and scanning electron microscopy. The physio-mechanical characteristics and fire durability test results were determined after the hardened laboratory cubes were cured for 7 and 28 days. According to the results, the ratio of CKD or COD of 1.5% (M-3 and M-5) revealed the most suitable mixture used in manufacturing the alkali-activated binder. The most promising results were for mix M-1 followed by mix M-5, while the worst results were for mixes M-2 and M-6. Therefore, mixes of M-1, M-5, and M-3 have the most potential usage to produce alkali-activated binders.
Introduction
Many studies have been conducted to identify materials that support sustainable evolution to the growing demand for building materials. Portland cement Production is a power and resource strenuous consumption procedure that emits a major CO2 gas emission [Citation1]. Moreover, many research papers are driven to propose new hydraulic binders to replace Portland cement for economic and environmental concerns. Inorganic polymers (Alkali-Activated Binders (AAB) and geopolymer) exhibited encouraging potentials between these hydraulic binders [Citation2–4].
A chemical process called alkaline activation of materials rapidly converts some partially or completely amorphous structures into dense cemented frameworks [Citation5]. The frequently used raw material sources are typically alumino-silicate rich such as thermally activated clays, steel slags from blast furnaces, and natural pozzolans.
Alkali-Activated Materials (AAM) are frequently used when the source materials are rich in silicate and calcium, using low to mid concentrations of alkali solution yield AAM, which has C-S-H as a main strength-gaining component [Citation6]. Using clay as a substitute source for the materials used to make geopolymers is a possibility. Clay persists as a cheap resource that is widely accessible, making it a trustworthy source for the synthesis of geopolymers. The most significant aspect that establishes the large-scale manufacture of geopolymeric materials is the accessibility of alumino-silicate resources. Moreover, significant contributions are proposed to calcined kaolinitic clay for AAB production at different temperatures [Citation7–9]. Hardly are montmorillonite, illite, and other clay minerals used in geopolymers production. The chemical diversity of clay minerals and the variability in their thermal activation properties [Citation10,Citation11] make it difficult to decide if clay resources can still be exploited to produce geopolymers. The utilization of construction and industrial wastes to create AAM has received a lot of attention in publications [Citation12]. Recyclable wastes can reduce the need for natural resources and energy, and they can improve the efficiency of AAB that is created artificially [Citation13–15].
It is not widely accepted that low-grade clay may be used for the synthesis of geopolymers, with limited studies published in the literature. The widespread availability of low-grade clay makes it a potentially highly suitable alternative for large-scale production of geopolymer. However, the internal structure of low-grade clays makes them less reactive toward geopolymerization compared to other resources. Therefore, pretreatment techniques are required to alter the structure of the clay and increase its reactivity toward geopolymerisation [Citation16].
The reactive amorphous phase becomes an unreactive crystalline phase after the calcination technique, which is frequently performed between 800°C and 950°C [Citation17]. However, longer calcination times resulted in less reactivity of the calcined precursor. This study focused on the potential utilization of low-grade Mashashe clay (MC) and its overburden deposits (OD) incorporating cement industry waste (CKD) and water-cooled steel slag (WCS) using various NaOH ratios in the synthesis of AAB based on clay-steel slag-based mixes. Various analytical means and standard specifications were used to evaluate the results of the used materials and lab-made hardened specimens of changed mixtures at different curing days. These were conducted to achieve the most promising mix design for alkali binders’ fabrication. This work is one of the earliest attempts in Egypt to use Mashashe deposits and industrial wastes at contributing toward the manufacture of geopolymers.
Geological setting
The sedimentary succession where the studied samples were taken is in the Wadi Mashashe area, North-central Sinai, Eastern side of Gabal Libni, 63 km south Al-Arish city, Egypt. The rocks of the succession, which dates from the Cenomanian to the Quaternary, are thick deposits that developed in Gabal Libni and identify from youngest to oldest are the Khaboba, Egma/Thebes, Esna, Sudr, Wata, Abu Qada, and Halal formations. In addition, recent Quaternary sediments cover it. This sequence is located between El-Halal-Gabal Libni and Umm Asagil anticlines in a significant synclinal depression [Citation18] with a NE-SW trend ().
Figure 1. Gebel Libni and Wadi Mashashe region of North-central Sinai, Egypt shown on a geological map [Citation18].
![Figure 1. Gebel Libni and Wadi Mashashe region of North-central Sinai, Egypt shown on a geological map [Citation18].](/cms/asset/00b4e2b9-6988-4656-bfe4-7b9bb23ce810/thbr_a_2243176_f0001_oc.jpg)
The utilized clay sediments are visible as wadi banks or terraces from field observations, and they are typically buried in quaternary sediments. However, a quarry with around 27 m of these clays is reachable east of Gabal Libni at Longitude 33′ 54′ 00′ E and Latitude 30° 44′ 54′ N. Similar clay deposits are described in several wells; they reach a thickness of around 50 m, and the clay’s basis is not revealed [Citation19]. According to the Gabal Libni Quadrangle geological map, Mashashe clay is part of the Paleocene Khaboba Formation [Citation18]. The overburdened sediments are removed and discarded away during the quarrying process to obtain raw clay.
Materials and methods
Materials
During this investigation, the raw materials were Mashashe clay (MC) and overburden deposits (OD) where the industrial materials used were cement kiln dust (CKD) and water steel slag (WCS), as well as alkaline NaOH solution was used. The CKD material was reprocessed as an auxiliary active source of calcium. Steel slag and Mashashe clay were used as binder sources. The raw materials were extracted from the Wadi Mashashe region (north-central Sinai, Egypt) where a representative clay sample from the clay quarry was collected. Used raw clay sample was dried, crushed, and sieved using a 1 mm sieve. Due to the poor reactivity of the used low-grade clays, it was treated thermally to change their structure and increase their reactivity. As a result, the used clay sample was thermally treated to obtain a more reactive amorphous phase and a large surface area for geopolymer formation [Citation16]. The calcination regime was 850°C for 2 h and 10°C/min in a programmable electric furnace. The 850°C temperature is mostly the ideal temperature for creating a good alkali activated binder. This theory is supported by a prior investigation at how the geopolymerization reaction can be affected by heating a raw clay material [Citation20]. After being calcined, the clay was cooled to room temperature.
Mashashe calcined clay sample (MCC) was sieved through a 90 μm mesh size sieve. The overburdens (OD) were collected from the upper detrital surface succession in the clay quarry area which varies in thickness from 0.35 to 18.80 m. The overburden selected sample was fired at the same calcination regime as the clay sample. The used CKD is a fine, gray-colored powder by-product and is generated in the cement factory (north Sinai, Egypt) during the calcination process in the kiln. The used slag is a water-cooled slag. It was brought from the Turkish Iron and Steel Company. The sample was crushed, ground, and screened at a 90 μm sieve diameter. Two concentrations of 8 and 10 moles of NaOH were used. From the lab initial trials, it was found that 10 M was the optimum dose in the case of no CKD additions and 8 M was used in the case of additions of CKD to avoid the efflorescence on the surface of cubes. Sodium hydroxide (99% pure grade, El Gomhouria Company for Selling Medical Appliances and Chemicals, Egypt) was utilized as a source alkaline activator. In an alkaline media, the rate at which alumino-silicate solids dissolve is directly proportional to their outer surface area [Citation21].
Techniques and analyses
The collected raw materials and the lab-made specimens were mineralogically characterized by the powder X-ray diffraction (XRD). A monochromatic Cu-K radiation source was installed on the X’Pert PRO PW3040/60 (PANalytical, the Netherlands) diffractometer, which was utilized for XRD. At 40 kV and 30 mA, the test was conducted. With a scanning speed of 2°/min, data was gathered continuously in the 2θ range between 5° and 50°. X’Pert high score software, which utilizes a PDF-2 database, was used to identify the obtained data. An Axios sequential spectrometer (PANalytical, the Netherlands) was used to conduct X-ray fluorescence (XRF) in order to evaluate the chemical composition of the raw materials. Additionally, the conventional manual techniques outlined in ASTM D7348–21 [Citation22] for determining the loss on ignition were used. The prepared alkali-activated specimens of different mixes were tested for bulk density, compressive strength, and water absorption at specific days 7 and 28. According to the ASTM standard specification, these characteristics were completed [Citation23].
Thermal analyses utilizing the thermal analyzer: DT 50 (Shimadzu Co., Kyoto, Japan) were used to identify the mineralogy and weight loss components of the clay sample using differential thermal analysis (DTA) and thermo-gravimetric analysis (TGA), with a heating rate 20°C/min in an ambient atmosphere and a heating temperature of up to 1000°C. Total weight loss was also identified. To investigate the changes in Si – O and Al – O bond lengths also, identify the functional groups in molecular bonds that vibrate at distinctive frequencies, particularly for the produced poorly crystalline alkali-activated components, Fourier Transform Infrared (FTIR) spectroscopy was used. A Thermo-Fischer spectrophotometer (Nicolet 6700, USA) was used. The scan was carried out at a speed of 0.5 cm/s, with a resolution of 4 cm−1, between 4000 and 400 cm−1. Powdered alkali-activated mixes were dried at 105°C to remove the water content in the sample and stop the ongoing alkali activation reaction. 2 mg of the dried powders of different mixes were mixed with 200 mg potassium bromide (KBr) and then pressed as a small disk and inserted inside the instrument for FTIR analysis. Additionally, the fractured pieces of diverse specimens were subjected to scanning electron microscopy (SEM, JEOL JSM 6510, Japan) and energy-dispersive X-ray analysis (EDAX) in order to characterize the changes in their microstructure and morphology.
Mix processing and specimen preparation
With a view to determining how a Mashashe calcined clay (MCC), cement kiln dust (CKD), and calcined overburden deposits (COD) with the presence of water-cooled steel slag (WCS) at different NaOH molarities on the properties of the formed alkali-activated binders, six MCC-WCS mixtures namely M-1(control mixture), M-2, M-3, M-4, M-5, and M-6 were designed for this study. The solid -to liquid – ratio (S/L) was around 3.3 to maintain workability. summarizes data of mixes designation. To process the experimental work, NaOH solution of different concentrations was prepared of 8 and 10 molar ratios and left to cool for at least 20 h. In addition, the mix materials were combined for 2 min in an electrical mixer. Once a homogenous paste was formed, the prepared molar ratio of NaOH solution was gradually added to the mixture and mixed in an electric mixer. After that, the paste was discharged to 2.0 cm side-length steel cubic molds. After the bubbles were taken out, the mold was carefully covered. The fresh pastes were maintained in the molds inside the dryer at 40°C for 24 h before demolding. After 24 h, the hardened samples were demolded and cured at room ambient conditions 0of 25 ± 2°C and relative humidity of 65 ± 5% till the testing times of 7 and 28 days.
Table 1. Compositions and proportions of the studied mixes (wt. %), NaOH solution molarities and liquid/solid ratios.
The same method was used to create each mix while changing the composition, ratios, and solution molarity. After the curing process was complete, several tests were conducted to ascertain the chosen characteristics of the hardened cubes in terms of water absorption, bulk density, apparent porosity, and compressive strength testing [Citation24].
Finally, the specimens were dried at 105°C for 24 h to prevent further reaction. Moreover, specimens of mix-1 were fired at different temperatures of 200°, 400°, 500°, 600°, 700°, and 800°C to evaluate the durability of the hardened cubes against fire, after reaching the required temperature degree, the specimen was out immediately from the furnace to simulate the reality of fire extinguishing process on the concrete structure. The effect of firing was evaluated using the compressive strength test and visual detection observation.
Results and discussion
Characterization of the materials
Chemical analysis
outlines the materials utilized, as well as their chemical composition and loss on ignition (LOI). Mashashe clay (MC) shows the major elemental oxides of SiO2 and Al2O3 as well as Fe2O3 and CaO. The CaO content may reveal the presence of carbonates. However, the oxide composition of the sample achieves the most common chemical composition of low-grade Egyptian clay.
Table 2. Compositions of the utilized materials’ oxides and the amount of loss on ignition.
The water-cooled slag’s elemental composition is also revealed, with the sample being predominantly made up of SiO2, CaO, and Al2O3, as well as MgO and traces of other oxides. According to the following equation [CaO + MgO + Al2O3)/SiO2], the used slag’s (WCS) hydraulic activity is equivalent to 1.29. The formula’s expected outcome should be ≥1.0 in the majority of nations and ≥1.4 in Germany to predict good compressive strength of blended materials or hydraulic reactivity of slags [Citation25]. The overburdened sample (OD) consists mainly of SiO2, CaO as well as Al2O3 and Fe2O3. The SO3 content found in the OD may occur due to gypsum.
The analyzed CKD sample shows the primary oxides of CaO and SiO2 as well as minor amounts of MgO, K2O, and SO3. Also, it was observed that the CKD sample has an amount of soluble salts. Mashashe clay and overburden samples after calcination show a noticeable increase in all oxides compared with the unfired samples, except for the values of loss on ignition and volatile components of SO3 and Cl−. Ca/Si ratio had been calculated after the chemical analysis made by XRF. According to mixes ratio given in , the averaged ratio was 0.50 and this is nearly around the optimum value (0.6–0.8) for Ca/Si molar ratio for most alkali activated binder and this value may need to increase for producing binder. In addition, the averaged value of the Na/Al molar ratio was 0.14. It is worth mentioning that the recommended ratios used in the synthetic alkali activated binder around 0.4:1.5 [Citation26]. Overall, both Ca/Si and Na/Al ratios are important parameters to be considered for designing and optimizing the alkali activated binders for specific applications.
Thermal analyses
In DTA, the temperature at the x-axis while ΔT at the y-axis are shown. Regarding the baseline, the exothermal effects are depicted as upward peaks and the endothermic effects as downward. A differential thermal analysis was performed on the used clay sample as presented in . The acquired data were interpreted based on Ramachandran et al. [Citation27].
Figure 2. TGA and DTA graphs of MC sample applied.
The DTA thermogram displays a low-temperature endothermic peak around 88.5°C, which indicates that kaolinite, montmorillonite, and illite have mostly undergone dehydration (moisture removal). It was noted that the sedimentary illite losses its water around 100°C. The peak at 288.4°C can be attributed to the goethite mineral’s [FeO (OH)] dehydration. Alternatively, this peak is a result of the illite and montmorillonite formations’ interlayer water losing their structure. The elimination of structural OH from kaolinite, illite, and montmorillonite lattices is represented by an endothermic minor peak at 543.7°C. The appearance of excessive structural iron in the smectite’s octahedral layer may be responsible for the samples’ comparatively low peak dehydroxylation temperatures. The moderate endothermic reaction peak found at 697.7°C may be due to the decomposition of carbonates in the MC sample and release of CO2 gas. The last structural breakdown of clay minerals that had not yet been completely eliminated may be the primary cause of the tiny curve at a high temperature of 850°C. This temperature was chosen for the calcination of the raw samples to ensure from reaching the amorphous phase, and new crystalline phases are not formed yet.
However, as they are structurally high, this system peak is not accompanied by any weight reduction. All of the samples’ identified endothermic peaks are accompanied by a weight loss (TGA) of 23.5% overall.
Mineralogical composition (XRD)
show XRD patterns of the used materials. It was observed in the XRD pattern of MC that the clay minerals are montmorillonite, illite, and kaolinite, whereas the non-clay minerals are gypsum, quartz, and calcite. After calcination, the detected crystalline phases are albite, quartz, hematite, and anhydrite (conversion of gypsum). The clay minerals completely disappeared due to their full destruction during the firing. The presence of albite and quartz suggests that they are heat-resistant minerals.
Figure 3. Used raw clay (MC) and overburden (OD) samples’ XRD patterns.
Figure 4. XRD patterns of the used industrial wastes of CKD, WCS and calcined clay (MCC) sample.
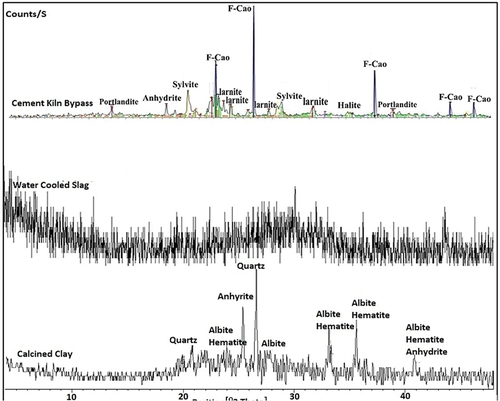
Major minerals are portlandite, anhydrite, and halite, with sylvite and larnite as minor minerals. The XRD pattern of the used slag is entirely amorphous with a characteristic hump between 2θ = 25–35°. This result means that the used slag is of water-cooled type.
FTIR analysis
The raw Mashashe clay (MC) and its calcined class (MCC) FT-IR spectra appear in and can be observed in the 4000–400 cm−1 region. The found bands were interpreted as recorded by Jozanikohan et al. [Citation28] and Rahman et al. [Citation17]. The low-intensity absorption bands located around in 3600–3700 cm−1 represent stretching vibrations in the internal surface of hydroxyl groups attributed to kaolinite and illite minerals. These disappeared in the spectra of the MCC due to the destruction of the kaolinite during firing. The broad characteristic band observed in the range between 3400 and 3450 cm−1 and at 1630 cm−1 are assigned to the deformation vibration bands correlated with the H-O-H of water that was absorbed (MC) and adsorbed water (MCC). These bands decrease in intensity in the MCC due to calcination.
Figure 5. FTIR comparison spectra of Mashashe clay (MC) and Mashashe calcined clay (MCC). [1: O-H bond elongation vibration 2: vibration bending for Al-OH, 4: H-O-H elongation vibration, 5:elongation of Si-O-Si, 6: Al-OH elongation vibration, 7: O-H deformation of Fe+3 8: Si-O-Si stretching vibration, 9: Si-O-Si elongation vibration, 10: elongation vibration of Al-O-Si bond, 11,12: Si-O-Si elongation vibration bond, 13: Si-O-Fe elongation mode].
![Figure 5. FTIR comparison spectra of Mashashe clay (MC) and Mashashe calcined clay (MCC). [1: O-H bond elongation vibration 2: vibration bending for Al-OH, 4: H-O-H elongation vibration, 5:elongation of Si-O-Si, 6: Al-OH elongation vibration, 7: O-H deformation of Fe+3 8: Si-O-Si stretching vibration, 9: Si-O-Si elongation vibration, 10: elongation vibration of Al-O-Si bond, 11,12: Si-O-Si elongation vibration bond, 13: Si-O-Fe elongation mode].](/cms/asset/3e70bafc-8749-4b12-a174-c985922dc472/thbr_a_2243176_f0005_oc.jpg)
The two narrow and small intenseness absorption bands at 3698 and 3622 cm−1 are consequent to tension vibrations of OH of montmorillonite, illite and kaolinite minerals. The asymmetric C-O stretching attributed to carbonation is seen by the band on 1440 cm−1 in the MC sample. This band vanished from the MCC sample’s spectrum. The bands of absorption between 400 and 1 150 cm−1 are generated by Si-O & Al-O OH bending vibrations. The detected band at 1040 cm−1 has been referred to the T-O stretching mode and represents the asymmetrical mode of Si-O-Si vibration. The presence of large broad bands located between 1050 to1000cm−1 is associated with Si-O stretching bands in kaolinite and montmorillonite. Carbonate stretching has been attributed to the absorption band at 1420 cm−1. Si-O-T is responsible for the peaks at 880 cm−1 & 900 cm−1 (asymmetrical vibration)
Mostly from the kaolinite, as the MCC spectra do not show it. The OH- bending vibrations of six distinct sets of hydroxyls (gibbsite) in the clay material correspond to three intense bands at 915, 1033, and 1060 cm−1, which are missing in the spectra of the MCC sample. Presumably, the deformation vibration of Al-OH in kaolinite is thought to be responsible for the frequency band at 915 cm−1. Compared to the FTIR samples spectra between 900 and 800 cm−1, this leads us to conclude that the kaolinite spectra found in the spectra of the MC sample was broken down during the calcination temperature applied (850°C). Illite cannot be converted to an amorphous substance at this temperature. Si-O stretching bands of silica are thought to be responsible for the peaks at 794 cm−1 & 667 cm−1.
In the MC sample, peak on 536 cm−1 is caused by Si-O-Al bending vibrations from kaolinite or illite. This peak is lost in the spectra of the MCC sample due to the calcination; this is in line with the kaolinite conversion shown in the XRD data. The Si-O in-place bending vibration or the Fe-O-T might be the reason for the peak at 470 cm−1. In addition, bands arising on 470 cm−1 may refer to the stretching mode of Si-O-Fe and are placed in the T-O bending mode (where T is either Si or Al).
Also, weak band peaks in the region between 500 and 650 cm−1 overlapped with OH bending vibrations and Al-O vibrations. Moreover, in all the spectra, the bands at 470–440 cm−1 are ascribed to the stretching bands of Si-O-Si in montmorillonite and illite, and vibration bending mode of Si-O in kaolinite, respectively. However, the absorption bands that fall between 400 and 1200 cm−1 are caused by vibrations of Al-O and Si-O bending OH.
In the spectral region between 400 and 4000 cm−1, the clay’s IR spectra before and after 850°C calcination demonstrate that the degradation of kaolinite (3700–3600 cm−1) is what causes the O-H bands to vanish. It also mentions that distinct bands of Si-O are observed between 1200 and 800 cm−1 following calcination at 850°C, at the expense of the destroyed/reduced clay minerals, which are consistent with the effects of temperature. Thus, the temperature of calcination utilized is adequate to convert kaolinite into meta-kaolinite.
SEM analysis
The surface morphology and EDS results of the bulk clay (MC) and water-cooled steel slag (WCS) samples are presented in , respectively. The SEM images of the MC () sample appear as agglomerated flaky-like particles of irregular shape with fluffy appearance of kaolinite (light color) and montmorillonite (dark color) minerals, while the SEM image of shows to be fluffier with a more consistent texture than the particles in . Also, images have particles of different sizes and distributions wherein seem that the particles are bi-modal and mono-modal in . Significant peaks for oxygen, aluminum, and silicon can be seen in the EDX spectrum (), in parallel with weaker peaks for magnesium, traces of Sulfur, and sodium. The peak height of the silicon: aluminum ratio approximates 2:1, which is what would be expected for montmorillonite. Unexpectedly, even though XRD results revealed a significant quantity of quartz impurities. In the SEM images, no identifiable quartz grains could be discovered. shows SEM images of water-cooled sample (WCS) and its elemental composition using EDS. The molten slag is quenched in water to become WCS, where molten steel slag rapidly cools and solidifies into a product that resembles glassy sand.
Figure 6. SEM images of different magnifications for MC sample (a, b) and its EDX spectrum of elemental composition (c).
Figure 7. SEM images of different magnifications for WCS sample (a, b) and it’s EDX spectrum of elemental composition (c).
The images of show almost variable sizes and sharp edges of tabular-shaped particle morphology. The results of the EDS analysis () match the results of the XRF analysis.
Characterization of hardened cubes of different mixes
Mineralogical composition
The XRD patterns for hardened alkali activated samples of different mixtures (M1-M6) are shown in . The main crystalline peaks in all patterns were quartz (SiO2) and calcite (CaCO3). In (with or without CKD), mix M-1 shows the presence of albite (NaAlSi3O8) and gypsum (CaSO4.2 H2O). Patterns of mixes M-2 and M-3 show that gypsum disappeared, and halite appeared but it was masked by albite in mix M-2. The XRD patterns show a characteristic hump between 2θ = 25° − 30° which is clearly shown in mix M-1 (10 M) and decreased vigorously up to mix M-3. This hump is evidence of the production of geopolymer, which in turn indicates the existence of amorphous gel [Citation29]. As a result, the added CKD as a waste material lowers the level of alkali-activation reaction. The low formation of alkali activated binder and pozzolanic reaction in mixes M- 2 and M-3 may be attributed to the low molarity used (8 M).
Figure 8. XRD patterns of hardened alkali-activated mixes (M-1 to M-3) (Q: Quartz, A: Albite, H: Halite, G: Gypsum and C: Calcite,).
Figure 9. XRD patterns of hardened alkali-activated mixes (M-4 to M-6) (G: Gypsum; Q: Quartz; C: Calcite).
Unfortunately, the use of more molarity in these mixes led to effloresce of the hardened products and hindered the progress of the alkali-activated formation [Citation30]. In (contains CKD and COD), mix M-4 shows a very weak geopolymer hump and an increase in calcite intensity due to the addition of COD (3.0 wt.%). In mix M-5 (1.5 wt. % of COD), a geopolymer hump was obviously observed and gypsum was formed only in this mix according to the favorable formation conditions. Gypsum’s existence improved the alkali-activated products’ physico-mechanical characteristics, particularly in the early stages of curing [Citation31]. Also, in mix 6 a very weak geopolymer hump was observed.
Physico-mechanical properties
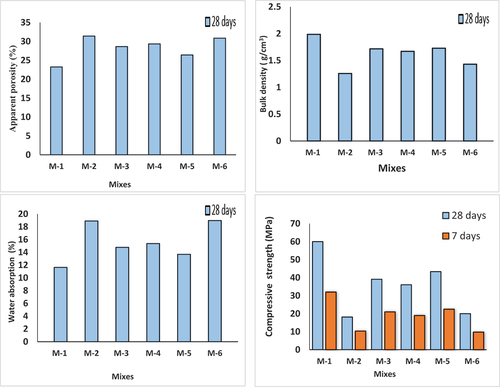
In , the average results of the physico-mechanical characteristics of alkali-activated specimens synthesized from various mixes and cured at 28 days are shown graphically. Mixture M-1 (control mix, without waste addition) has the highest bulk density (1.99 g/cm3), and the lowest value was for Mix M-2 (1.25 g/cm3) that contains 3% CKD. This was caused by the low specific density of CKD, which is normally in the range of 2.6–2.8. The mix M-4 that contains 3% COD has a moderate value (1.67 g/cm3). The lowest values have been attained by the addition of CKD as shown in mixture M-2, mixtureM-6 and mixture M- 3compared to the additions of COD (mixes 4 and 5). The highest bulk density was found for the specimens of mixture M-1, mixture M-5, and mixture M-3 that contain no waste, 1.5 COD and 1.5 CKD, respectively. This is explained by the development of the alkali-activation process, which is supported by the XRD patterns. Results appear from apparent porosity and water absorption matched with results for bulk density in an opposite trend, i.e. Mixtures M-1, M-5, and M-3 had the lowest water absorption and apparent porosity values. The presence of open pores in the specimens might be viewed as the cause of the reduction in bulk density. Alkali-activated specimens showed that the compressive strength increased with increasing bulk density, other than water absorption and apparent porosity decreased. The positive properties can be attributed to the appearance of characteristic amorphous hump (geopolymer formation), low carbonate content and occurrence of gypsum as supported by XRD results. The most promising mix containing waste was mixture M-5 that incorporated 1.5 wt. % of COD. The excess of alkalis in CKD mixtures leads to lowering of the mechanical and physical properties as a result of hindering progress in the formation of alkali activated products leading to an increase of matrix porosity [Citation30].
Figure 10. Effect of mixtures on the characteristics of specimens with alkali activation after 28 days of curing.
Firing test and visual detection
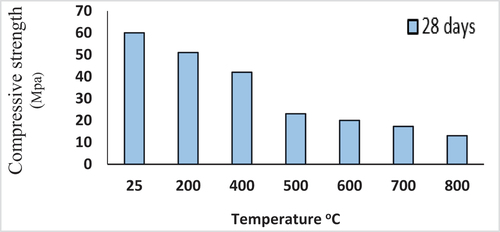
Measurements of compressive strength for the eight cured binders of mix M-1 burned at various temperatures can be seen in . From a visual detection of these specimens of mix M-1, it was observed that the fired specimens have no color change to 600°C accompanied with no surface cracks and the specimen’s volume still constant till 600°C. After that, the specimen's surface color became darker and hair cracks appeared and increased in width up to 800°C. In most concrete structures. As soon as the temperature reaches 300 degrees, the cementitious paste begins to degrade, resulting in localized cracks, a drop in paste volume, and a total loss of free moisture [Citation32]. It is worth mentioning that the studied mix is intact without deleterious surface features still 600°C.
Figure 11. Influence of fire on the compressive strength of the 28-days cured, alkaliactivated binder of mix M-1.
FTIR analysis of specimens
illustrates the FTIR spectra for alkali-activated mixtures activated with 8 and 10 M of NaOH and cured at 60% RH and 38°C for 28 days. The elongation vibration of the O-H bond is found on the area 3435–3481 cm−1, the bending vibrations for (HOH) are positioned on 1628–1650 cm−1, and the elongation vibration of CO2 is situated at around 1430 cm−1 in the FTIR significant bands for all examined mixtures M-1 to M-6. The most distinctive bands are the asymmetric elongation vibration (T-O-Si) at 990–1042 cm-1, the symmetric stretching vibration (Si-O-Si and Al-O-Si) at 690–713 cm−1, and the Si bending vibration (Si-O- and O-Si-O) at 460–488 cm−1.
Figure 12. FTIR comparison spectra of different mixtures (M-1 to M-6) of alkali activated binders represented variation in bands. [1: vibration bending for O-H bond, 2-3 bonds for organic matter, 4: extending for H-O-H vibration, 5–6: CO2’s elongation vibration, 7: The (T-OSi) location of an asymmetric elongation vibration. 8–9: Si-O bending bands.10: Si-O-Si & AlO-Si asymmetric vibrations of elongation. 11: Si-O and O-Si-O vibrational cause bends in.
When 10 M NaOH is used, the pattern of mix M-1 shows broadness of the H2O and hydration material bands at 3450 and 1640 cm-1, indicating that this is where the largest hydration product contribution would be found. This is the consequence of calcium ions dissolving within water-cooled slag and calcined clay to generate CSH. This serves as a nucleating agent for the alkali-activation precipitated of dissolved species, causing a quick solidification and the formation of a smooth and uniform structure [Citation33]. This results in a rise in the primary asymmetric bands of (T-O-Si) and bending vibrations bands (Si-O-Si & O-Si-O), which in turn results in a high level of alumino-silicate alkali activation content.
While the patterns of mixture M-2, mixture M-4, and mixture M-6 exhibit distinct bands of hydration product in the presence of CKD and COD additions, they are not as wide as mixture M-1. In comparison to mixture M-1, the strength of the asymmetric bands for T-O-Si and the bending vibration bands of Si-O-Si & O-Si-O are reduced. Additionally, due to the presence of quartz, bending bands at 795 and 890 cm−1 are seen in these mixtures. Because of this, utilizing CKD as an activator in a very alkaline media caused the alumino-silicate material to dissolve partially, which had an impact on the amount of hydration and asymmetric band intensities. These results were supported by Khater [Citation30].
In contrast to the mixture M-1, mixture M-3, and mixture M-5, which have modest amounts of additional components, exhibit a low intensity of asymmetric T-O-Si bending vibration along with Si-O-Si & O-Si-O bands. Due to the high concentration of sodium hydroxide alkalis in the mixture, which will consume the binder surface in addition reduce chemical interaction between the alkali activation framework and insoluble solid particles, this is a sign of the poor reactivity of the mixture. Additionally, compared to the mix M-1, there is a noticeable increase in the strength of the carbonation bands at 1429 cm−1. In general, a reduction in the carbonation band leads to an increase in the alumino-silicate reaction and the production of an alkali-activated binder, as shown in the mixtures M-1, M-3, M-5, M-2, M-4, and M-6, which occurred in decreasing sequence. The excess of unreacted free calcium that is sensitive to carbonation in CKD is the major cause of an increase in carbonation.
Utilizing a high CKD content in mixes resulted in a rise in the carbonation band’s intensity, showing insufficient activated alkali of the reacting materials. Alkalis from an excess of CKD present as chlorides rather than hydroxides will be susceptible to carbonation, forming sodium bicarbonate, and do not always result in a high pore solution PH value. In addition, they cause efflorescence [Citation34]. The asymmetric band (T-O-Si) shifting to a greater value at around 1043 cm−1 (M-2) than that observed at the lower dosage of cement dust mix at about 1013 cm−1 is another sign that the carbonation is rising with the addition of CKD. (M-1 and M-3) suggest that carbonation caused CSH to develop with a lower calcium level [Citation35].
Microstructure analysis
The scanning electron micrographs of 28 cured hardened specimens of different activated mixes (M1-M6) are shown in . It is clearly shown that the mixture M-1 promoted the formation of amorphous texture of alkali-activated gel in a compact and homogeneous matrix (). Also, small unreacted particles were observed accompanied by little open pores (). Moreover, a distinct agglomerated wavy – glassy material was found () which refers to good, formed body structure. SEM images of the microstructures of specimens of mixture M-2, mixture M-3, and mixture M-6 incorporating CKD, COD, and mixture of both, respectively, are shown in .
Figure 13. SEM images of the morphology of the formed alkali activated binder show a dense texture (a), unreacted particles accompanied with little open pores and agglomerated wavy – glassy matrix (b).
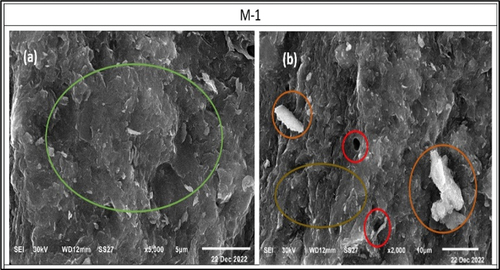
Figure 14. SEM images of specimens of mixture M-2, mixture M-3 and mixture M-6 show types of deformed structures (M 2, a-b), unreacted particles (M-3, a-b), micro-cracks and open pores (M-6, a-b).
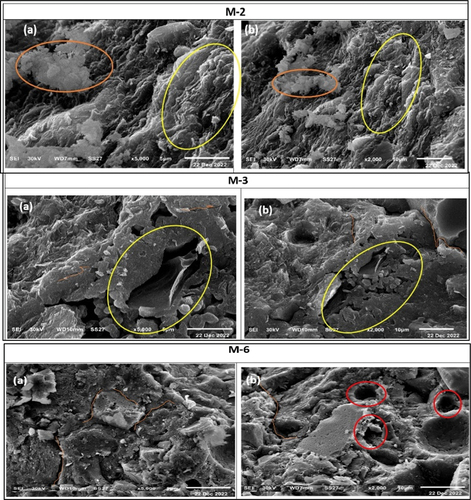
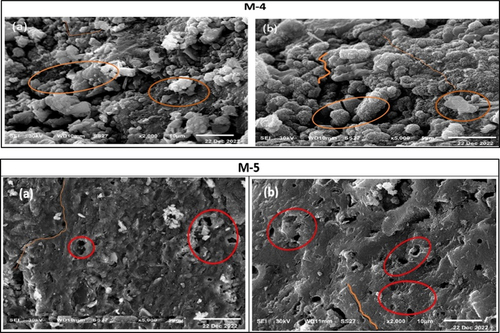
A deformed texture including micro-cracks and open pores is observed . Also, remarkable amounts of unreacted particles appeared on a heterogeneous matrix surface which weakened the structure . These features give evidence that the specimens suffered and have negative physico-mechanical properties as supported previously in . As a comparison, a micrograph of intermediate features of mixes M-3 and M-5 which prepared by the replacement of MCC by 1.5% CKD and COD appear an intermediate microstructure of a heterogeneous texture of dense (probable alkali-activated binder) and loose structure. Also, many open pores and microcracks and little unreacted particles are shown in ).
Figure 15. SEM images of specimens of mixes M-4 and M-5 clarify a heterogeneous loose structure (M-4, a-b), many open pores, micro cracks, and little unreacted particles (M-5, a-b).
Conclusion
Results from the research investigation were reported in this paper on the utilization of Mashashe calcined clay (MCC), and its calcined overburden deposits (COD) located in north-central Sinai, Egypt, incorporating wastes of cement kiln bypass dust (CKD) water cooled steel slag (WCS) and to manufacturing alkali-activated binders. These inferences can be made with regard to the experimental research described in this paper:
1- The best physico-mechanical results were for the mix M-1 (50% MCC, 50% WCS, and 10 M of NaOH) followed by mix M-5 (48.5% MCC, 50% WCS, 1.5% COD, and 10 M of NaOH). While the worst results with for mixes M-2 (47% MCC, 50% WCS, 3% CKD and 8 M of NaOH) and M-6 (47% MCC, 50% WCS, 1.5% CKD, 1.5% COD, and 8 M of NaOH).
2- The capability of using CKD and COD in the studied mixes up to 3% replacement for MCC. Higher percentages will give undesirable aspects and deleterious properties.
3- SEM images show evidence for heterogeneous texture, open pores, and unreacted particles in the specimens of mixes M-2 and M-6 accompanied with low content of geopolymer binders.
4- FTIR patterns of mixes M-2 and M-6 have the lowest hydration bands shifted to T-O-Si bands with increasing carbonation bands, reflecting the weakness of the alkali-activated process.
5- Products from the studied alkaline activated mixes can help in many construction fields, notably in several thermal insulation applications due to their resistivity against temperatures of at least 600°C.
6- Mixes of M-1, M-5, and M-3 have the most potential usage to produce alkali-activated binders.
Disclosure statement
No potential conflict of interest was reported by the author(s).
References
- Guo X, Shi H, Dick WA. Compressive strength and microstructural characteristics of class C fly ash geopolymer. Cem Concr Compos. 2010;32(2):142–147. doi:10.1016/j.cemconcomp.2009.11.003
- Yunsheng Z, Wei S, Zongjin L. Composition design and microstructural characterization of calcined kaolin-based geopolymer cement. Appl Clay Sci. 2010;47(3–4):271–275. doi:10.1016/j.clay.2009.11.002
- Ben Messaoud I, Hamdi N, Srasra E. Physicochemical characterization of geopolymer binders and foams made from Tunisian clay. Adv Mater Sci Eng. 2018;2018:1–8. doi: 10.1155/2018/9392743
- Ferone C, Liguori B, Capasso I, et al. Thermally treated clay sediments as geopolymer source material. Appl Clay Sci. 2015;107:195–204. doi:10.1016/j.clay.2015.01.027
- Fernández-Jiménez A, Palomo A. Characterisation of fly ashes. potential reactivity as alkaline cements. Fuel. 2003;82(18):2259–2265. doi:10.1016/S0016-2361(03)00194-7
- Jiang H, Qi Z, Yilmaz E, et al. Effectiveness of alkali-activated slag as alternative binder on workability and early age compressive strength of cemented paste backfills. Constr Build Mater. 2019;218:689–700. doi:10.1016/j.conbuildmat.2019.05.162
- Elimbi A, Tchakoute HK, Njopwouo D. Effects of calcination temperature of kaolinite clays on the properties of geopolymer cements. Constr Build Mater. 2011;25(6):2805–2812. doi:10.1016/j.conbuildmat.2010.12.055
- Chareerat T, Lee-Anansaksiri A, Chindaprasirt P. Synthesis of high calcium fly ash and calcined kaoline geopolymer mortar. Proceedings of the 1st International Conference on Pozzolan, Concrete and Geopolymer; Thailand: Khon Kaen; 2006. 327–335.
- Zibouche F, Kerdjoudj H, de Lacaillerie JBDE, et al. Geopolymers from Algerian metakaolin. influence of secondary minerals. Appl Clay Sci. 2009;43(3–4):453–458. doi:10.1016/j.clay.2008.11.001
- Buchwald A, Hohmann M, Posern K, et al. The suitability of thermally activated illite/smectite clay as raw material for geopolymer binders. Appl Clay Sci. 2009;46(3):300–304. doi:10.1016/j.clay.2009.08.026
- MacKenzie KJD. Innovative applications of inorganic polymers (geopolymers). In: Handbook of activated cements, mortars and concretes. 2015. pp. 777–805. 10.1533/9781782422884.5.777
- Payá J, Monzó J, Borrachero MV, et al. Reuse of aluminosilicate industrial waste materials in the production of alkali-activated concrete binders. Handbook Alkali-Activated Cements, Mortars Concretes. 2015;487–518.
- Thormark C. Conservation of energy and natural resources by recycling building waste. ResouConserv Recycl. 2001;33(2):113–130. doi:10.1016/S0921-3449(01)00078-7
- Ye N, Yang J, Ke X, et al. Synthesis and characterization of geopolymer from Bayer red mud with thermal pretreatment. J Am Ceram Soc. 2014;97(5):1652–1660. doi:10.1111/jace.12840
- Ezzat M, Khater HM, Abdeen M. Enhanced characteristics of alkali activated slag/grog geopolymer bricks. Int J Sci Eng Res. 2016;7:230–243.
- Yamchelou MT; Experimental study of the clay activation methods to develop geopolymer binder [ Doctoral dissertation]. RMIT University; 2021.
- Rahman MM, Law DW, Patnaikuni I, et al. Low-grade clay as an alkali-activated material. Appl Sci. 2021;11(4):1648. doi:10.3390/app11041648
- Temraz MG. Mineralogical and geochemical evaluation of late Eocene shale Northern Sinai, Egypt. J Pet Sci Eng. 2010;75(1–2):234–239. doi:10.1016/j.petrol.2010.11.016
- Nasim Y, El-Badawy E, Bakry E, et al., G.; Studied and evolution of clay deposits in Gabal Libni and Wadi Taybia, northern and central Sinai, Egypt. Egyptian Geological Survey. Internal report no. 46/2006.
- Hamdi N, Ben Messaoud I, Srasra E. Production of geopolymer binders using clay minerals and industrial wastes. C R Chim. 2019;22(2–3):220–226. doi:10.1016/j.crci.2018.11.010
- Aredes FGM, Campos TMB, Machado JPB, et al. Effect of cure temperature on the formation of metakaolinite-based geopolymer. Ceram Int. 2015;41(6):7302–7311. doi:10.1016/j.ceramint.2015.02.022
- ASTM, D. 7348. Standard Test Methods for Loss on Ignition (LOI) of Solid Combustion, Residues. West Conshohocken, PA, USA: ASTM International; 2011.
- ASTMC 39/C39M. Standard test method for compressive strength of cylindrical concrete specimens. West Conshohocken, PA, USA: ASTM International; 2021pp. 17–21.
- ASTM C20-00. Standard test for apparent porosity, water absorption, apparent specific gravity and bulk density of burned refractory bricks and shapes by boiling water. West Conshohocken, PA, USA: ASTM International; 2014.
- El-Mahllawy M; Effect of activation of granulated blast-furnace slag on the properties of unfired eco-friendly clay bricks. Proceedings of the 1st International Conference on Innovative Building Materials; Cairo, Egypt; 2004. 28–30.
- Pacheco-Torgal F, Castro-Gomes J, Jalali S. Alkali-activated binders: A review: part 1. historical background, terminology, reaction mechanisms and hydration products. Constr Build Mater. 2008;22(7):1305–1314. doi:10.1016/j.conbuildmat.2007.10.015
- Ramachandran VS, Paroli RM, Beaudoin JJ, et al. Handbook of thermal analysis of construction materials. William Andrew; 2002. 10.1016/B978-081551487-9.50017-7
- Jozanikohan G, Abarghooei MN. The Fourier transform infrared spectroscopy (FTIR) analysis for the clay mineralogy studies in a clastic reservoir. J Petrol Explor Prod Technol. 2022;12(8):1–14. doi: 10.1007/s13202-021-01449-y
- Forsgren J, Pedersen C, Strømme M, et al. Synthetic geopolymers for controlled delivery of oxycodone: adjustable and nanostructured porosity enables tunable and sustained drug release. PLoS One. 2011;6(3):e17759. doi:10.1371/journal.pone.0017759
- Khater HM. Effect of cement kiln dust on geopolymer composition and its resistance to sulphate attack. Int J Civil Struct Eng. 2012;2(3):749–762. doi:10.6088/ijcser.00202030005
- Mahmoud AM; Geology, geotechnical characteristic and industrial application of Miocene clay deposits at Wadi El Natrun Area- Egypt [ Ph.D. thesis]. department of Geology, Faculty of science, Alexandria Univ; 2018.
- Onundi LO, Oumarou MB, Alkali AM. Effects of fire on the strength of reinforced concrete structural members. American J Civil Eng Arch. 2019;7(1):1–12.
- Temuujin JV, Van Riessen A, Williams R. Influence of calcium compounds on the mechanical properties of fly ash geopolymer pastes. J Hazard Mater. 2009;167(1–3):82–88. doi:10.1016/j.jhazmat.2008.12.121
- Buchwald A, Schulz M. Alkali-activated binders by use of industrial by-products.Cement and concrete research. Cement Concr Res. 2005;35(5):968–973. doi: 10.1016/j.cemconres.2004.06.019
- Puertas F, Palacios M, Vázquez T. Carbonation process of alkali-activated slag mortars. J Mater Sci. 2006;41(10):3071–3082. doi:10.1007/s10853-005-1821-2