
ABSTRACT
The undrained shear strength of sandy soils during flow failures and liquefaction is a critical metric in the analysis of undrained stability. In our study, the numerical technique known as Artificial Neural Network (ANN) is used for simulating the triaxial stress–strain relationship of sandy soils. This paper aims to predict the undrained shear strength of saturated sandy soil. The proposed program requires simple laboratory soil data to proceed. They are median grain diameter (D50), fines content percentage (FC%), void ratios and relative density. In addition, the stress data of undrained loading such as effective vertical stress (σ’1) and effective horizontal stress (σ’3) are needed. Then, using the program, the deviator stress at yield (qu yield) and, consequently, the yield shear strength of sandy soil (Su (yield)) can be determined. A database of experimental undrained triaxial of saturated sandy soils was collected from the literature and prepared to be the inputs of the network. Two artificial neural networks have been built. By comparing the effectiveness of the two networks, the Back Propagation Neural Network (PBNN) approved higher results and more accuracy than the General Regression Neural Network (GRNN). The computer program, yield shear strength prediction application, written in visual basic, has been developed by the author. For model validation, seven case studies (seven patterns of the production set), which were not seen by the network previously, were presented to the application and the results are compared to the actual output. The produced yield shear strength is very close to the actual strength.
Introduction
Static and cyclic mechanisms can cause a variety of liquefaction flow problems. Liquefaction can cause catastrophic failure when the shear resistance of a liquefiable soil falls below the original static load (e.g., driving shear stress on a slope). The precise assessment of the undrained liquefied strength is critical for the design of soil structures such as earthen dams, bridge supports, and building foundations to prevent liquefaction collapse. Yield shear strength, Su (yield), is the peak shear strength of saturated with fine to medium sizes of sandy soil during the undrained loading [Citation1]. Under static shear stress (or constant rate of loading) greater than the liquefied shear strength, soil shows undrained strain-softening behavior. shows the undrained behavior of these soils [Citation1].
Figure 1. Undrained behavior of sandy soil [Citation1].
![Figure 1. Undrained behavior of sandy soil [Citation1].](/cms/asset/2112cc5f-0edd-4ff3-973e-40b10f0b4d4a/thbr_a_2252720_f0001_b.gif)
Computer simulation of soil testing saves money and time and offers a suitable means for soil behavior analysis. Further benefits of artificial neural networks (ANNs) include their great accuracy at solving difficult nonlinear problems and lack of presumptions regarding the mathematical basis of the relationships they are simulating [Citation2]. Due to these benefits, in this study, ANNs are utilized to predict the triaxial stress–strain relationship of saturated sandy soils.
In this paper, Artificial Neural Networks (ANNs) are employed as a prediction tool for the yield shear strength of sands under undrained triaxial compression. The first objective of this study is to develop a new artificial neural network (ANN) model which predicts the yield shear strength of saturated sands during undrained loading, from laboratory tests for 46 sand types. The second objective is to show that the output from the new ANN models can act as predictive tools of the yield shear strength.
Yield shear strength
Shear strength plays a major role in structural strength. Shear strength is a soil’s capacity to resist sliding along internal surfaces inside the soil mass. Soil failure typically takes the form of ‘shearing’ along internal surfaces within the soil [Citation2]. The peak shear strength of saturated, fine- to medium-sized sandy soil during the undrained loading is called the yield shear strength, Su(yield).
The static undrained resistance of sandy soil can be measured using ASTM D4767–11 [Citation3].
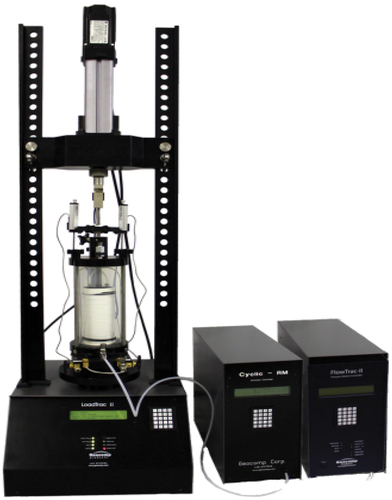
shows the apparatus used for that test. The yield shear strength is an essential parameter in undrained stability analysis.
Figure 2. Triaxial Apparatus.
Construction of ann model
Before any predictive models can be developed, quantitative measures must be established. The experimental data obtained from published literature for different sandy soils, such as clean sands (without any fines), silty sands, sandy silts, and finally, pure silts, were used as the database in the training, testing, and prediction phases of a neural network model.
shows a laboratory database of sandy soils which includes the median grain diameter (D50) and the fines content of these types (FC%) to describe soil gradation. In addition, minimum (emin) and maximum void (emax) ratios are mentioned. References for each of the sands studied are listed. Forty-six types of sands are used, median grain diameter (D50) ranges (0.013–0.5 mm), fines content ranges FC (0–98%), the range of emax (1.88–0.72), emin(1.23–0.34) and einitial (1.82–0.481). One hundred and thirty-eight triaxial compression test results for sands were elected and recorded in an Excel sheet from 245 tests available because some experimental data are not available or not applicable.
Table 1. Experimental database of the used sandy soils [Citation1].
An example of the results of the undrained static isotropic triaxial compression test for the saturated sandy soils is listed in [Citation4]. The reported data of initial test conditions of void ratio (ec), relative density (RD), major principal effective stresses at the end of consolidation (σ’1c), and finally, minor principal effective stresses (σ’3c).
Table 2. Example of available triaxial compression test database for the sands.[Citation4]
The recorded deviator stress values at yield (qu yield) are reported. The yield shear strength (Su yield) can be calculated using the following relation [Citation1].
Su(yield) = qu (yield) /2 [Citation1]
In this study, the software NeuroShell2® Release 3 is used to develop, train and calibrate the network. In the case of developing predictive nets, it is recommended to use either BPNN (Backpropagation Neural network) or GRNN (General Regression Neural network) [Citation27]. This study will use both alternatives.
Selection and preparing input parameters
Banimahd [Citation28] studied the physical and index properties of different sand types that affect stress-strain behavior under undrained conditions. He performed a sensitivity analysis which concluded that sand grain distributions do not considerably change in the behavior. He stated that the main influencing factors include relative density (RD), effective confining pressure, and fines percentage (FC%). Our proposed model uses eight variables, which were classified into four categories: Soil properties data, void ratios data, relative density and finally principal effective stress values. In the following sections, the detailed importance of these variables will be discussed.
Soil properties data (D50), (FC %)
These two elements are essential for the characterization of sandy soil [Citation28]. This item includes two elements: 1) Median Grain Size (D50) and 2) Fines Content percentage (FC%).
Void ratio data (emax, emin and ec)
The void ratio (e) is a general indicator of the relative strength and compressibility of the sandy soil sample. The void ratio at the beginning of the shear determines the undrained behavior of saturated, cohesionless soil [Citation27]. This item includes three elements: 1) Maximum void ratio (emax), 2) Minimum void ratio (emin) and 3) initial conditions of void ratio after consolidation (ec).
Relative density data (RD)
Bensoula [Citation29] concluded that liquefaction resistance is improved by increasing the relative density, but only up to a threshold relative density value determined by the fines content. This item includes one element: Relative Density (RD).
Principal effective stresses data
Ishihara [Citation26] confirmed the existence of a relationship between the liquefied shear strength and the initial confining stress for silty sands and sandy silts. This item includes two elements: 1) major principal effective stresses at the end of consolidation (σ’1c) and 2) minor principal effective stresses at the end of consolidation (σ’3c).
Output of the model
The proposed output of this model is the deviator stress (= σ1 - σ3) at yield (qu yield) and, consequently, the yield shear strength of sandy soil Su (yield).
ANN model architecture
The neural prediction networks forecast the output of given input data. To train itself, any neural network approach requires training data that include input-output. The network can forecast the output or outcomes of feeding it a fresh test data set after being trained with the training data set. The coefficient of determination (R2) is used to compare the best nets. An excellent fit is close to 1, a bad fit is close to 0, and the ideal match yields an R- squared value of 1.
General Regression Neural Networks (GRNN)
A network with the ability to train quickly on sparse data sets is the GRNN. The GRNN approach uses the training set and measures the distance between a certain sample pattern and the other training set’s patterns. By the regression of the dependent variable (OUTPUTS) on an independent variable (INPUTS), it can estimate the most probable value for outputs. The regression method produces an estimation value by minimizing the mean-squared error (MSE). GRNN is a three-layer network (slab TWO). Each training pattern represents a single hidden neuron (108 neurons). The input layer, known as Slab (ONE), has an identical number of neurons as inputs (eight neurons), and its scale function is linear (0–1). GRNN networks compare patterns based on how far off they are from one another, and the Vanilla distance metric works best for that. summarizes the network variables used in training, testing, production, functions, training algorithm and performance measure.
Table 3. Variable used in GRNN building.
shows the correlation coefficient (R2) and minimum and maximum absolute error for the three sets of data obtained from the GRNN model. presents a result chart for various sets of data.
Figure 3. Results of trained GRNN network for various set.
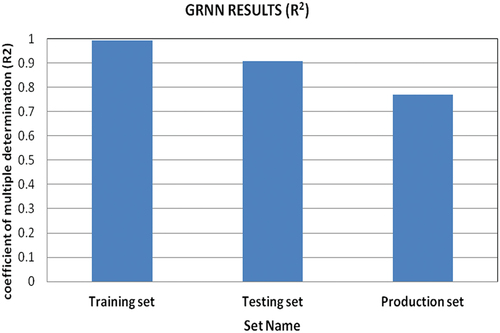
Table 4. GRNN model results.
Three Layers Back Propagation Neural Network (PBNN)
A three-layer backpropagation network is used to model the available data. For a wide variety of problems, this architecture can generalize effectively. The number of neurons in the hidden layer was identified after numerous tests (14 neurons). A simple network was used as the data are fairly consistent (there are not many conflict patterns). summarizes the network variables used in training, testing, production, neurons, learning rate, momentum, and performance measure.
Table 5. Variables used in BPNN building.
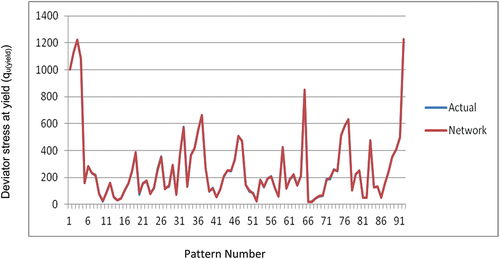
and show the correlation coefficient (R2). In addition, the minimum and maximum absolute errors for the sets of data obtained from the GRNN model are presented in .
Figure 4. Results of trained BPNN network for various set.
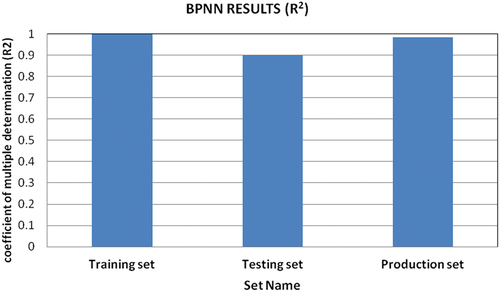
Table 6. BPNN model results.
Comparison
Using the same data, BPNN and GRRN, two Artificial Neural Network designs, were trained and tested. The networks’ performance was compared. Based on the findings which were depicted in , It can be seen that BPNN performs better than GRNN in the solution of our problem, even though GRNN produces outputs that are very reasonable also.
Figure 5. Performance of General regression neural network (GRRN) for trained set.
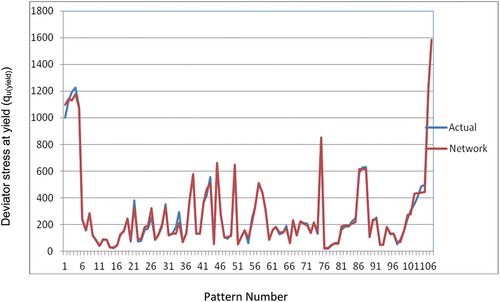
Figure 6. Performance of Backpropagation neural network (BPNN) for trained set.
Implementation and application
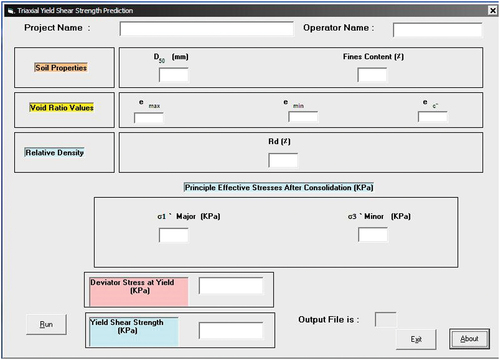
To achieve the implementation of the trained networks, we need to produce a computer routine. The run-time facilities module of the used ready-made software, NeuroShell 2®, is invoked to produce a computer routine. Such a routine contains all network calculations to be carried out by the network. To effectively execute this procedure, a computer program, yield shear strength prediction application, written in Visual Basic, has been developed by the author, to perform these calculations. shows its interface. One of the software advantages is that if there is any missing input or unavailable data, it is still accurate and gives a reasonable approximation.
Figure 7. Interface of yield shear strength prediction application.
Model validation
To examine the predictability of the model, a production set (seven patterns) which is not seen by the network previously, was randomly chosen from the database and was presented to the application, and a comparison between the model predictions and the actual laboratory test outputs was made as shown in and . An agreement between the models and laboratory data was observed. The value of the coefficient of multiple determination (R2) for the production set was 0.9829. This value is very good and accepted for the prediction of yield shear strength.
Figure 8. Comparison between model predictions and actual results for production set.
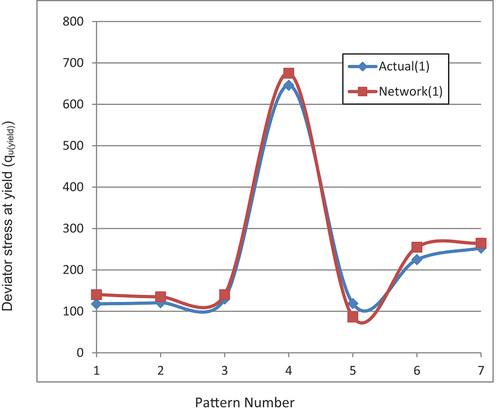
Table 7. Input and output for the chosen production pattern presented to the application.
Model execution
To ensure good execution of the software, a chosen production pattern data (No. 07) was presented to the model, and the output was 264.64 KPa. The prediction value is very close to the actual strength 253.5KPa. The application can prepare and save a printable recorded file. The result of the run is shown in .
Figure 9. Printout file contains the prediction of (Su) and also all the input data.
Conclusions
The backpropagation neural network (BPNN) model achieves a maximum value of (R2) = 0.9997 for trained data and the value (R2) = 0.9829 for the production set. The performance of the three-layer Back Propagation neural network model with one hidden layer is superior to the general regression neural network (GRNN) model for our problem. The proposed software produces an excellent way to predict the yield shear strength which can be used as an educational tool for students or used as a preliminary design stage of value for yield shear strength for experts.
Disclosure statement
No potential conflict of interest was reported by the author(s).
References
- Olson SM, Stark TD. Use of laboratory data to confirm yield and liquefied strength ratio concepts. Can Geotech J. 2003;40(6):1164–1184. doi: 10.1139/t03-058
- Baghbani A, Choudhury T, Costa S, et al. Application of artificial intelligence in geotechnical engineering: A state-of-the-art review. Earth Sci Rev. 2022;228: doi: 10.1016/j.earscirev.2022.103991
- ASTM D4767-11. Standard test method for consolidated undrained triaxial compression test for cohesive soils. In: Annual book of ASTM standards. West Conshohocken, PA: American Society for Testing and Materials; 2020. pp. 14 doi: 10.1520/D4767-11R20
- Olson SM 2001. “Liquefaction analysis of level and sloping ground using field case histories and penetration resistance”, Ph.D. thesis, University of Illinois at Urbana–Champaign, Urbana, Ill. [online]. Available from http://pgi-tp.ce.uiuc.edu/olsonwebfiles/olsonweb/index.html [cited December 2002].
- Konrad JM. Minimum undrained strength of two sands. J Geotech Eng, ASCE. 1990;116(6):932–947. doi: 10.1061/(ASCE)0733-9410(1990)116:6(932)
- Chillarige AV, Robertson PK, Morgenstern NR, et al. Evaluation of the in situ state of Fraser River sand. Can Geotech J. 1997;34(4):510–519. doi: 10.1139/t97-018
- Pillai VS, Stewart RA. Evaluation of liquefaction potential of foundation soil at Duncan Dam. Can Geotech J. 1994;31(6):951–966. doi: 10.1139/t94-110
- Canou J, Bahda F, Saitta A, et al. (1994). “Initiation of sand liquefaction under monotonic and cyclic loading”, Proc., 13th International Conf. on Soil Mechanics and Foundation Engineering, January 5-10, New Delhi, India, Vol. 3, 1297–1300
- Highter WH, Tobin RF. Flow slides and the undrained brittleness index of some mine tailings. Eng Geol. 1980;16(1–2):71–82. doi: 10.1016/0013-7952(80)90008-3
- Highter WH, Vallee RP. The liquefaction of different mine tailings under stress-controlled conditions. Engineering Geology. 1980;16(1–2):147–150. doi: 10.1016/0013-7952(80)90014-9
- Dyvik R, Høeg K. Comparison of tests on undisturbed and reconstituted silt and silty sand. In: Lade P, and Yamamuro J, editors Intl. Workshop on the physics and mechanics of soil liquefaction. 1st ed. Chapter 14. Baltimore, Maryland: Johns Hopkins University; 1999.
- Dennis ND. “Influence of specimen preparation techniques and testing procedures on undrained steady-state shear strength”, Advanced triaxial testing of soil and rock, ASTM STP 977. Donaghe, R.T., Chaney, R.C., Silver, M.L., eds. American Society for Testing and Materials;Philadelphia: 1988pp. 642–654. doi: 10.1520/STP29104S
- Arulanandan K, Seed HB, Yogachandran C, et al. Centrifuge study on volume changes and dynamic stability of earth dams. J Geotech Eng, ASCE. 1993;119(11):1717–1731. doi: 10.1061/(ASCE)0733-9410(1993)119:11(1717)
- Sladen JA, D’Hollander RD, Krahn J. The liquefaction of sands, a collapse surface approach. Can Geotech J. 1985;22(4):564–578. doi: 10.1139/t85-076
- Sladen JA, Handford G. A potential systematic error in laboratory testing of very loose sands. Can Geotech J. 1987;24(3):462–466. doi: 10.1139/t87-058
- Takeshita S, Takeishi M, Tamada K (1995). “Static liquefaction of sands and its liquefaction index”, Proc., 1st International Conf. on Earthquake Geotechnical Engineering, Nov. 14-16, Tokyo, Japan, Vol. 1, 177–182.
- Riemer MF, Seed RB. Factors affecting apparent position of steady-state line. J Geotech GeoEnviron Eng, ASCE. 1997;123(3):281–288. doi: 10.1061/(ASCE)1090-0241(1997)123:3(281)
- Chu J. An experimental examination of the critical state and other similar concepts for granular soils. Can Geotech J. 1995;32(6):1065–1075. doi: 10.1139/t95-104
- Hanzawa H. Undrained strength and stability analysis for a quick sand. Soils Found. 1980;20(2):17–29. doi: 10.3208/sandf1972.20.2_17
- Konrad JM. Undrained response of loosely compacted sands during monotonic and cyclic compression tests. Geotechnique. 1993;43(1):69–89. doi: 10.1680/geot.1993.43.1.69
- Konrad JM, Pouliot N. Ultimate state of reconstituted and intact samples of deltaic sand. Can Geotech J. 1997;34(5):737–748. doi: 10.1139/T97-039
- Konrad JM. Sand state from cone penetration tests: a framework considering grain crushing stress. Geotechnique. 1998;48(2):201–215. doi: 10.1680/geot.1998.48.2.201
- Been K, Jefferies MG, Hachey J. The critical state of sands. Geotechnique. 1991;41(3):365–381. doi: 10.1680/geot.1991.41.3.365
- Bryant SM, Duncan JM, Seed HB (1983). “Application of tailings dam flow analyses to field conditions”, Report No. UCB/GT/83-03, Dept. of Civil Engineering, Univ. of California, Berkeley, CA.
- Baziar MH, Dobry R. Residual strength and large-deformation potential of loose silty sands. J Geotech Eng, ASCE. 1995;121(12):896–906. doi: 10.1061/(ASCE)0733-9410(1995)121:12(896)
- Ishihara K. Liquefaction and flow failure during earthquakes. Geotechnique. 1993;43(3):351–415. doi: 10.1680/geot.1993.43.3.351
- Abu Kiefa M.A. General Regression Neural Networks for Driven Piles in Cohesionless Soils. J. Geotech. Geoenviron. Eng. 1998;124(12):1177. doi: 10.1061/(ASCE)1090-0241
- Banimahd M, Yasrobi SS, Woodward PK. Artificial neural network for stress–strain behavior of sandy soils: Knowledge based verification. Comput Geotech. 2005;32(5):377–386. doi: 10.1016/j.compgeo.2005.06.002
- Bensoula M, Bousmaha M, Missoum H. Relative density influence on the liquefaction potential of sand with fines. In: Revista de la Construcción. Vol. 21. Santiago; 2022. p. no.3 doi: 10.7764/rdlc.21.3.692