
 ?Mathematical formulae have been encoded as MathML and are displayed in this HTML version using MathJax in order to improve their display. Uncheck the box to turn MathJax off. This feature requires Javascript. Click on a formula to zoom.
ABSTRACT
Egypt is currently developing huge housing projects at the New Capital, Alamein, and other Egyptian cities. These projects often require soil replacement for roads and buildings. Among the causes of problems observed in some housing projects in the last decade are improper type of soil replacement material and inadequate compaction. Pit-run gravelly soils are commonly recommended for soil replacement because they have the advantages of providing high stiffness, low permeability inherited from their fines’ content and wide availability in Egypt. It is common to use sand cone test and/or static plate load test (SPLT) to assess the quality of compaction. The sand cone test is simple, cheap and rapid; however, it is not reliable with gravel sizes usually found in pit-run gravel, which may exceed 38 mm. Although the SPLT is efficient to assess the quality of compaction and the deformation modulus, it is relatively expensive and time-consuming. The dynamic plate load test is a reliable solution to combine the advantages of both the sand cone test and SPLT. This research includes a detailed laboratory characterization of pit-run gravel collected from Suez deserts and a field testing program including static and dynamic plate load tests on pit-run gravelly soil carried out at several sites in the new capital of Egypt to obtain static and dynamic plate load tests moduli. A statistical approach based on percent of exceedance criterion is adopted to obtain a simple correlation between the static and dynamic plate load test deformation moduli.
Introduction
In general, tests for quality control of field compaction of soil replacement layers may be classified as density-based and modulus-based tests (Meehan et. al. 2012 [Citation1]). One of the modulus-based test methods is a dynamic plate load test with a lightweight deflectometer (LWD). It may be defined as a test method during which the ground is subjected to an impulsive load generated by a drop weight that freely falls from a constant height onto a steel plate resting on the layer under test (ASTM 2835-11 [Citation2]). It exerts a normal contact stress beneath the steel plate, and the corresponding settlement is measured using a sensor implemented in the steel plate. This test has gained considerable interest for its application in the assessment of field compaction. Many previous researchers have used several conventional in situ field and laboratory tests to calibrate and evaluate the results of this test. The influence depth of the LWD was investigated by Mooney and Miller [Citation3], who, based on the experimental results, suggested that the influence depth of the LWD is 0.9–1.1 times the plate diameter and is dependent on soil type. In contrast, Wieder et al. [Citation4] found that the influence depth of the LWD ranges between 1.0 and 1.8 times the plate diameter. Senseney et al. [Citation5] concluded, based on numerical investigations, that the influence depth of the LWD is 2–2.5 times the plate diameter, which is considerably deeper compared to the experimental studies. The practically recommended depth of influence of 1.5 times the plate diameter agrees well with the common engineering practice and is recommended by TERRATEST 4000 instruction manual [Citation6] for converting the measured settlement into dynamic deformation modulus using the following elastic settlement equation:
where:
r is the radius of the plate = 0.15 m.
αmax is the contact stress under the plate.
smax is the measured settlement under the contact stress.
It is worth mentioning that Equationequation (1)(1)
(1) is also used for the calculation of the static deformation modulus (Ev), which is the secant modulus obtained from a one-cycle static plate load test (SPLT) to compare with the corresponding Evd.
Also, the correlations between the static and dynamic plate load deformation moduli Ev and Evd, respectively, were proposed by many researchers; for example, Nazzal et al. [Citation7] evaluated the LWD test in conjunction with the SPLT. They proposed an empirical correlation between Evd and Ev, with a correlation coefficient (R2) of 0.97. Also, Kim et al. [Citation8] presented a reasonable linear correlation, with a correlation coefficient (R2) of 0.77. In another approach, Abdulkareem [Citation9] used an artificial neural network model to determine the best correlation between the elastic modulus obtained from LWD test and SPLT. The effects of the statistical analysis resulted in a good relationship with a correlation coefficient value (R2) of 0.98). Another correlation with R2 = 0.7 was experimentally proposed by Pasetto et al. [Citation10]. Chen and Zheng [Citation11] proposed an empirical correlation between dynamic and static moduli, conducted on a red sandstone subgrade with R2 = 0.75. Adam and Paulmichl [Citation12] and Adam et al. [Citation13] developed a mechanical model for both the SPLT and the LWD test using numerical simulations, and they concluded that for a dynamic deformation modulus Evd larger than 10 MPa, the soil contact stress was almost constant at about 94 kPa for all soil stratifications. Thus, the assumption that contact stress below the plate is 100 kPa, commonly used for evaluating the soil compaction, is justified. Also, some correlations are implemented in European codes and standards such as the Austrian standard RVS 08.03.04 [Citation14], which proposed a correlation defined by two linear equations for non-cohesive soils as follows:
It is common for a given soil replacement or a sub-base layer to encounter significant variations in test results from a test point to another for both the density-based and modulus-based tests. This variation may occur even when there is no significant change in the material that is being placed (Meehan et. al. 2012 [Citation1]).
In this paper, a field-testing program is proposed to calibrate the LWD deformation modulus (Evd) with respect to the SPLT deformation modulus (Ev). The program included conducting both LWD test and SPLT on many compacted pit-run gravel layers at eight different sites at the New Administrative Capital of Egypt. The measured LWD dynamic modulus (Evd) and the corresponding SPLT modulus (Ev) were recorded and analyzed using statistical methods for each tested layer to obtain the representative values for each test group. Finally, correlations between the static and dynamic moduli are proposed.
Field testing program
The LWD tests carried out in this study were conducted using a commercially known TERRATEST® 4000 equipment shown in presents an actual test conducted on a pit-run gravel layer at one of the test sites. The test procedure includes dropping a 10-kg weight from a height of 0.737 m onto a steel plate with a diameter of 0.30 m. The equivalent static load for the dynamic impulsive load of the dropped weight is 7.07 kN according to the calibration certificate of the device (contact stress of 100 kPa). The settlement of the steel plate is measured using a settlement sensor implemented in the plate and recorded in the testing computer. The settlement is automatically converted into Evd using Equationequation 1(1)
(1) . For each tested layer, eight LWD tests were conducted around a central SPLT, as shown in . The proposed configuration is a standard way of calibrating Ev and Evd.
Figure 1. LWD testing: a. Test set-up; b. Actual test on pit-run gravel.
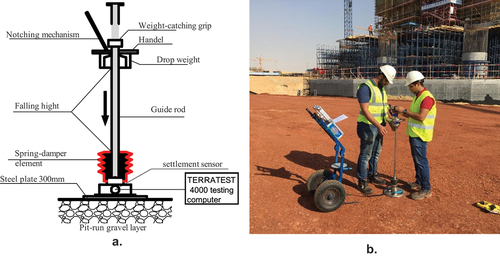
Figure 2. The proposed arrangement for calibration.
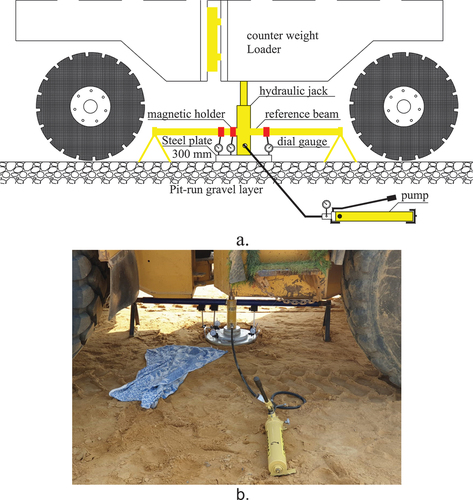
The test set-up for the SPLT consists of a steel plate loaded using a hydraulic jack with a pressure gauge to read the load and three dial gauges mounted on a reference beam, as shown in presents an actual test conducted on a pit-run gravel layer at one of the test sites. The diameter of the loading steel plate is 0.30 m to match the size of the steel plate of the LWD. The loading process is conducted in a single cycle of loading and unloading. The static deformation modulus (Ev) is the secant modulus corresponding to a stress of 100 kPa, so that it can be compared with Evd measured for the same pit-run gravel. It is worth mentioning that both SPLT and LWD are conducted without inundation.
Figure 3. SPL testing: a. Test set-up; b. Actual test on pit-run gravel.
Characterization of pit run gravel
Pit-run gravelly soils may be defined as gravels found in natural deposits without any processing. They consist of varying percentages of gravel, sand and fines and are commonly recommended for soil replacement because they have the advantages of providing high stiffness, low permeability inherited from their fines’ content and wide availability in Egypt. The grain size analysis, Atterberg limits and modified proctor tests were performed on pit-run gravel samples collected from eight different sites to determine their physical properties. All samples are classified according to the Unified Soil Classification System (USCS) ASTM D-2487 [Citation15]. The results of the laboratory tests are presented in .
Table 1. Summary of pit-run gravel soil characterization results.
From the laboratory test results, it can be seen that all tested samples are gravelly soils with gravel percentages ranging between 50% and 88%. The percentages of sand and fines (silt and clay particles) range between 9% and 34% and 2% and 15%, respectively. The coefficients required to classify soils according to USCS are calculated and listed in . These coefficients are uniformity (Cu) and curvature (Cc) coefficients as well as the Atterberg limits. It is identified that soil in most of the samples has a medium-to-low plasticity index (PI) ranging between 11.7% and 16.0%, while high values were at only two sites. Also, the maximum obtained liquid limit (LL) and plastic limit (PL) values were about 49.7% and 27.4%, respectively, whereas the minimum values were 31.8% and 16.5%, respectively.
In addition, most of the tested soil samples have a maximum dry density in the range of 21.0–21.8 kN/m3, and the corresponding optimum moisture content (OMC) ranges between 7.0% and 7.5%. In general, based on the results of the tested samples, the pit-run gravel soil may be classified according to the USCS soil classification system as poorly graded gravel with silt and sand (GP-GM), and at some sites, the classification is well-graded gravel with clay and sand (GW-GC). However, at some sites, it was classified as well-graded gravel (GW), and at only one site, it was classified as clayey gravel (GC).
Results and analysis of field tests
At each site, several calibration tests were conducted on pit-run gravely soil replacement layers. It was observed that there is a considerably high scatter of LWD Evd results for each calibration test. Such scatter is common in geotechnical engineering due to the nature of ground materials, and to obtain a representative average (characteristic value) of a soil parameter such as Evd or Ev, a statistical characterization approach is required (Abdel-Fattah [Citation16]). The scatter in test results is mainly caused by, but not limited to:
the non-homogeneous nature of the pit-run gravel, characterized by varying percentages of its constituents, especially gravel and fines;
nonuniform compaction;
plasticity of the fine fraction and moisture content.
A statistical approach was proposed for the correction of the results and the selection of a representative average value (characteristic value) to compare with the corresponding value of SPLT Ev. The proposed statistical correction procedure can be summarized as follows:
Calculate the average value, standard deviation and coefficient of variation for each set of results;
Exclude values outside the limit of the average ± standard deviation;
The representative corrected average is obtained as the average of the remaining values.
For site 1, the proposed correction procedure was applied to four calibration tests. The results are plotted in . It can be seen from that for calibration test number 3, the soil has an Evd ranging between 100 and 232 MPa, with an average value of 165.21 MPa. This may be attributed to the relatively high gravel percentage of 81%. The dynamic modulus Evd results were relatively low for calibration test numbers 2 and 4 (). It ranged between 45.7 and 57.4 MPa in calibration test number 2 and between 47.2 and 60.6 MPa in calibration test number 4. Similarly, the same correction procedure was applied for all calibration tests at the selected sites in order to decrease the scatter in the results. The summary of the obtained Evd before and after correction is listed in , with the corresponding standard deviation (α) and coefficient of variation (COV) before and after correction. It can be seen from this table that the values of the COV are considerably reduced after correction, leading to a more reliable average value for Evd for each calibration test. In addition, the corresponding values of the SPLT modulus Ev are also listed in for comparison.
Figure 4. Statistical correction of dynamic modulus (Evd) for site 1.
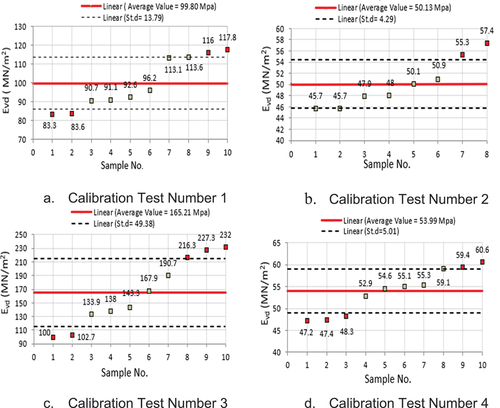
Table 2. A summary of the LWD test and SPLT results with descriptive statistics.
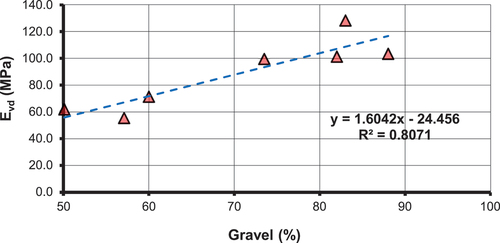
The variations in Evd with percentage of fines for some selective samples from test sites are plotted in . It can be seen from that the available data cannot be adequately represented by any reasonable trend line. However, the Evd value is sensitive to the percentage of fines. Higher Evd values are obtained at fine content less than 2% and between 10% and 11%. shows that Evd is generally directly proportional to the percentage of gravel for the selected test samples.
Figure 5. Variation in Evd with percentage of fines.
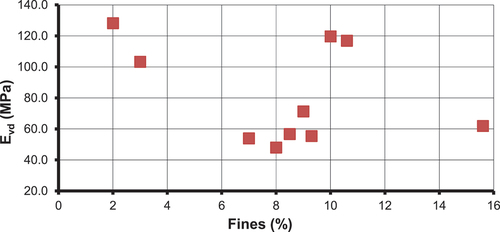
Figure 6. Variation in Evd with percentage of gravel.
It can be seen from that the values of Ev are generally greater than the corresponding Evd values for Evd values greater than 50 MPa; otherwise, the values of Ev are smaller than the corresponding Evd value, which agrees well with the Austrian standard RVS 08.03.04 [Citation12].
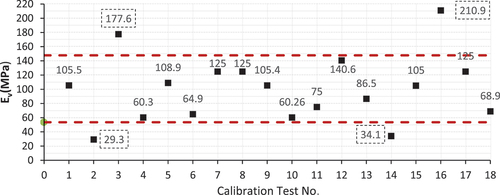
In general, the representative average values (corrected values) of the Evd for all calibration test groups ranged from 36.04 to 206.9 MPa, as shown in . The average of representative averages and the average coefficients of variation (COV) for the corrected averages were about 92.3 MPa and 9%, respectively. Assessment of the corrected averages, listed in , shows that their COV is about 47%, which is considerably high. Also, the assessment of Ev obtained from SPLT results, plotted on , shows that its average value is about 100.45 MPa and that its COV value of 46.75% is relatively high. It was decided to reapply the proposed statistical correction approach to both corrected average values of Evd and the corresponding values of Ev. After excluding the values of groups 2, 3, 14 and 16, which are outside the statistical correction limit, as can be seen from , the average values of the dynamic moduli Evd for all test groups ranged from 52.9 to 119.7 MPa. Consequently, the corresponding values of Ev ranged between 60.26 and 140.6 MPa. It can be observed that the corrected values of Evd are more reliable and give a better indication of the results, and, therefore, they can be compared with their corresponding values of Ev listed in .
Figure 7. Representative average values of the dynamic modulus Evd for all tested sites.
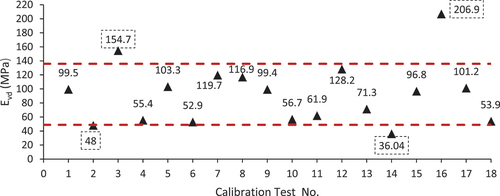
Figure 8. Representative average values of the static modulus Ev for all tested sites.
Correlations between SPLT, EV and LWD, EVD moduli for pit-run gravel
After the statistical correction of the results of both SPLT, Ev and LWD, Evd moduli, the relationship between Evd and Ev is plotted in , with different correlation schemes for the same results. The exponential, logarithmic, second-degree polynomial, third-degree polynomial and linear correlation schemes are presented in , respectively, and the corresponding correlation equations and coefficient of correlation (R2) are calculated to determine the best correlation for pit-run gravel soil using a simple regression equation. The suggested third-degree polynomial correlation in resulted in the highest R2 value of 0.96, while the lowest R2 value of 0.94 was obtained for the case of exponential correlation shown in . As evident from , all the correlation functions show good correlation factors, which proves that the corrected data sets are very good. For simplicity, it is recommended to use the linear correlation function shown in , which has an R2 value of 0.958. presents a summary of the obtained correlation equations of pit-run gravel with their corresponding R2 correlation coefficients.
Figure 9. Relationship between corrected results of LWD and SPLT deformation moduli of pit-run gravel.
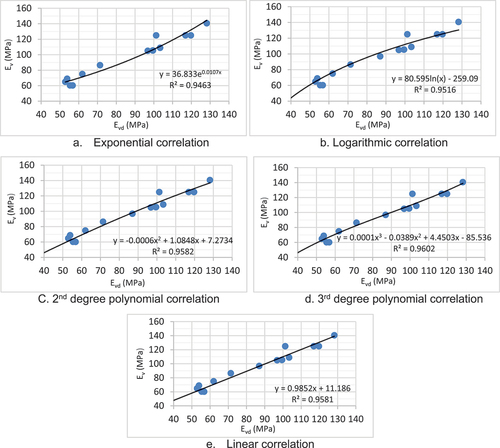
Table 3. Summary of the suggested equations for pit-run gravel.
Conclusions
The LWD test is a good alternative to both SPLT and field density measuring tests that allows engineers to apply quality control measures to soil replacement layers. It has the advantages of being compact in size and user-friendly and providing instant results. The most important conclusions obtained based on the investigations carried on pit-run gravels in this study are as follows:
The dynamic modulus (Evd) generally increases with the increase in the percentage of gravel particles in the pit-run gravel sample and vice versa.
The representative average value obtained for the dynamic modulus is 86.93 MPa, whereas the corresponding average of the static modulus is 96.875 MPa. The static modulus is generally higher than the dynamic modulus. The measured static modulus (Ev) ranges between 1.044 and 1.278 times the corresponding dynamic modulus (Evd).
It is recommended to use the following simple linear correlation with an R2 value of 0.958, which seems to be the most appropriate obtained equation for direct conversion between static and dynamic plate load tests moduli for pit-run gravels:
The suggested correlation in this study between static and dynamic moduli for pit-run gravels has a good correlation factor (R2) compared with most correlations discussed in the Introduction section. It is worth mentioning that the suggested correlation yields result in good agreement with the correlation proposed by the Austrian standard RVS 08.03.04 [Citation10] for Evd ≥50 MPa.
Disclosure statement
No potential conflict of interest was reported by the author(s).
References
- Meehan CL, Tehrani FS, Vahedifard F. A comparison of density-based and modulus-based in situ test measurements for compaction control. Geotech Test J. 2012;35(3):387–399. doi: 10.1520/GTJ103479
- American Society for Testing and Materials (ASTM E2835). Standard test method for measuring deflections using a portable impulse plate load test device. In: Annual book of ASTM standards, ASTM E2835. West Conshohocken, PA: ASTM; 2011.
- Mooney MA, Miller PK. Analysis of lightweight deflectometer test based on in situ stress and strain response. J Geotech Geoenviron Eng. 2009;135(2):199–208. doi: 10.1061/(ASCE)1090-0241(2009)135:2(199)
- Wieder W, Shoop S, Barna L, et al. Comparison of soil strength measurements of agricultural soils in Nebraska. J Terramechanics. 2022;77:31–48.
- Senseney CT, Grasmick J, Mooney MA. Sensitivity of lightweight deflectometer deflections to layer stiffness via finite element analysis. Can Geotech J. 2015;52(7):961–970. doi: 10.1139/cgj-2014-0040
- TERRATEST 4000. Instruction manual for light weight deflectometer for dynamic plate load test. Oranienburg, Germany: TERRATEST GMBH; 2014.
- Nazzal MD, Abu-Farsakh MY, Alshibli K, et al. Evaluating the light falling weight deflectometer device for in situ measurement of elastic modulus of pavement layers. Article Transport Res Rec. 2007;2016(1):13–22. doi: 10.3141/2016-02
- Kim JR, Kang HB, Kim D, et al. Evaluation of in situ modulus of compacted subgrades using portable falling weight deflectometer and plate-bearing load test. J Mater Civ Eng. 2007;19(6):492–499. doi: 10.1061/(ASCE)0899-1561(2007)19:6(492)
- Abdulkareem AH. Evaluating LFWD testing for characterizing subgrade layers using regression analysis and artificial neural network model. Iraqi J Civil Engg. 2017;11(1):21–31. doi: 10.37650/ijce.2017.133749
- Pasetto M, Pasquini E, Giacomello G, et al. Proposal of correlation among. 2018. doi: 10.3390/ma11040515
- Chen C, Zheng JL. Relationship between dynamic modulus and static detection index in red sandstone subgrade. Appl Mech Mater. 2013;353-356:1112–1115. https://www.scientific.net/AMM.353-356.1112
- Adam C, Paulmichl I. Computational assessment of the dynamic load plate test with the light falling weight device. In Proceedings of ECCOMAS Thematic Conference on Computational Methods in Structural Dynamics and Earthquake Engineering; 2007 June 13–15; Greece. p. 12.
- Adam C, Adam D, Kopf F, et al. Computation Validation Static dynamic plate load testing. Acta Geotechnical. 2009;4(1):35–55.
- Austrian standard RVS 08.03.04. Compaction tests by means of the dynamic plate load test. Vienna: Austrian Research Association Road Rail Traffic (FSV); 2008.
- ASTM D-2487. Standard practice for classification of soils for engineering purposes (Unified Soil Classification System). United States: ASTM International; 2000.
- Abdel-Fattah T. Employment of reliability analysis to assess soil strength partial factors for slope stability problems. Proceedings of International Conference on Advances in Structural and Geotechnical Engineering; 2017.