
 ?Mathematical formulae have been encoded as MathML and are displayed in this HTML version using MathJax in order to improve their display. Uncheck the box to turn MathJax off. This feature requires Javascript. Click on a formula to zoom.
ABSTRACT
MSEW (Mechanically Stabilized Earth walls) has become a widely adopted and economical earth-retaining system. However, the current design standards primarily rely on a two-dimensional plane-strain approach, overlooking the critical 3D behavior and mechanisms associated with wall curves and corners. To address this gap, this research aims to enhance our comprehension of MSEW corner performance for right-angle (Sharp turns) and curved (Round off) walls by using 3D finite element modeling. A comparative study was conducted for MSEW in case of sharp turns and round off walls, in addition to examining the influence of the curve angle in the different cases with angles (internal curve angle) of 50 to 120 degrees. Based on results of comparing the right-angle wall and the curved angle (90º) wall, it is evident that the horizontal displacement of the right-angle wall is greater. For curved wall, it was observed that the value of horizontal displacement is minimal at the beginning of the curved wall and gradually increases until it reaches the maximum displacement at the mid of the curve in plan view. The geogrid strain for the right-angle wall is approximately 1.70 times of the curved wall (internal curved angle = 90°). Based on the results of difference angle of curved wall, it was concluded that the horizontal displacement values of the wall between internal curved angles 90 and 120 are quite close, but they differ significantly from 50 to 90. It was noted that, the maximum displacements for angles from 60 and 110 was occurred at approximately 0.38 H of the wall’s height from the base but, it equal to 0.50 H for angle 110 and 120. Finally, an equation of second degree can be deduced to illustrate the relationship between the maximum facing wall displacement and the wall height with the curved wall angle.
Introduction
In the realm of civil engineering practice for the past three decades, the mechanically stabilized earth wall (MSEW) has gained widespread usage as a geosynthetic reinforced earth retaining system. Presently, MSE walls have emerged as a favorable alternative to conventional retaining walls due to their economic advantages and ease of construction. While there are numerous established design approaches for the straight sections of this type of wall, there remains a lack of definitive design guidelines for its corner sections.
Due to the absence of comprehensive understanding and specific design methodologies for corner MSEW, designers are compelled to utilize the existing typical design methods, relying on potentially inaccurate empirical rules based on plane-strain behavior. This occurs regardless of the three-dimensional nature associated with corners. Acknowledging the inaccuracy of this approach has resulted in considerable conservatism within current design guidelines. In certain cases, it leads to underestimated or inconsistent designs due to the lack of theoretical comprehension regarding corner effects, especially with open curves.
Current design standards primarily rely on comprehending two-dimensional plane-strain behavior, overlooking the three-dimensional behavior and mechanisms related to wall curves and corners. Therefore, further research and numerical modeling are necessary to understand the three-dimensional behavior and intricate mechanisms inherent in reinforced soil corner walls. This is vital for refining design guidelines and optimizing constructed infrastructures. So, this research aims to enhance our comprehension of how MSEW corners perform under service loading conditions.
The following sections present some case studies of collapse or issues encountered with the corner walls, in addition to the available literature review about corner MSEW.
Recently, an increasing number of issues and failures have been observed at the corners of MSEW. In a comprehensive study conducted by [Citation1], they examined a database of 171 failed MSEW with geosynthetic reinforcement, which included 44 cases of excessive deformation and 127 cases of partial or complete collapse of the walls. The researchers also provided valuable insights and recommendations, focusing on key aspects believed to be at the root of the performance problems seen in many of these structures.
An illustrative example can be seen in the Uptown Cairo project-Egypt, where cracks were identified in the MSEW’s corner with a right-angle in 2017. displays the extent of the cracks in the wall. It was proceeded to redesign and thoroughly inspect the wall section. The conclusion reached was that the overall design of the section was deemed safe, except for the connection at the top of the lower tier, which was recommended to be reinforced. Additionally, it was suggested that the cracks may have resulted from inefficient implementation of the connections between the blocks comprising the wall face.
Figure 1. MSE wall cracks in uptown Cairo, 2017.
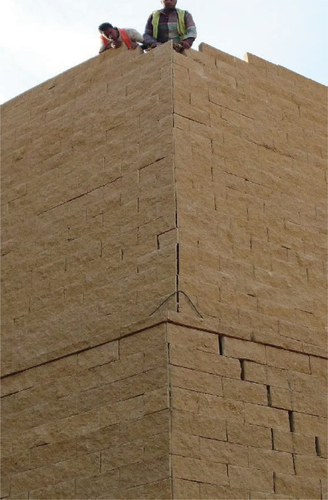
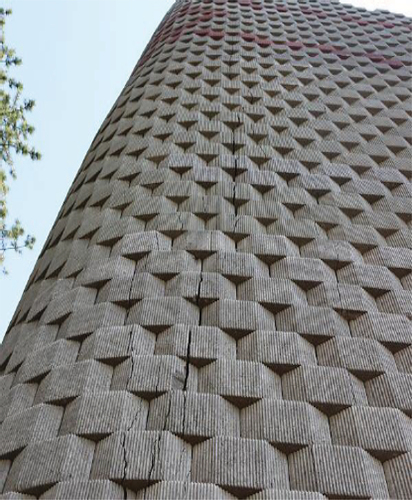
[Citation2] presented cases of collapsed curved parts in MSEW. illustrates a crack found in the concrete block of a 15 m high MSEW, occurring in its curved section. The main cause of this failure was attributed to strain concentration resulting from the insufficient length of reinforcements.
Figure 2. Cracks of curved MSEW (Andong in Korea).
Only a few researchers have addressed the issue of corner sections in MSEW [Citation3]. conducted laboratory-scale tests to analyze the behavior of the curved part of the MSEW, as depicted in . In the case of a convex curve, it was observed that a horizontal displacement approximately 1.15 times of the straight part occurred.
Figure 3. Model experiment overview plot.
[Citation4] conducted a comparative study on the behavior of curved and straight parts of MSEW, involving three-dimensional numerical analysis with considerations for the internal friction angle and relative density. Upon analyzing the horizontal displacement of the straight and curved parts of the MSEW using 3D numerical analysis and comparing their shapes, it was observed that the largest displacement occurred at the center of the convex curved part is 1.41 times of the straight section. Furthermore, extensive research has been conducted regarding the materials employed for reinforcing soil retaining walls [Citation5] and [Citation6].
The current design standards primarily rely on the understanding of two-dimensional plane-strain behavior, neglecting the three-dimensional aspects and mechanisms associated with wall corners. As a result, further research and numerical modeling are essential to comprehend the 3D behavior and intricate mechanisms involved in reinforced soil corner walls. This will lead to the refinement of design guidelines and the optimization of constructed infrastructure. Existing design procedures for reinforced walls suffer from inaccuracies or limited capabilities, including difficulties in predicting reinforcement loads and strain distributions, magnitudes and profiles of service-state deformations, the influence of facing stiffness, realistic facing toe restraint, and ground surface movement.
Model verification
Model validation is essential to ensure that the developed analytical 3D Plaxis model (finite element analysis) accurately captures real behavior and identifies the key input parameters needed to achieve a meaningful agreement between model results and field measurements. The 3D numerical model, created in Plaxis, underwent preliminary validation using experimental test results conducted by [Citation7]. Additionally, the model was further validated against an instrumented straight MSE wall upon the completion of [Citation8] field master’s thesis in 2017.
Verification of 3D plaxis model with [Citation7]
In [Citation7] study, they conducted a laboratory-scale test to simulate an MSEW with dimensions of 1.5 m width, 1.5 m length, and 0.64 m height, as depicted in . This laboratory model was later replicated in the Plaxis 3D software, as shown in . display the parameters utilized in the Plaxis model based on the same as used in the laboratory test. The reinforcement of geogrid was simulated in Plaxis using a geogrid element with a tensile stiffness of 0.06 KN/m as used in small-scale model.
Figure 4. Curved shape of a reinforced soil retaining wall [Citation7].
![Figure 4. Curved shape of a reinforced soil retaining wall [Citation7].](/cms/asset/2bbe7f98-fa2c-4648-b8c0-086acedef107/thbr_a_2309821_f0004_oc.jpg)
Figure 5. MSE wall 3D plaxis model.
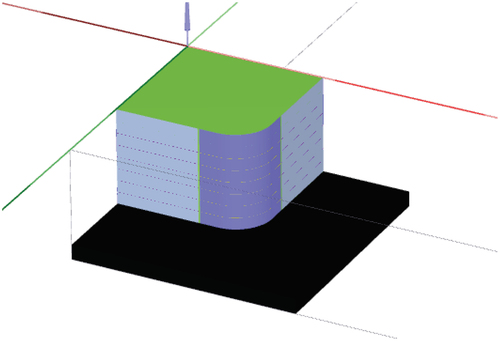
Table 1. Soil parameters.
Table 2. Facing block (plate element).
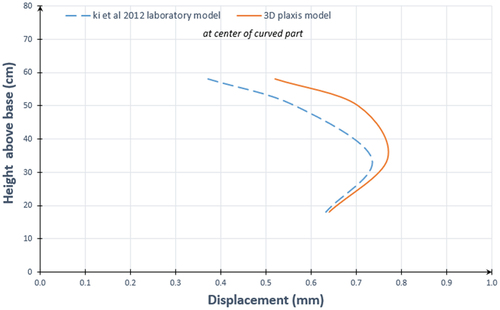
For the curved part, displays the displacement of the facing wall obtained from the 3D Plaxis model, which was then compared to the laboratory model of [Citation7], as shown in . The maximum wall displacement obtained from the Plaxis model was 0.770 mm, which closely matched the value obtained from the laboratory model 0.735 mm with less than 5% difference.
Figure 6. Horizontal displacement of facing wall at curved part from 3D plaxis model.
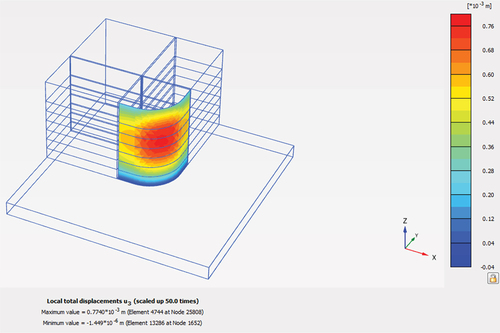
Figure 7. Horizontal displacement of facing wall at curved part for laboratory model test and 3D plaxis model.
Similarly, shows the comparison of this value with the laboratory model for the straight part. The Plaxis model yielded a maximum wall displacement of 0.685 mm, closely aligning with the value of 0.65 mm obtained from the laboratory model.
Figure 8. Horizontal displacement of facing wall at straight part for laboratory model test and 3D plaxis model.
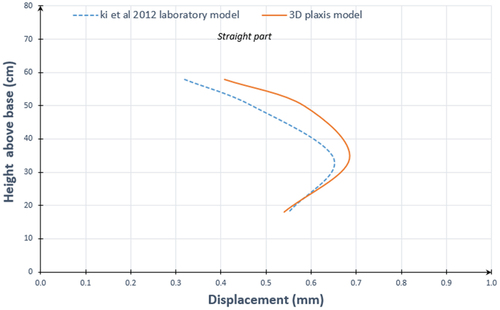
Ultimately, it was confirmed that the horizontal displacement results of the facing wall obtained from the Plaxis model were consistent with the laboratory-scale test conducted by [Citation7]. Also, according to the results obtained from both the 3D Plaxis model and the laboratory wall model, the maximum wall displacement for the curved part is approximately 1.15 times of the straight part.
Verification of model with [Citation8]
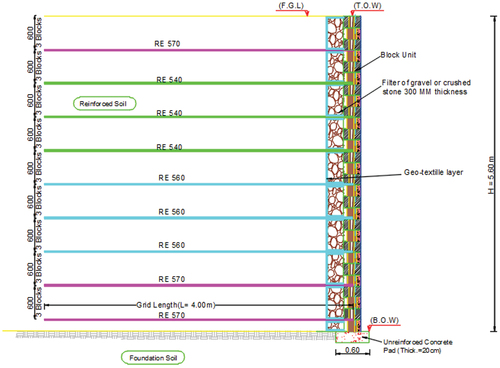
In 2017 [Citation8], monitored a straight MSE wall located in New Cairo, Egypt. This particular wall measures 4.40 meters in height and is reinforced with high-density polyethylene (HDPE) geogrid. The facing of the MSE wall comprises modular concrete blocks. The cross-sectional view of the monitored MSEW in the field is depicted in .
Figure 9. Cross section of MSEW [Citation8].
![Figure 9. Cross section of MSEW [Citation8].](/cms/asset/652a39ff-cb7f-4c41-adf5-379333655564/thbr_a_2309821_f0009_oc.jpg)
A 3D finite element model was created using PLAXIS 3D-version 2020 to simulate the behavior of the instrumented field MSE wall constructed by [Citation8] under working stress conditions. display the parameters utilized in the Plaxis model, based on the findings of master thesis. The Hardening Soil model was chosen to appropriately represent the reinforced soil in Plaxis. The facing blocks were modeled with a nominal axial stiffness equal to 0.1 of the concrete modulus of elasticity by using plate element as recommended by [Citation9]. The use of the plate element for the facing wall in the Plaxis model allows for a comprehensive analysis of the entire MSEW system, considering both the reinforced soil and the facing wall’s interactions. To simulate the geogrid, the ‘geogrid’ element was employed. The geogrid element is a specialized element that represents the behavior of the geogrid reinforcement in the numerical analysis. It allows engineers to incorporate the geogrid’s tensile stiffness, elongation properties, and other relevant characteristics into the model, accurately representing its contribution to the overall behavior of the reinforced soil system.
Table 3. Soil parameters.
Table 4. Geogrid properties.
Table 5. Facing block (plate element).
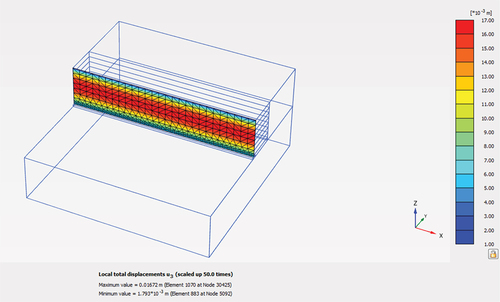
A 3D Plaxis model was carried out, as illustrated in . The deformation field of wall facing displacement in case of no surface surcharge applied are displayed in .
Figure 10. MSEW plaxis model based on monitoring of [Citation8].
![Figure 10. MSEW plaxis model based on monitoring of [Citation8].](/cms/asset/91830a20-11e7-4049-8b30-59b0ca91d805/thbr_a_2309821_f0010_oc.jpg)
Figure 11. Facing wall displacement in 3D plaxis model for q = 0 kPa.
illustrates the comparison of the maximum wall displacement obtained from the 3D Plaxis model and the field monitoring of wall. Based on the results which is obtained, a notable level of agreement was observed between 3D Plaxis model and field monitoring of MSEW.
Figure 12. Lateral movements of the facing wall based on 3D plaxis model and monitoring of [Citation8] for q = 0 kPa.
![Figure 12. Lateral movements of the facing wall based on 3D plaxis model and monitoring of [Citation8] for q = 0 kPa.](/cms/asset/136ca489-16f9-4b2f-87e1-f9b8c4db6613/thbr_a_2309821_f0012_oc.jpg)
Numerical analysis
The use of numerical modeling for geosynthetic reinforced soil systems has become prevalent in various applications, including the design of field structures, prediction of measured responses, and research to generate synthetic data for enhancing our understanding of these systems’ behavior.
Simulating a mechanically stabilized earth wall (MSEW) using 3D Plaxis is a powerful and efficient approach in geotechnical engineering. With its advanced numerical modeling capabilities, Plaxis allows engineers to accurately analyze the complex behavior of MSEWs in three dimensions. The process begins by creating a detailed 3D model of the MSEW’s geometry, including the layers of backfill soil, geogrid reinforcements, and facing elements. Material properties, such as soil parameters and geogrid characteristics, are assigned to each layer.
Boundary conditions and loading scenarios, such as applied loads or surcharges, are defined to replicate real-world conditions. By running the analysis, Plaxis calculates the displacements, stresses, and strains within the MSEW, providing valuable insights into its structural response. Engineers can evaluate the stability, settlement, and overall safety of the MSEW, making informed decisions to optimize the design and address potential failure mechanisms.
Additionally, 3D Plaxis simulations enable the examination of complex interactions between the soil, geogrid reinforcements, and facing elements, leading to a comprehensive understanding of the MSEW’s behavior under different loading conditions. This iterative process allows engineers to refine the design, ensuring the MSEW’s stability and durability over the project’s lifespan.
In conclusion, simulating a mechanically stabilized earth wall using 3D Plaxis is an essential tool for modern geotechnical analysis and design. It empowers engineers to confidently develop robust and cost-effective MSEW solutions while mitigating risks and meeting stringent safety standards for a wide range of geotechnical applications.
In this research, we employed three-dimensional Finite Element modeling (specifically Plaxis 3D – V20) to simulate the MSE walls and analyze their behavior by finding the maximum wall displacement along with the resulting geogrid forces.
Geometry of the wall
The selection of a section with an average height has been chosen for use in this research (this section has been previously designed and implemented in our projects) as shown in .
Figure 13. A random section studied for this research.
Characteristics of the model
The system consists of three types of soils: reinforced soil, backfill soil, and foundation soil, along with reinforcement geogrid and blocks. In this study, these properties were employed based on our previous experience in implementing this type of walls as detailed in the following section.
Reinforced soil
Reinforced soil is a fundamental component of mechanically stabilized earth walls, offering an efficient and economical solution for various engineering challenges. By harnessing the synergy between soil and geosynthetic reinforcements, MSE walls provide a reliable and sustainable approach to infrastructure development and earth retention systems. In 3D Plaxis model, the reinforced soil behavior is simulated by using the Hardening soil model. illustrated the parameters
Table 6. Input hardening soil model parameters of backfill soil.
Backfill soil
The backfill soil in mechanically stabilized earth walls plays a crucial role in providing the necessary strength, stability, and flexibility required for these innovative and versatile structures. When appropriately chosen and engineered, the backfill soil forms an integral part of the MSEW system, enabling safe and cost-effective solutions for a wide range of engineering applications. When making the model in this research, the backfill soil behavior is simulated by using the Hardening soil model. illustrated the parameters.
Foundation soil
The behavior of the foundation soil is simulated using the Hardening soil model, with the parameters presented in . It is assumed that the foundation soil is rigid to ensure it does not affect the behavior of the MSEW.
Reinforcement
Geogrid reinforcement plays a vital role in the successful construction of mechanically stabilized earth walls. By harnessing the strength and flexibility of geogrids, MSEWs can withstand various loading conditions and deliver cost-effective and reliable solutions for a wide range of geotechnical and civil engineering applications. In this research, the geogrid is modeled using a geogrid element in 3D Plaxis model with parameters as shown .
Table 7. Geogrid properties.
Facing blocks
The blocks are modeled by plate element with parameters as shown in . Plate element is suitable to simulate discrete facing blocks with nominal axial stiffness = 0.1 of the elastic modulus of concrete, as an appropriate approximation served to reduce numerical issues and computation time.
Table 8. Facing block (plate element).
Interface of elements
The simulation of various interface elements like soil to geogrid and soil to block in the Plaxis model involves defining and implementing appropriate interface properties (Rinter = 0.67) that mimic the interaction behavior between these elements. These properties include parameters related to friction, cohesion, stiffness, and other relevant characteristics that govern the interaction between different materials or elements within the model.
Analysis of corner MSEW
The current lack of understanding and design methodologies for corner MSEWs places designers in a challenging position, compelling them to resort to available typical design approaches for MSEWs that rely on potentially inaccurate empirical rules based on plane-strain behavior, without considering the 3D behavior associated with corners. Recognizing the inherent inaccuracy of this approach, it has resulted in significant conservatism within current design guidelines or, in certain instances, has led to underestimated or inconsistent designs due to the absence of theoretical comprehension for corner effects, especially in open curves.
The primary objective of this research is to enhance our understanding of the performance of corner MSEWs under service loading conditions through the implementation of 3D finite element modeling (Plaxis 3D). Additionally, a parametric study is conducted to discern the main factors influencing the corner behavior of MSEWs.
After performing the 3D model in the Plaxis, the horizontal displacement of the wall, which measures the horizontal change in the wall’s position, is determined. Additionally, the strains occurring in the geogrid, which arises from the forces acting on it, are estimated.
The strain of a geogrid is related to the forces applied to it through the concept of stress-strain relationship. When a geogrid is subjected to external forces (tensile or shear forces), it undergoes deformation, and the amount of deformation is represented by strain.
The relationship between stress and strain is approximately linear for geogrids within their elastic range. This means that as the applied force (stress) increases, the deformation (strain) also increases proportionally. This relationship can be expressed by Hooke’s Law: Stress (σ) = Young’s Modulus (E) * Strain (ε)
For geogrids in their linear elastic range, the strain (ε) is directly proportional to the applied stress (σ), and the Young’s Modulus (E) represents the slope of the stress-strain curve.
The maximum allowable strains of geogrid can vary depending on the specific type and design of the geogrid, as well as the engineering standards or guidelines being followed. In general, the allowable strains for geogrids are expressed as a percentage of their initial length. For example, a common allowable strain limit for geogrids might be in the range of 5% to 10% of their original length.
Comparison between right-angle (sharp turns) and curved (round off) wall at corner MSEW
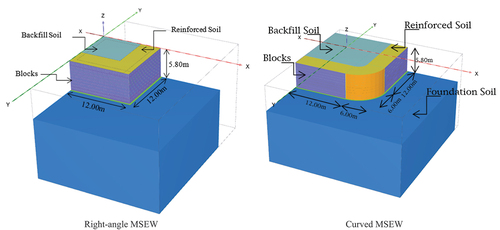
A 3D Plaxis model is conducted to express the wall in the case of a right-angle and the case of the curved walls. shows the horizontal projection of the MSEW in the case of a right-angle and a curved walls. illustrated Plaxis models for right-angle and curved walls, respectively. The considered geogrid setup at curved zone radial and at the right-angle (sharp turn) zone is orthogonal arrangement both perpendicular directions.
Figure 14. A plan of MSEW in case of right-angle and curved wal.
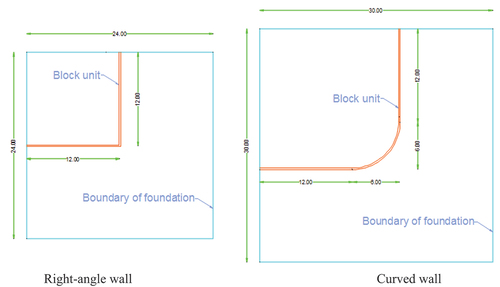
Figure 15. 3D plaxis model for MSEW.
Effect of change internal curve angle of curved wall at corner MSEW
The internal angle of the curved wall affects the distribution of stresses and strains within the MSEW, as well as the displacement and deformation patterns. A smaller angle of curvature may induce higher stresses and concentrated displacements at specific points along the wall, potentially leading to localized failure mechanisms. On the other hand, a larger angle of curvature may result in more evenly distributed stresses and deformations, promoting overall stability.
Understanding the effect of the internal curve angle of curved walls at corner MSEWs is essential for proper design and optimization of these structures. It requires sophisticated numerical modeling and analysis techniques, such as 3D finite element analysis (3D Plaxis), to accurately simulate the complex behavior of the curved wall under various loading conditions.
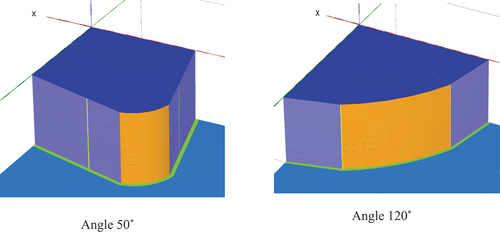
This section explores the impact of internal curve angle variation from 50° to 120° for the curved wall at the corner of the MSEW. The different cases for the curved MSEW were investigated, with angles of 50°, 60°, 70°, 80°, 90°, 100°, 110° and 120°.
To study these cases further, 3D Plaxis models were constructed for each of the eight curved wall configurations (50 to 120 degrees). shows the 3D Plaxis model for the cases of curved wall with difference angles of 50 and 120.
Figure 16. 3D plaxis model for curved wall with difference angle.
Results and discussion
After validating the 3D Plaxis model against both the laboratory model conducted by [Citation7] and the field MSEW monitored by [Citation8], and confirming its accuracy, models were created to investigate the corner part of the MSEW. These models encompassed both the right-angle and curved wall configurations with varying angles.
Comparison between right-angle (sharp turns) and curved (round off) wall
To begin, a comparison was made between the right-angle and the curved angle of 90º for the MSEW at the corner part. displays the wall facing displacement for the right-angle and curved wall in the Plaxis model.
Figure 17. Facing wall displacement.
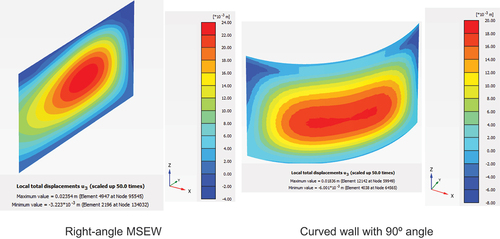
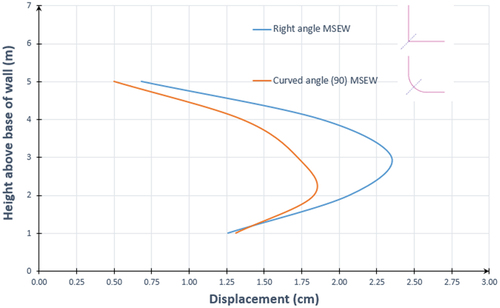
illustrates the comparison of wall facing displacement between the right-angle and curved wall. It is observed that the horizontal displacement of the right-angle wall is greater than that of the curved angle (90º). The largest displacements for the right-angle and curved wall are 2.35 cm and 1.83 cm, respectively. The maximum horizontal displacement occurs at approximately 54% and 40% of the wall height, measured from the wall base, for the right-angle and curved wall, respectively.
Figure 18. Comparison of wall facing displacement for right-angle and curved wall with 90º angle.
illustrates the maximum wall displacement as obtained from the 3D Plaxis model for right-angle and curved wall, respectively.
Figure 19. Maximum facing wall displacement.
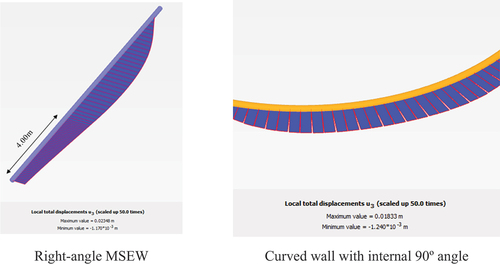
It is evident that the maximum wall displacement for the right-angle occurred at 4.00 m (75% of the height) from the corner, which is the distance of the geogrid in the opposite direction. This can be explained by the geogrid’s presence on the other side, which reinforces the soil relatively in this area and reduces the lateral earth pressure on the soil. However, the lateral earth pressure increases thereafter, leading to the maximum displacement.
Referring to , which illustrates the maximum horizontal wall displacement, it was observed that the value of horizontal displacement is minimal at the beginning of the curve and gradually increases until it reaches the maximum displacement at the midpoint of the curve. This explains the presence of the maximum lateral earth pressure at the midpoint of the curve.
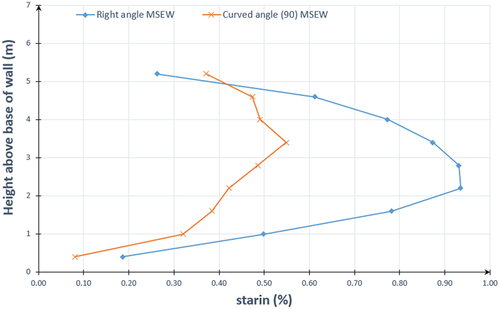
illustrates the strains obtained from the numerical model across the geogrid layers. The maximum geogrid strain for the right-angle wall is 0.93%, whereas in the case of the curved wall, it is 0.55%. Therefore, the geogrid strain for the right-angle wall is approximately 1.70 times of the curved wall. It is evident that the maximum geogrid strain occurs in the layers located at the mid of the wall, which aligns with the presence of the maximum wall displacement.
Figure 20. Strain distribution across the geogrid layers.
Effect of change internal curve angle of curved wall
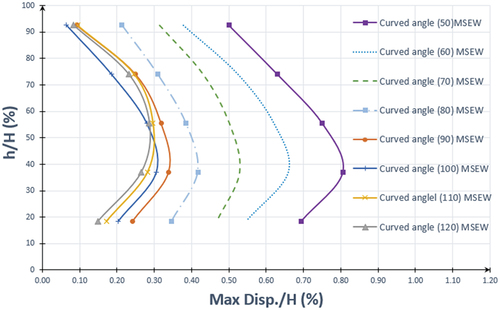
Secondly, the impact of angle variation for the curved wall at the corner of the MSEW was studied, considering the cases with angles of 50, 60, 70, 80, 90, 100, 110, and 120 degrees. shows the comparison of wall facing displacement among all cases of different angles of wall (This comparison is limited to the considered parameters assumed in this research). It is evident that the horizontal displacement values of the wall between angles from 90 to 120 are quite close, but they differ significantly from 50 to 90. Furthermore, it was concluded that the maximum displacements for angles 50, 60, 70, 80, 90 and 100 occurred at approximately 0.38 H from the base but was equal to 0.50 H for angle 110 and 120.
Figure 21. Wall facing displacement for curved wall with different angles from 50 to 120.
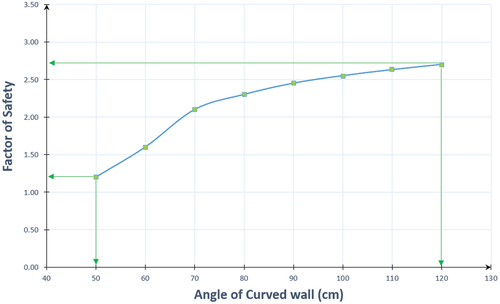
Results of the safety factor can also be analyzed with changes in the wall’s angle, as shown in (This relation is limited to the considered parameters assumed in this research). It is clear that the factor of safety increases as the angle of the wall increases. It can be concluded that the safety factor increases at a higher rate when changing the angle from 50 to 90 degrees, and the rate of increase is smaller when changing the angle from 90 to 120 degrees. Comparing the safety factor results with the facing wall displacement results when changing the angle, it can be said that the wall at an angle of 90 degrees or greater is considered the ideal angle.
Figure 22. Factor of safety for curved wall with different internal curved angles from 50 to 120.
illustrates the maximum displacement as a percentage of the height (Within the height range of 5.40 m, geogrid and soil properties assumed in this research) of wall with different angles of curved wall. An equation of second degree can be deduced to illustrate the relationship between the maximum facing wall displacement and the wall height with the curved wall angle, as evident in the following equation (This equation is limited to the considered parameters assumed in this research).
Figure 23. Maximum displacement per height of wall with different angles of curved wall.
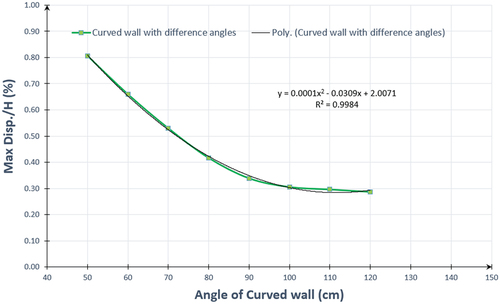
Where:
Max Disp. = Maximum displacement for facing wall
H = Height of MSE wall
δ = Angle of curved wall
The following illustrates the specific locations of wall failure in relation to the start of the curve and length of curve (Lc). It is evident that the wall failure occurs approximately at the midpoint of the curve when the curve angle is 50 degrees. Subsequently, the failure point moves away from the midpoint until it reaches 0.4 Lc from the start of the wall when the curve angle is more than 90 degrees.
Table 9. The specific locations of wall failure for different internal angles
Finally, results of this research were compared to results available in the literature. illustrates the results of the laboratory experiment on the wall with a 90-degree angle and a height of 64 cm for the [Citation7] and compare it to the Plaxis model that was studied for the 540 cm and 64 cm wall heights.
Figure 24. Facing wall displacement for curved wall with different angles from 50 to 120.
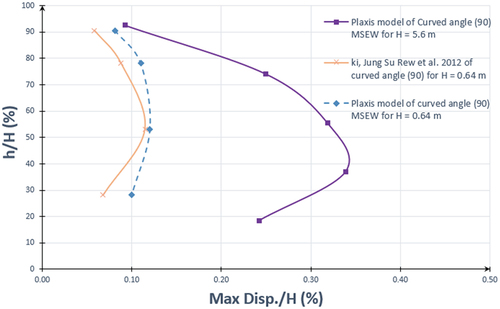
Based on the comparison with [Citation7], it was concluded that, the maximum wall displacement as a percentage of the height obtained from the Plaxis model was 0.120%, which closely matched the value obtained from the laboratory model, which was 0.115%. But when compared to the wall that was studied with a height of 5.40 m, it was found that the wall displacement increased to 0.34%, so it was found that there is no similarity between the results. However, the wall with the larger height has a higher displacement value, which can be explained by the fact that the laboratory experiment was conducted on a very small wall, resulting in smaller displacement values. As the height of the wall increases, the displacement ratio increases, when representing the laboratory model with the same dimensions and height, it was found that the displacement is very close to the laboratory experiment. Based on the previous comparison, it can be inferred that the height of the wall affects the displacement ratio of the wall.
(Jong-Hyun Lee, Suk-Min Kong et al. 2018) was observed that the largest displacement occurred at the center of the convex curved part, measuring 1.41 times larger than the straight section. In this research for curved wall with angles 90 degree, it was concluded that the maximum of wall displacement is equal to 1.83 cm which was occurred at the center of curve but it is equal to 1.35 cm for straight part. So, the maximum of wall displacement for curved part is 1.35 times of the straight part. From this compression, it was concluded that there is a good agreement between them.
It was conducted a comparison between the analytical findings related to the anticipated maximum forces at the geogrid for curved wall (from Plaxis model), comparing it against the conventional Limit Equilibrium methods (using MSEW program) as shown in . It’s evident that the generated force values in the geogrid are higher when representing the curved wall with angle 90° in the 3D Plaxis Software compared to representing them in Limit Equilibrium methods. This underscores the significance of studying curved walls and understanding their behavior as three-dimensional entities.
Table 10. Maximum force at geogrid layer.
Summary and conclusions
This research work involved verifying the finite element model (3D Plaxis) against both the laboratory MSEW [Citation7] and the field monitoring of MSEW [Citation8] Subsequently, a comparison was made between the right-angle and curved wall. Additionally, the effects of changing the angle of the curved wall from 60º to 120º were considered. After conducting the 3D Plaxis model for all cases, wall facing displacement was analyzed, and the predicted (calculated) tensile forces in the geogrid layers were presented. Based on the results of this research, the following conclusions can be drawn:
Once calibrated, the utilization of 3D Plaxis software for finite element analysis has proven highly effective in predicting facing wall displacement.
A 3D finite element model was successfully developed using Plaxis 3D on the field monitored straight wall and laboratory curved wall with good agreement for lateral deformations and geogrid tensile forces.
The horizontal displacement of the wall in the case of the right-angle wall is greater than the curved angle (90º), as the largest displacement in the case of the right and curved wall is 2.64 cm and 1.83 cm, respectively.
The maximum horizontal displacement occurred at approximately 0.54 H and 0.38 H from the wall base in case of right-angle and curved wall, respectively.
The maximum wall displacement for the right-angle occurred at 4.00 meters (75% from height) from the corner, which is the distance of the geogrid in the opposite direction.
For curved wall with 90° angle, the maximum horizontal wall displacement, it was observed that the value of horizontal displacement is minimal at the beginning of the curve and gradually increases until it reaches the maximum displacement at the midpoint of the curve. This explains the presence of the maximum lateral earth pressure at the midpoint of the curve.
The maximum geogrid strain for the right-angle wall is 0.93%, whereas in the case of the curved wall, it is 0.55%. Therefore, the geogrid strain is approximately 1.70 times greater for the right-angle wall compared to the curved wall. It is evident that the maximum geogrid strain occurs in the layers located at the mid of the wall, which aligns with the presence of the maximum wall displacement in the middle region.
For curved wall with different angles, the horizontal displacement values of the wall between angles 90 and 120 are quite close, but they differ significantly from 60 to 90.
The maximum displacements for angles 50, 60, 70, 80, 90 and 100 was occurred at approximately 38% of the wall’s height from the base but, it equal to 50% for angle 110 and 120.
An equation of second degree was deduced to illustrate the relationship between the maximum facing wall displacement and the wall height with the curved wall angle.
It can be said that the MSEW at a curved angle of 90 degrees or greater is considered the ideal angle.
It was concluded that the geogrid strain is approximately 4.0 times greater for the curved wall with angle 50° compared to 120°.
Recommendations for further research
The following are some suggestions for further extensions of these investigations:
Field MSEW should be monitored to measure facing wall displacement and also to assess the tensile forces in the geogrid layers, comparing them with the results of this research.
The curved MSEW are being studied at varying heights along with different soil properties.
It is suggested to study behavior for curved corners of MSEW on cohesion soils.
Disclosure statement
No potential conflict of interest was reported by the author(s).
References
- Koerner RMK, R G. A data base, statistics and recommendations regarding 171 failed geosynthetic reinforced mechanically stabilized earth (MSE) walls. Geotext Geomembr. 2013;40:20–27.
- Kim YJJ, Sang Lee H, Yong Joo O, et al. Behaviour analysis of reinforced soil retaining wall according to laboratory scale test.pdf. Appl Sci. 2020;10(3):901.
- Ki JS, Rew WH, Kim SK, et al. A behavior of curve section of reinforced retaining wall by model test. J Korean Soc Civil. 2012;32(6C): 2249–2257. November: 2012.
- Lee J-H, Oh D-W, Kong S-M, et al. Investigation of behaviours of wall and adjacent ground considering shape of geosynthetic retaining wall. J Korean Geosynth Mat Soc. 2018;17(1):95–109.
- Mohamed Adel Marey Hammad, Mohamed Ibrahim Amer and M. A. Salem (2017). Field M. Baral P, Bergado DT, Duangkhae S. The use of polymeric and metallic geogrid on a full-scale MSE Wall/Embankment on hard foundation: a comparison of field data with simulation. Int J Geo-Eng. 2016;7(1):20. doi: 10.1186/s40703-016-0035-6
- Sridhar R, Prathap Kumar MT. Effect of number of layers on coir geotextile reinforced sand under cyclic loading. Int J Geo-Eng. 2018;9(1):11. doi: 10.1186/s40703-018-0078-y
- Ki JS, Rew WH, Kim SK, et al. A behavior of curve section of reinforced retaining wall by model test. KSCE J Civil Environ Eng Res. 2012;32(6C):249–257. doi: 10.12652/KSCE.2012.32.6C.249
- Hammad MAM. Field monitoring and numerical modeling of mechanically stabilized earth wall. In: Adel M, Hammad M, editors. Faculty of engineering. Egypt: Cairo University Giza; 2017.
- Yoo C-S. Behavior of a geosynthetic reinforced two-tier segmental retaining wall on a yielding foundation.Pdf. J KGS. 2005;21(7):21–29.