
 ?Mathematical formulae have been encoded as MathML and are displayed in this HTML version using MathJax in order to improve their display. Uncheck the box to turn MathJax off. This feature requires Javascript. Click on a formula to zoom.
ABSTRACT
Degradation in reinforced concrete (RC) members associated with rebar corrosion in old buildings is one major concern that can significantly affect the strength and serviceability of RC structures. Strengthening existing structures using FRP can comprise complex assessment and design processes. This study addresses the critical issue of modeling the behavior associated with steel reinforcement corrosion in RC slab-column joints (SCJs). Three modeling methods, namely artificial neural network (ANN), Eureqa’s symbolic regression algorithm, and analytical modeling, are proposed to predict the punching shear (PS) capacity of corroded RC SCJs by accounting for the changes in material properties due to corrosion and the strengthening provided by different types of FRP. The accuracy of the proposed models is validated through comparisons with experimental results and a verified finite element (FE) model that considers material deterioration and bond degradation. The results demonstrate that the proposed models offer more accurate PS capacity predictions than existing design codes. Among the considered prediction models, the ANN model exhibits superior performance and is recommended for PS capacity prediction. A practical design tool in the form of a graphical user interface (GUI) was created to facilitate the assessment and prediction of the PS behavior of corroded RC SCJs. Engineers can conveniently use this GUI to evaluate and predict the performance of such joints.
Introduction
The degradation of reinforced concrete (RC) building structures due to corrosion is an important issue because many structures that are currently in use have a higher likelihood of significant corrosion in their reinforcement bars. Corrosion of building structures can lead to various hazards, such as falling ceiling slabs that can injure people below. Corrosion causes a reduction in the strength of RC, as rust has a higher volume but lower density than steel, leading to expansion around the reinforcements [Citation1,Citation2]. Consequently, this leads to elevated tensile stress in the concrete surrounding the rebars, presenting a concern as concrete is susceptible to weakness in tension. As the corrosion continues, the concrete surrounding the rebars undergoes cracking and spalling. Additionally, the rebar corrosion can result in micro-cracks in the concrete, which leaves more rebars exposed to corrosion. Corrosion also results in a significant deterioration in the mechanical properties of both the rebars and the concrete [Citation1–4].
Numerous experimental studies on PS capacity have been conducted to understand the behavior of the SCJ area. Earlier experimental studies define the effect of various factors on the PS behavior of RC SCJs. These factors included column size, slab size, concrete compressive strength, steel yield strength, reinforcing ratio, supporting, and loading conditions, the layout of reinforcement, loaded area, and boundary restraint. As a result of the experimental observations, various mechanical theories-based models have been created [Citation5–15]. Kinnunen and Nylander [Citation8] studied the experimental results of circle slab-circle column connection and created the sector model, one of the most well-recognized mechanical models for shear punching in slabs. Subsequently, Broms [Citation7] developed a modified model that took the impact of size effect into consideration, which helped determine the ultimate angle of the slabs and eliminated the punching failure mode of flat plates. In accordance with the shear stress model developed by Stasio et al. [Citation14], Moe proposed a more efficient model with broader applicability [Citation13]. This served as the theoretical basis for GB 50,010–2010 [Citation12] and ACI 318–19 [Citation9]. The critical shear crack theory was proposed by Muttoni [Citation6] after studying the impact of aggregate size and analyzing the critical cracks of SCJs. Wu et al. [Citation5] recommended a prediction model that depends on the modified compression field theory, and a large amount of experimental data was utilized to prove the efficiency of the model. Chetchotisak et al. [Citation15] developed a prediction model for PS capacities of RC slabs using regression analysis of experimental data. However, it has been proven that both mechanical and experimental models often face challenges in predicting accurately [Citation16,Citation17].
Due to recent developments in data analysis techniques, simpler, more practical, and more accurate new models than the previous ones can now be created. In addition, researchers can create new empirical models for design applications by utilizing the experimental results extracted by others and merging them with advanced computational techniques. Computational approaches are becoming more popular for modeling most engineering complex behaviors because they have shown good predictive ability compared to conventional approaches. Artificial intelligence (AI) techniques are one of the fastest-growing research areas that are attracting the attention of a variety of engineering fields. (AI) techniques are algorithms that search for the best answer to a given problem based on a set of criteria. (AI) methods can be divided into statistical methods like fuzzy logic, decision tree methods such as expert systems, human brain imitation methods like artificial neural networks, evolutionary methods like genetic algorithms and genetic programming, and methods that mimic the behavior of real-world animals like ant colonies and particle swarms [Citation18–20]. A review of previous literature [Citation15,Citation21,Citation22–25] proved that artificial neural networks adaptively learn from experiences and extract functions that are appropriate for the purpose. ANN models can operate on huge amounts of data and learn complicated mathematical functions from examples. The main advantage of the ANN model above conventional modeling methods is its ability to accurately represent complex and nonlinear interactions between parameters in a system without pre-assuming the relationship between input and output variables.
The majority of existing equations to calculate the PS capacity of RC SCJs have not taken into account the impact of corrosion. Moreover, there has been limited attention given to predicting the PS capacity of RC SCJs that are both corroded and strengthened. To address this research gap, three models were developed, taking into consideration the degradation of material properties due to corrosion and the strengthening effects of various types of fiber-reinforced polymer (FRP) sheets. These models’ efficacy is demonstrated by comparing them to available experimental results. Finally, a graphical user interface (GUI) based on the optimal model is presented as a practical design tool for RC slab-column joints affected by corrosion.
Dataset preparation
The dataset includes 569 specimens from two sources, previous literature work and developed numerical analysis as shown in Table S1 (supplementary file).
Dataset from literature work
A comprehensive dataset comprising 53 sets of experimental data was collected from numerous references in the literature [Citation26–32], as detailed in Table S1 (supplementary materials).
Dataset from finite element simulation
Additional 516 datasets had to be extracted using numerical analysis to overcome the shortage in the available data from the literature, as most of the previous studies did not consider the corrosion factor when investigating the PS capacity of RC SCJs. The numerical analysis was conducted using the available commercial software ABAQUS. The detailed finite element modeling for the conducted numerical analysis can be found in Ahmed et al. [Citation1]. contain the details of the experimental specimens used for verification.
Table 1. Details of the experimental specimens used for verification.
The results of the numerical models were compared with the results of experimental specimens as presented in . The PS behavior of corroded and uncorroded slabs could be accurately predicted by the FE models; each specimen’s simulated curve closely resembles its measured curve as shown in . represent the results of the FE models compared with Ahmed et al. [Citation1], and M.A.L.Silva, et al. [Citation28] experimental results.
Figure 1. Load–deflection curves between test and FE models, a) Ahmed et al.[Citation1], and b) M.A.L.Silva, et al. [Citation28].
![Figure 1. Load–deflection curves between test and FE models, a) Ahmed et al.[Citation1], and b) M.A.L.Silva, et al. [Citation28].](/cms/asset/c5dc4be9-8488-465a-a12d-4180b6cb9def/thbr_a_2310936_f0001_oc.jpg)
Table 2. Finite element modeling accuracy.
Dataset description
The slab effective depth, concrete compressive strength, span-to-depth ratio, reinforcement ratio, column dimension, yield strength of reinforcement, corrosion degree, FRP tensile strength, FRP Young’s modulus, and FRP reinforcement ratio are considered as the input variables. illustrates the minimum, maximum, standard deviation, and average of the considered parameters. The targeted output of the proposed models is the PS capacity (Vu) of the SCJs. The frequency distribution of the input variables in the dataset is shown in .
Figure 2. Frequency distribution of input variables.
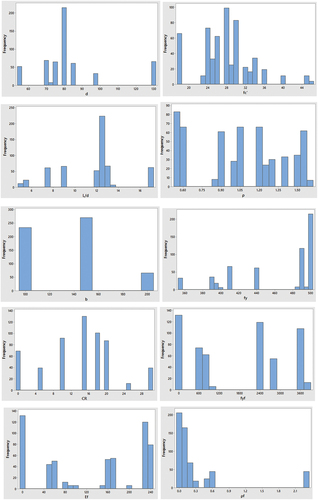
Table 3. Variables statistical description.
Effective parameters and correlation
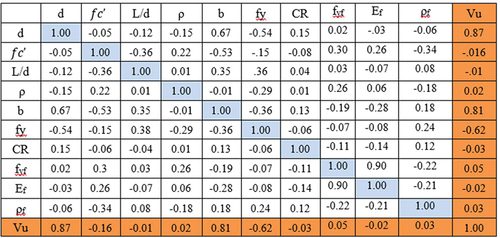
shows the correlation between input and output variables for the dataset. It can be noticed from that there is a strong positive correlation with d, b, and ρf and a negative correlation with , fy, and CR. However, there is a very weak correlation with ρ, L/d, and Ef. The correlation coefficients described in are precise for linear relationships but still give an indication of the relative importance of the parameters.
Figure 3. Correlation plot of the dataset between each input variable and the PS capacity.
Proposed models
The artificial neural network model
The ANN model is developed using the dataset collected in Table S1 (supplementary file). An artificial neural network (ANN) is composed of interconnected processing components called neurons. These neurons are linked together with weights that are initially set arbitrarily during training. The network then adjusts these weights by comparing the predicted values to the actual values and propagates the errors backward through the network to minimize them. This procedure, referred to as backpropagation, adjusts the weights based on the error rate from the preceding training cycle. The primary benefit of an ANN is its ability to obtain complex connections between input and output variables, even in the absence of prior knowledge about these relationships. As shown in Eq. (1), the weighted input values are summed along with the input layer’s bias as part of the computations within the ANN network. The results are then transmitted to the neurons in the hidden layer. Within these neurons, the tang-sigmoid function is applied, as described in Eq. (2). The weighted output from the hidden layer neurons is then combined with the bias of the hidden layer through another linear process using the purelin function, as seen in Eq. (3).
where represents the weighted sum generated at the jth hidden neuron;
represents the input value from the ith input neuron;
and
represent the weights applied to the hidden layer and the output layer neurons, respectively;
and
indicate the biases applied to the hidden layer and the output layer neurons, respectively;
signifies the processed output generated by the jth hidden neuron;
represents the processed output produced by the kth output neuron; n corresponds to the number of input neurons, and m signifies the number of neurons in the hidden layer.
In this investigation, the input layer of the neural network consists of 10 neurons representing the 10 input parameters, while the output layer contains one neuron for the parameter Vu. Prior to the training process, the datasets are normalized within a range of (-1, 1) to standardize the different interval values to a common scale. This normalization process ensures that the input vectors’ components are orthogonalized, preventing correlation between them and accelerating convergence during the training phase. According to reference [Citation33], the normalized data value is calculated using the following equation:
where represents the data sample,
represents the normalized data sample, while
and
are the minimum and maximum values of the data for the parameter under consideration.
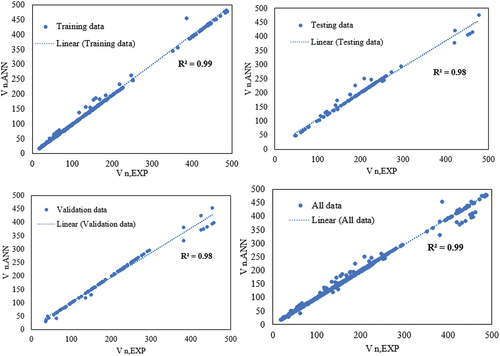
To ensure the neural network’s effective training, testing, and validation, the dataset was split into three parts: 70% for training, 15% for testing, and 15% for validation. To find the best ANN model for these specific data, a sensitivity analysis was conducted. This involved varying the number of neurons in the hidden layer within the range of 5 to 15 and testing 10 different learning algorithms. Comparisons were made based on the best training, validation, and testing performance. It was found that the Levenberg-Marquardt (LM) algorithm with nine neurons in the hidden layer exhibited the best performance. Consequently, the final ANN model, as presented in consists of an input layer with 10 inputs, an output layer with one output, and a hidden layer with nine neurons. illustrates the performance of the ANN model during the training, testing, and validation processes. The 33th epoch achieved the best validation performance, as evidenced by the minimum mean squared errors, indicating a reliable ANN model. In , a regression model displays the correlation between the actual values and the predicted values generated by the ANN model. The coefficient of determination (R2) for training, testing, and validation, and all data are 0.99, 0.98, 0.98, and 0.99, respectively. These coefficients being close to 1 indicate successful training. Once the ANN’s ability to predict output variables is effectively confirmed, the model can be frozen, and the network is now ready to compute output values for new input data related to corroded RC SCJs.
Figure 4. ANN model composed of eight neurons in one hidden layer.
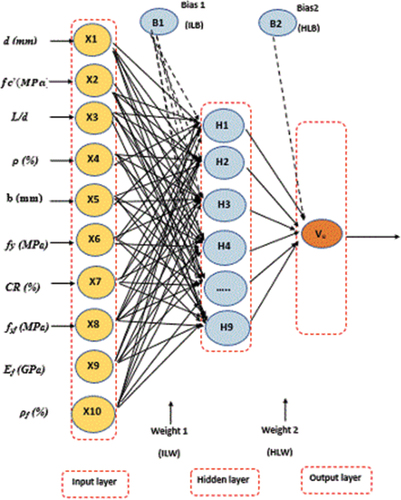
Figure 5. Performance of the ANN model.
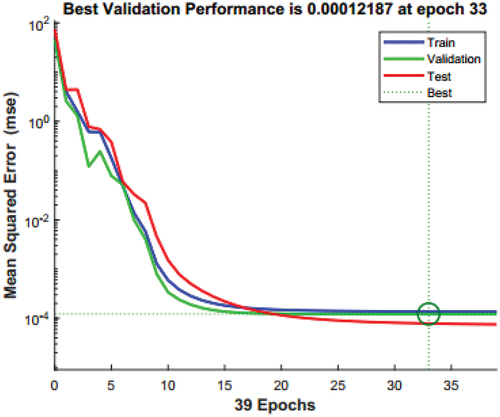
Figure 6. Regression analysis for training, validation, testing, and all data of ANN model.
Eureqa model
A new empirical equation, denoted as Eq. (5), is introduced to calculate the PS capacity () of the corroded SCJ. This equation is derived from the dataset collected in Table S1 (supplementary file). The Eureqa model is constructed utilizing the machine learning software, Eureqa [Citation34], which allows the generation of mathematical equations to represent input and output relationships. The models are formulated by incorporating mathematical operations like addition, subtraction, multiplication, and exponential functions, and the equation with the lowest error in data fitting is selected as the final model.
The initial dataset considered various parameters related to slab geometry (d, b, and L/d), material mechanical properties (fcu, fy), reinforcement ratio (ρ), strengthening properties (,
), and the influence of corrosion (CR). The proposed Eureqa equation effectively models the PS behavior of corroded SCJs, yielding a high correlation coefficient of 0.97.
Analytical model
The PS capacity of slabs increases as their flexural capacity increases. An analytical equation has been modified to calculate the PS capacity of RC SCJs, Vu (Eq. 6) based on Mowrer and Vanderbilt’s (1967) [Citation35] Equation.
Where represents the perimeter of the column or the loaded area (mm),
is the slab’s effective flexural depth (mm),
represents the side length of a square loaded area or width of a column (mm),
is the concrete compressive strength, and
is the flexural capacity of the slab, which can be obtained as in Eq. 7 based on the yield line analysis (Soudki,2012; Elstner and Hognestad,1956) [Citation32,Citation36].
Where is the overall width of the slab, and
is moment capacity per unit width, can be determined using standard methods such as the one existing in the ACI Building Code (EquationEq 8
(8)
(8) ).
Where is the corroded reinforcement ratios of the rebars (Eq. 9),
is the external FRP reinforcement ratio (Eq. 10),
represents yield stress of corroded reinforcing steel Eq. (11), and
in Eq. (12) is a measure of efficiency that compares the stress created in FRP strips at the specimens’ ultimate strength capability to their ultimate strength
of the strips, and accounts for possible delamination failure from concrete [Citation37].
Where represents the cross-sectional area of the rebars used per slab panel of width
,
EquationEq (18
(18)
(18) ) is the area of an FRP strip’s cross-section;
corresponds to the height of the slab section,
determined according to Ref [Citation2,Citation38].
The active bond length, , Eq. (13) represents the length over which the bond stress is maintained.
Where and
represent the FRP strip thickness and modulus of elasticity for hybrid composite, respectively.
The factor , as defined in Eq. (14) and representing the modulus of elasticity for the hybrid composite, is expressed as follows:
where ,
,
, and
are the elastic modulus and volumetric fraction of the CFRP fibers and GFRP fibers, respectively.
The volumetric fraction of the fibers is calculated as Eq. (15)
where the volume fraction of fibers,
weight of fibers,
weight of the matrix,
density of fibers,
the density of the matrix.
The factors Eq. (16) and
Eq. (17) which account for the concrete strength and wrapping scheme are given as:
Where represents the slab length in the direction of FRP strips. Sharaf et al.. (2006) [Citation29] improved this model by changing how the effective area of the FRP strips is calculated to account for the effects of the configuration, quantity, and spacing of the strips on strengthening:
in which, Eq. (19) corresponding to a parameter that represents the influence of FRP orientation and is given as:
In this context, represents the orientation of FRP strips relative to steel bars, and
takes the value of 1 when FRP strips are perpendicular to the steel bars and 2 when they are arranged at an angle. The factor
in Eq. (20) calculated as:
Where represents the width of the FRP strip,
represents the distance from the center of each FRP strip to the column face, and
represents the total number of FRP strips per slab width.
The analytical model (EquationEqs (6(6)
(6) )– (EquationEq 20
(20)
(20) )) was modified in this study by taking a percentage of corroded flexure reinforcement (EquationEq 9
(9)
(9) ) and taking into consideration the modulus of elasticity for hybrid fiber reinforcement (EquationEq 14
(14)
(14) ).
Accuracy of the proposed models
Three predictive models for PS capacity are compared with experimental and FE model validation results. Additionally, the accuracy of these models is assessed by comparing them with four international codes: ACI 318–19 [Citation39], CSA 23.3–14 [Citation40], BS 8110–97 [Citation41], and Eurocode 2 [Citation42]. The design formulas from the international codes used to calculate the PS capacity are provided in Table S2 (supplementary file). The model’s effectiveness is evaluated using statistical metrics, including the mean (θ) and the Coefficient of Variation (CoV).
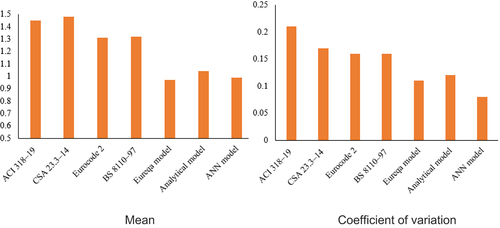
shows the comparison between the three models with four previous codes. According to the statistical measurements depicted in , the PS capacity predictions of the tested slabs using the four international code equations are significantly conservative when compared to the analytical model. The mean value is 1.45,1.48, 1.31, and 1.32 using the ACI, CSA, Eurocode 2, and BS 8110–97 equation compared to 0.99 for the ANN model as shown in . Notably, the code equations do not account for FRP reinforcement, and these provisions are not intended for FRP design. The results indicate that the ANN model used for predicting PS capacity is highly accurate, consistent, and safe for design purposes, with a mean coefficient of variation of 0.99 and 0.08, respectively. It can be concluded that the ANN model outperforms all other design equations and is the optimal choice for predicting PS capacity in this study.
Figure 7. Comparison between all models.
Development of a graphical user interface
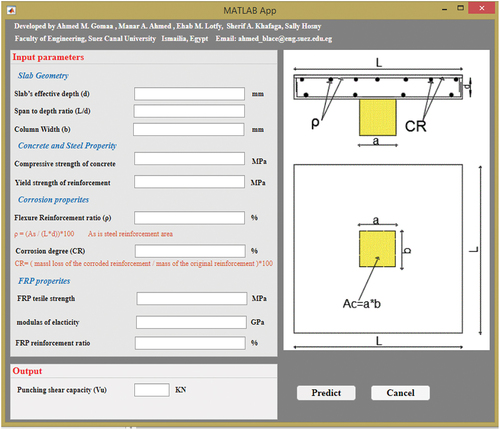
In this study, a graphical user interface (GUI) was developed as a simple tool to predict the PS behavior of corroded RC SCJs using the ANN model. The GUI, shown in , requires 10 input variables and provides one output prediction. For accurate results, the input variables should be within their respective ranges based on their statistical properties in .
Figure 8. Graphical user interface (GUI) for the proposed ANN model.
Conclusions
The study’s results lead to the conclusions:
The errors in the finite element simulations are within acceptable limits, and the results closely match the experimental measurements.
The finite element model accurately predicts the PS capacity of both uncorroded and corroded SCJ specimens.
The three proposed models in this study provide a better prediction for the PS capacity of corroded RC SCJs compared to current design codes (ACI 318-19, CSA 23.3–14, Eurocode 2, and BS 8110–97).
The ANN model outperforms all other design equations and is the optimal choice for predicting PS capacity in this study.
A GUI that can easily be used to predict the PS capacity of reinforced concrete slabs was developed. This tool has the advantage of being easier to utilize than traditional approaches like experimental investigations and finite element modeling.
supplementary_file_.docx
Download MS Word (138.1 KB)Disclosure statement
No potential conflict of interest was reported by the author(s).
Supplementary material
Supplemental data for this article can be accessed online at https://doi.org/10.1080/16874048.2024.2310936
References
- Gomaa AM, Lotfy EM, Khafaga SA, et al. Experimental, numerical, and theoretical study of punching shear capacity of corroded reinforced concrete slab-column joints. Eng Struct. 2023;289(May):116280. doi: 10.1016/j.engstruct.2023.116280
- Qian K, Li JS, Huang T, et al. Punching shear strength of corroded reinforced concrete slab-column connections. J Build Eng. 2022;45(August 2021):103489. doi: 10.1016/j.jobe.2021.103489
- Yalciner H, Kumbasaroglu AACISJ. Experimental study to predict bond-slip behavior of corroded reinforced concrete columns. ACI Structural Journal. 2022;119(5). doi:10.14359/51734795.
- Qian K, Liu JG, Yu XH, et al. Experimental and numerical investigation of punching shear capacity of corroded reinforced concrete slab-column connections. Struct. 2022;43(July):1548–1557. doi: 10.1016/j.istruc.2022.07.065
- Wu L, Huang T, Tong Y, et al. A modified compression field theory based analytical model of RC slab-column joint without punching shear reinforcement. Buildings. 2022;12(2):226. doi: 10.3390/buildings12020226
- Muttoni A. Punching shear strength of reinforced concrete slabs without transverse reinforcement. ACI Struct J. 2008;105(4):440–450. doi: 10.14359/19858
- Broms CE. Concrete flat slabs and footings: design method for punching and detailing for ductility. Doctoral dissertation: KTH; 2005.
- Kinnunen S, Nylander H. Punching of concrete slabs without shear reinforcement. Elander New York: No Title; 1960.
- Moehle Jack P. M. I. American Concrete Institute ACI Committee %J American Concrete Institute ACI Committee: Farmington Hills USA. Building code requirements for structural concrete ACI 318-19 and commentary 318R–19, Concrete International. 2019; 41(8): 21–21.
- Broms CEACISJ. Elimination of flat plate punching failure mode. ACI Structural Journal. 2000;97(1):94–101 .
- Rahman AH. Effect of steel corrosion on the strength of slab-column connections. National Research Council Canada, Institute for Research in Construction; 1992.
- Shen L, Shen Y, Liang S. Reliability analysis of RC slab-column joints under punching shear load using a machine learning-based surrogate model. Buildings. 2022;12(10):1750. doi: 10.3390/buildings12101750
- Chen CC, Chen SLAS. Strengthening of reinforced concrete slab-column connections with carbon fiber reinforced polymer laminates. Appl Sci. 2019;10(1):265. doi: 10.3390/app10010265
- Di Stasio J. Transfer of bending moment between flat plate floor and column. J Proceed. 1960;57(9):299–314. doi:10.14359/8022
- Chetchotisak P, Chetchotsak S, Yindeesuk D. Punching shear strengths of RC slab-column connections: prediction and reliability. KSCE J Civ Eng. 2018;22(8):3066–3076. doi:10.1007/s12205-017-0456-6
- Nguyen HD, Truong GT, Shin MJES. Development of extreme gradient boosting model for prediction of punching shear resistance of r/c interior slabs. Eng Struct. 2021;235:112067. doi: 10.1016/j.engstruct.2021.112067
- Manar AA, Mansour TM. Modelling of shear strength for reinforced concrete beams provided with side-face reinforcement in dependence of crack inclination angle. Int J Eng Adv Technol. 2019;8(6):3941–3950. doi: 10.35940/ijeat.F9059.088619
- Naderpour H, Mirrashid M. An innovative approach for compressive strength estimation of mortars having calcium inosilicate minerals. J Build Eng. 2018;19(March):205–215. doi: 10.1016/j.jobe.2018.05.012
- Elshafey AA, Rizk E, Marzouk H, et al. Prediction of punching shear strength of two-way slabs. Eng Struct. 2011;33(5):1742–1753. doi: 10.1016/j.engstruct.2011.02.013
- Tran VL, Thai DK, Kim SE. Application of ANN in predicting ACC of SCFST column. Compos Struct. 2019;228(April):111332. doi: 10.1016/j.compstruct.2019.111332
- Erdem H. Prediction of the moment capacity of reinforced concrete slabs in fire using artificial neural networks. Adv Eng Softw. 2010;41(2):270–276. doi: 10.1016/j.advengsoft.2009.07.006
- Mangalathu S, Jang H, Hwang SH, et al. Data-driven machine-learning-based seismic failure mode identification of reinforced concrete shear walls. Eng Struct. 2020;208(January):110331. doi: 10.1016/j.engstruct.2020.110331
- Mangalathu S, Jeon JS. Machine learning–based failure mode recognition of circular reinforced concrete bridge columns: comparative study. J Struct Eng. 2019;145(10). doi: 10.1061/(asce)st.1943-541x.0002402
- Tran VL, Kim SE. A practical ANN model for predicting the PSS of two-way reinforced concrete slabs. Eng Comput. 2021;37(3):2303–2327. doi: 10.1007/s00366-020-00944-w
- Akbarpour H, Akbarpour M. Prediction of punching shear strength of two-way slabs using artificial neural network and adaptive neuro-fuzzy inference system. Neural Comput Appl. 2017;28(11):3273–3284. doi: 10.1007/s00521-016-2239-2
- Farghaly T, Ueda AS. Punching strength of two-way slabs strengthened externally with FRP sheets. JCI Proceed, Japan Concr Institute. 2009;31(2):493–498.
- Chen CC, Chen SL. Strengthening of reinforced concrete slab-column connections with carbon fiber reinforced polymer laminates. Appl Sci. 2020;10(1):265. doi: 10.3390/app10010265
- Silva MAL, Gamage JCPH, Fawzia S. Performance of slab-column connections of flat slabs strengthened with carbon fiber reinforced polymers. Case Stud Constr Mater. 2019;11:e00275. doi:10.1016/j.cscm.2019.e00275
- Sharaf MH, Soudki KA, Van Dusen M. CFRP strengthening for punching shear of interior slab–column connections. J Compos Constr. 2006;10(5):410–418. doi: 10.1061/(asce)1090-0268(2006)10:5(410)
- Esfahani MR, Kianoush MR, Moradi ES. Punching shear strength of interior slab–column connections strengthened with carbon fiber reinforced polymer sheets. Eng Struct. 2009;31(7):1535–1542. doi: 10.1016/j.engstruct.2009.02.021
- Harajli MH, Soudki KA. Shear strengthening of interior slab–column connections using carbon fiber-reinforced polymer sheets. J Compos Constr. 2003;7(2):145–153. doi: 10.1061/(ASCE)1090-0268(2003)7:2(145)
- Soudki K, El-Sayed AK, Vanzwol T. Strengthening of concrete slab-column connections using CFRP strips. J King Saud Univ - Engg Sci. 2012;24(1):25–33. doi: 10.1016/j.jksues.2011.07.001
- Golafshani EM, Ashour A. A feasibility study of BBP for predicting shear capacity of FRP reinforced concrete beams without stirrups. Adv Eng Softw. 2016;97:29–39. doi: 10.1016/j.advengsoft.2016.02.007
- Al-Subhi A. Parameters estimation of photovoltaic cells using simple and efficient mathematical models. Sol Energy. 2020;209(September):245–257. doi: 10.1016/j.solener.2020.08.079
- Mowrer RD, Vanderbilt MD. Shear strength of lightweight aggregate reinforced concrete flat plates. J Proceed. 1967;64(11):722–729. doi:10.14359/7601
- Elstner RC, Hognestad E. Shearing strength of reinforced concrete slabs. J Proceed. 1956;53(7):29–58. doi:10.14359/11501
- Canada I. Strengthening reinforced concrete structures with externally-bonded fibre reinforced polymers [computer file]. : ISIS Canada; 2001.
- Lee HS, Noguchi T, Tomosawa F. FEM analysis for structural performance of deteriorated RC structures due to rebar corrosion. In Proceedings of the second international conference on concrete under severe conditions; Norway: Tromsø; 1998. p. 327–336.
- Committee ACI. ACI 318-19: building code requirements for structural concrete and commentary. Am Concr Inst Farmingt Hills, MI, USA. 2019; 124:105827 .
- Adebar P, Mutrie JG, DeVall R, et al. Seismic design of concrete buildings: the 2015 Canadian building code. NCEE 2014 - 10th US Natl Conf Earthq Eng Front Earthq Eng. 2014. doi: 10.4231/D39W09032
- Standards B. Structural use of concrete: part 1: code of practice for design and construction. British Standards Institution; 2007.
- Standard I. Ah price code eurocode 2: design of concrete structures -part 1-1: general rules and rules for buildings no copying without NSAI permission except as permitted by copyright law. Natl Stand Autority. 2005. [Online]. www.saiglobal.com/shop