
ABSTRACT
Low-density Zeolite Aggregate (LDZA) is obtained by thermally treated zeolite in a furnace under 500°C. Thus, the water evaporates, and zeolite aggregates (ZA) are obtained with porous structures in which water molecules that make LDZA have endogenous processing properties. In this research, experimental behavior using ZA is used as a replacement portion of fine and Coarse-grained aggregate to obtain Low-density concrete (LDC) beams. The performance of normal reinforced concrete beams was contrasted with that of LDC beams based on their load-deflection behavior, ultimate load capacity, deformation profile, and crack pattern Under the effect of static load. In addition, apertures of different diameters (25, 38,50,60) mm were made in the tensile region along the aperture length of beams to minimize the self-weight of the beams. As a result of the use of zeolite aggregates, there was a decrease in the weight and density of the concrete used in casting the beams, and the results for the Normal Concrete (NC) beam were close to the results from the beam LDC. However, using Apertures in LDC beams in the tensile zone gradually reduced ultimate loads and mid-span deflection. Therefore, it is recommended to use zeolite aggregates to make LDC for use in reinforced concrete elements.
Introduction
The towering cityscape, a testimony to human achievement, frequently hides a hidden concern: the enormous weight of the materials that support it. Traditional concrete, while unquestionably robust, has an enormous density. This burden results in heavy foundations, difficult structural support, and negative environmental consequences [Citation1]. However, a transition is taking place, fueled by a lighter, more sustainable alternative – LDC. This adaptable material provides a convincing answer to the problems associated with traditional concrete [Citation2]. It’s not just about losing weight; it’s about creating smarter, greener and for the future. The potential of LDC to meet three main challenges is at its heart [Citation3]. Environmental Implications Traditional concrete is primarily reliant on quarried stone aggregates, which depletes natural resources and leaves a large carbon footprint [Citation4]. LDC substitutes lighter components, such as recycled materials, for heavyweight concrete, lowering environmental impact and increasing sustainability [Citation5]. Structural Effectiveness This material’s reduced weight results in smaller footings, easier structural support, and enhanced design freedom. This means lower costs and more freedom for architects and engineers. Using palm kernel shells as an ideal substitute for crushed granite aggregate in concrete is one application for this material. U.Johnson et al. [Citation6] Enhancements to Performance Don’t be deceived by its little size. LDC provides superior thermal and sound insulation, allowing buildings to be cooler, quieter, and more energy-efficient. It is also fire resistant, offering another layer of protection to your structure [Citation7].
Cristina et al. [Citation8] concluded that pre-stressed LDC has a lower bearing capacity due to its potential for corrosion and cracking. Therefore, building pre-stressed concrete bridges out of Low-density pre-stressed concrete is not advised. AL Nasser et al. [Citation9] observed that reinforced concrete beams constructed from naturally occurring Low-density scoria aggregates can be structurally sound; however, they may exhibit higher deflections and curvatures. This is because lighter beams have a more minor moment of inertia, causing them to be more susceptible to bending.
Yang et al. [Citation10] concluded that pre-tensioned LDC beams have a lower flexural capacity than pre-tensioned standard concrete beams. This is because of Low-density concrete’s reduced tensile strength. Tejaswini et al. [Citation11] discovered that M30-grade concrete beams with under-reinforcement were the safest and had the most extended warning before failure. Rumsys et al. [Citation12] discovered a way to create LDC with excellent mechanical qualities from waste plastic. Because it has similar mechanical characteristics to plastic waste aggregate and improves cement hydration, pre-wetted expanded clay can be used in place of it.
Despite it is not a benefit of Low-density concrete, which reduces strength compared to standard concrete, its application also results in decreased density. As a result, LDC finds widespread use in structures that demand lower stress levels, such as buildings with short spans between beams that do not require high-stress slabs or beams. Previous studies have delved into applying these materials in creating Low-density concrete. This study focuses on possibly incorporating zeolite aggregates as a partial replacement for standard aggregates in producing Low-density concrete.
Material properties
Cement
For this experiment, Portland cement CEMI/B-P42.5N [Citation13] was used. Appropriate tests were performed by Egyptian standards ES 4756/1–2022 and European specifications EN 197/1–2011 to determine the specific gravity and consistency of the cement.
Aggregates
Coarse-grained aggregate and fine aggregate
Coarse-grained aggregate (CGA): is a term used to describe irregular and granular materials such as sand, gravel, or crushed stone. It is important to wash these materials before use. The angularity and strength of CGA can affect the quality of the resulting concrete, according to the Egyptian standard code as shown in . These materials’ specific gravity, crushing strength, and impact strength can be determined through testing a standard first published in 1987 and revised multiple times since then, with the most recent revision released in 2020. Fine-grained aggregate (FGA): is made up of comprises smaller particles that pass through a 4.75 mm sieve, as defined by the Egyptian code. shows the physical properties of the FA used in this study. The maximum size for the CA used in this investigation was 10 mm.
Table 1. Characteristics of coarse and fine-grained aggregates.
Zeolite aggregate
Zeolite Aggregate is low density, highly porous, and resistant to chemicals. It is used in concrete to enhance its durability, strength, and fire resistance. Additionally, it has the added benefit of improving the thermal insulation of the concrete.
Chemical admixtures
Sikament-163
Sikament-163 is an effective water-reducing agent and superplasticizer that can significantly improve the workability of concrete, especially in warm weather. Its dual action helps to speed up the hardening process and reduce early and long-term stress. Sikament-163 can be used with any Portland cement to produce high-quality concrete.
Silica fume
Silica fume is a type of fine powder made of amorphous silicon dioxide (SiO2) in a spherical shape. The size of the silica fume particles is usually less than 1 micrometer in diameter, which is about 100 times smaller than an average cement particle. Due to this, silica fume has a high surface area, making it a highly reactive material, as shown in .
Table 2. Physical properties of silica fume.
Concrete mix preparation
Zeolite Aggregate (Coarse and Fine) was obtained by thermally treated zeolite in a furnace rate to 500°C about 2 hours. The water absorption of LDZA was high, so the mix was adjusted accordingly. Silica fume was used to addition to cement and was improved strength and durability partially. The concrete mix proportions are shown in .
Table 3. Details of the concrete mix.
shows the mechanical properties of NC and LDC, which were: density(ρ), Compressive strength of cubes (Fcu), Specified compressive cylinder strength of concrete (f’), Elastic modulus (Ec), Strain of concrete(εo), Uniaxial cracking stress(fctr), Uniaxial crushing stress (fcur) and Stiffness (S). It was noted that LDC achieved a density 23% less than NC density, yet the loss in compressive strength did not exceed 3%. As shown in compare between LDC and NC stress& strain curve.
Figure 1. Stress strain curve of LDC and NC.
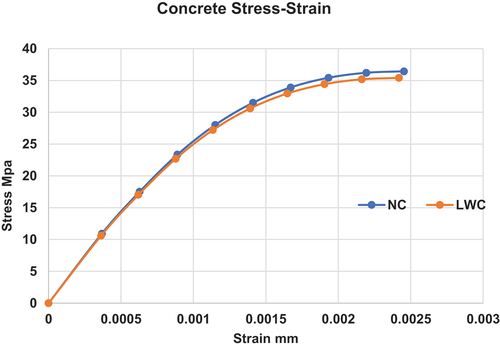
Table 4. Mechanical properties of LDC and NC.
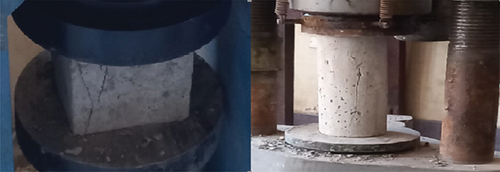
Twelve concrete cubes and twelve concrete cylinders were tested for compressive strength by Egyptian Standard Specifications. Since the dimensions of cubes (150 × 150 * 150) mm and the cylinder has dimensions equal to 150 × 300 mm. It was noted that LDC has a density of 1.857 gm/cm3, while normal concrete has a density of 2.417 gm/cm3 That was, it decreased by 23.17%. The compressive strength of LDC was 44.27 MPa and that of normal concrete was 45.55 MPa after twenty-eight days of curing as shown in .
Table 5. Dimensions and compressive strength of cubes and cylinders (LDC).
Experimental program
Specimen characteristics
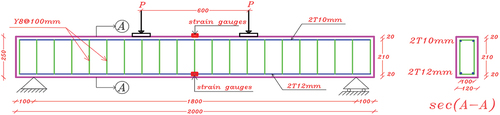
The flexure behavior of reinforced NC and LDC beams with and without apertures, was investigates. Six beams were evaluated and classified into two groups. The first group included two control beams with no apertures, one NC and the other LDC. The second group comprised four LDC beams with tensile apertures of varying diameters (25, 38, 50, and 60 mm) along the length of the beam in the tension zone. Furthermore, the proportions of the beams remain constant at 120 mm in width, 250 mm in height, and 2000 mm in length. Every specimen was uniformly constructed, with 2Ф12 lower reinforcement on the tension side, 2Ф10 upper reinforcement on the compression zone, and two sections with 8 mm stirrups spaced at 100 mm intervals, as shown in and .
Figure 2. Apertures in the beams and reinforcement.
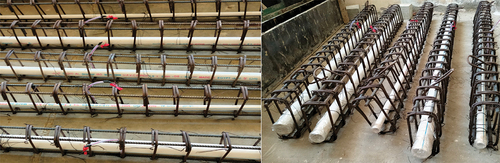
Figure 3. Detailing of RC-beams (LDC) with apertures.
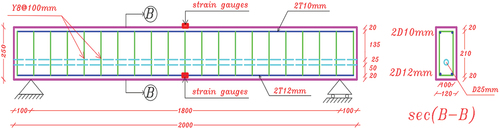
Table 6. Specifications of specimens.
Casting of beams
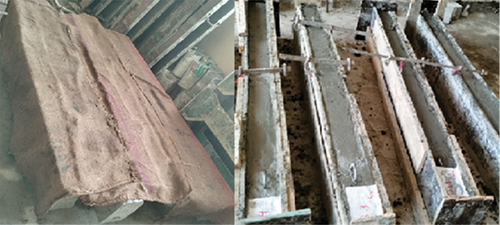
The wooden formwork was used to cast the concrete, as shown in . To ensure a tight fit, bolts were used to connect the sides and bottom of the formwork. Cement masonry cover blocks, 25 millimeters thick, were placed on the sides and bottom of the beams to keep them clear. The dry mix materials were combined in the concrete mixer for approximately 4–5 minutes. The wet mix was created by adding the additive and water to the dry mixture. To prevent cavities and honeycombing, the wet material was compacted and smoothed using a needle vibrator. The formwork was removed after 24 hours of casting. Gunny bags were used to cure the concrete, reducing hydration and evaporation loss.
Figure 4. Typical testing specimens of beams.
Concrete treatment
During the mixing and curing of concrete, zeolite aggregate absorbs water, allowing the concrete to cure from the inside out in the early stages. Internal curing avoids early shrinkage fractures by supplying a constant supply of water from within the concrete. It also aids in reducing chemical attacks on concrete by limiting the creation of early cracks, which boosts the durability of the concrete and lowers pore formation. depicts the hardened concrete inside the surface. Internal curing also reduces permeability and boosts concrete strength.
Figure 5. Zeolite aggregate concrete cube and cylinder after compression testing.
Loading setup
The beams were evaluated with a static load utilizing a four-point loading arrangement after 28 days of curing, as illustrated in . To make it simpler to see the patterns of the cracks before testing, all the beams were bleached. The beam had a clear span of 1800 mm from the supports and was supported 100 mm from the beam ends. Two steel rods were placed at one-third of the beam’s length to distribute the loads uniformly, and a horizontal beam was placed over the steel rods. A load cell with a capacity of 200 KN was placed on top of the horizontal beam, and a hydraulic jack was used to apply the load until the beam failed slowly. Throughout the test, the stress on the beam was held constant and raised by 1 KN per minute until the beam failed. Strain gauges were positioned around the center of the beam, on the bottom side of the reinforcing bars, and on the top surface of the concrete to measure the strain in the reinforcing bars and the concrete. Three LVDTs with a precision of 0.01 mm (deflection) were used: one fixed directly (600 mm from the support), another fixed (900 mm from the support) (mid-span of the beam), and the third fixed directly (1200 mm from the support) to monitor the deflection at each loading stage. The gauges on the steel reinforcing bars were sanded smooth to facilitate attaching the strain gauges more easily. The strain gauges’ resistance was measured using a multimeter and found to be 120 ohms. A data logger was used to measure the strain.
Figure 6. Setting up the experiment, concrete dimensions, and detailing of beams.
Experimental result and discussions
General
was shown the load values in the first crack and the values of deflection. It was clear that the values in first crack were very close and the load values were limited to (19–26) kn. It also shown the maximum load values for all the beams. It was clear from these values that the NC beam achieved the highest value in load and deflection. By comparing it with specimens of (B1–1, B2–1, B2–2, B2–3 and B2–4) it was found that the percentage of loss in load values is (14–20) %. As for the deflection values, the loss rates were limited to (2.5–14.7) % of the deflection values that occurred in a NC beam. As shown in values of ultimate load and deflection for all specimens.
Figure 7. Compare between ultimate load capacity for specimens.
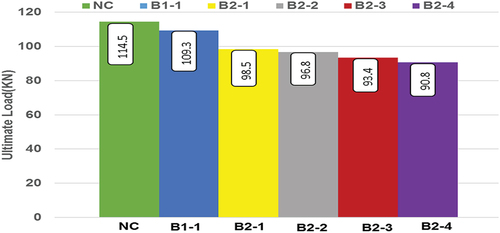
Figure 8. Comparison of mid-deflection between the specimens.
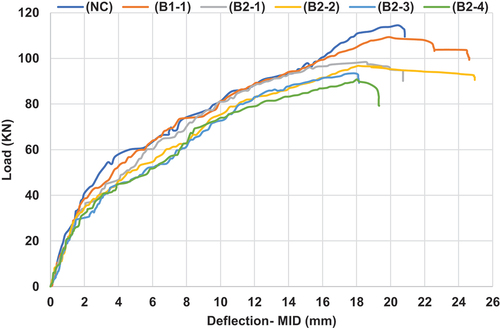
Table 7. Experimental results.
had shown the weights of the beams, where NC beam achieved a weight of 145.01 kg and the beam with LDC achieved a weight of 111.41 kg, meaning that the weight was reduced by 23.17%. As a result, there was a loss in load by 4.5%. As for the beams that had openings with diameters from (25–60) mm, it was Its weight is limited to (109.63–100.94) kg, meaning that the weight is reduced by about (24–30) % than that of a beam with NC, but the load as a result of this weight loss was only reduced by 20.7%.
Structural observation
The beam developed more cracks with each 5 KN increase in load. Ultimately, the concrete in the compression zone was crushed, and the steel reinforcement yielded, causing the beam to fail. Both NC and LDC showed nearly identical crack and failure patterns. Although the cracks in LDC beams developed more quickly and had wider cracks than anticipated, both beams had about the same load capacity. The experimental beam crack pattern was shown in .
Figure 9. Crack pattern of the normal concrete beam (NC - EXP).
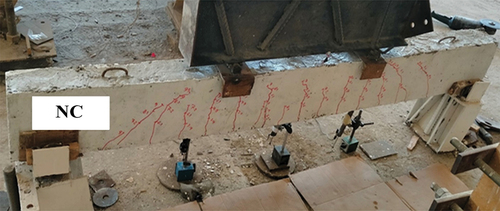
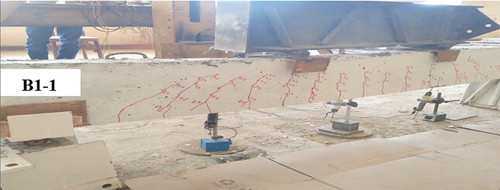
Figure 10. Crack pattern of LDC Beam (B1–1 – EXP).
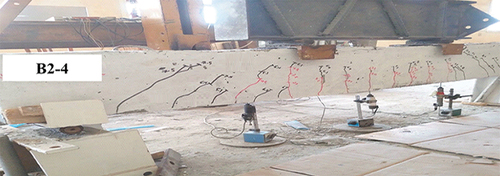
The failure of the LDC beams (B2–1, B2–2, B2–3 and B2–4), which have various apertures, occurred due to flexure at the middle of the beam span. The experiment revealed that cracks developed more quickly when the diameter of the aperture was bigger inside the beam. The cracks started and spread gradually, eventually causing the beam to fail, as shown in , and .
Figure 11. Crack pattern of LDC Beam (B2–1 – EXP).
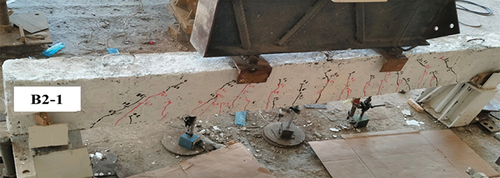
Figure 12. Crack pattern of LDC Beam (B2–2 – EXP).

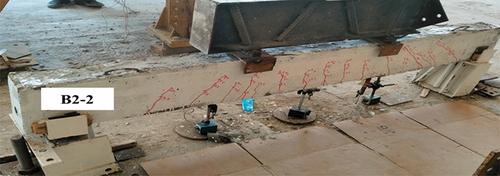
Figure 13. Crack pattern of LDC Beam (B2–3 – EXP).
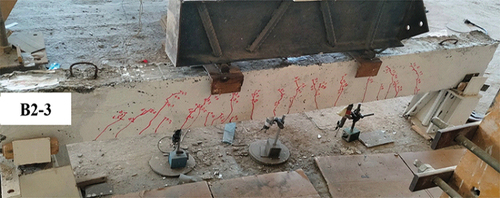
Figure 14. Crack pattern of LDC Beam (B2–4 – EXP).
Comparison of Group1 (NC, LDC) beams and group 2
Failure modes
The results depicted in indicate that the cracking and failure patterns of the NC and LDC beams are similar, but the load-carrying capacity of the LDC beam is lower than that of the NC beam. The yielding strength of the zeolite aggregate (ZA) used in LDC concrete is slightly lower than that of normal aggregate, which leads to earlier concrete crushing and subsequent failure of the LDC. Both NC and LDC exhibit comparable tensile strain, and their failure is attributed to concrete crushing. As the load on a LDC beams gradually increase, the cracks on the bottom side of the beam (tension zone) propagate toward the top side (compression face). The study reveals that increasing the diameter of the aperture in the tension zone results in a slight decrease in the maximum load the beam can carry (ultimate load) and its deflection, as presented in . Compared to beams without openings, failure load is achieved faster, and a gradual crack width increase is observed in , and .
as shown calculate of ductility and stiffness for all specimens and calculates ductility (Du) of all specimens, determine a and b: Equation: Du= (b/a)
Figure 15. Calculate of ductility all specimens - determine (a, b).
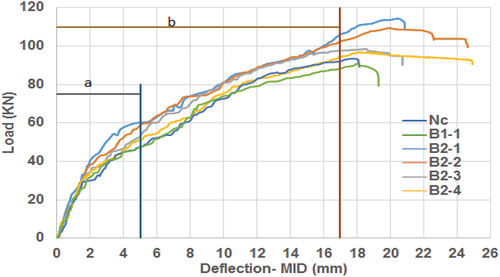
Table 8. Calculate of ductility and stiffness for all specimens.
Notes:
IR = moment of inertia for rectangular = bh3/12.
IA= moment of inertia for aperture = (π* d4)/4.
IE= moment of inertia effective = IR- IA.
Strain behavior
Strain of bars
Strain gauges on steel reinforcing bars measured pressure due to tension, as shown in and . Consequently, the low density of the LDC and the apertures introduced in the tension zone led to the steel in that zone yielding at a lower load than in a NC beam. This can be attributed to the difference in strain, which amounted to 0.015 in the LDC beams, corresponding to only 75% of the strain value observed in NC beam. As a result, the reinforcing steel in LDC beam experienced an actual load of 90 kn, whereas it required 110 kn in NC beam to attain the same strain level.
Figure 16. Compare between strain reinforcement for specimens.
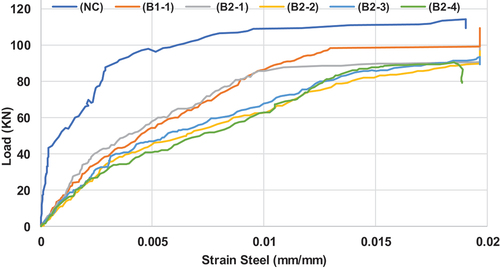
Table 9. Values of tensile steel and strain concrete.
Strain of concrete
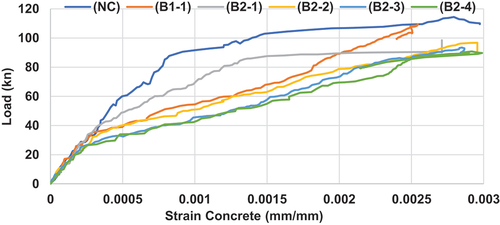
Strain gauges on the concrete surface measured compressive strain, as shown in and . It was noted that the beams in which LDC was used and without openings reached the maximum values of strain than the beams in which NC was used. When openings were made in the beams with LDC with increasing diameters from (25–60) mm, it was observed that they reached the maximum values of strain faster than in Both cases.
Figure 17. Compare between strain concrete for specimens.
Conclusion
Normal and Low-density beams’ load carrying, and deflection is almost similar.
It was noted that the load values that resulted in the first crack in the B1-1 were 4% less than the load resulting in NC. But when apertures were made with different diameters, from (25-60) mm, the first cracks appeared faster and under the influence of a load that was less by (7.70-26.9) % than a load of NC beam and a load less by (4-24) % than a load of LDC beam Without openings.
The comparison between the reinforced beam using LDC and the reinforced beam using standard concrete clearly showed that the Low-density beam achieved the ultimate load slightly earlier than the standard reinforced beam, with a difference of approximately 4.5% when subjected to a static load.
LDC has a lower load-carrying capacity than normal concrete because it has a lower Young’s modulus, and zeolite aggregate has a lower crushing strength than normal aggregate. Using zeolite aggregate instead of normal aggregate reduces the weight of the concrete by about 23.15%.
When comparing the load-bearing capacity of a control beam constructed with standard concrete to beams made of LDC under static load, the load gradually decreases as the Aperture diameter increases by around 4.5% to 20.7%. Furthermore, the deflection in the center of the beam reduces by approximately 2.5% to 14.7%.
The maximum load capacity of each beam decreased with an increase in the diameter of the aperture used (specifically, with apertures diameters 25, 38, 50, and 60 mm). Additionally, when subjected to a static load, each beam failed earlier than the others.
The stiffness values of NC did not significantly change from B2-1, but after making the apertures, a slight loss occurred, ranging from 1.61 to 7.84%. The Ductility values, there was a very small change from NC beam to LDC beam, it did not exceed 5%. However, after making apertures, there was a noticeable loss of 9.2 to 16.7%.
It was noted that the behavior of combining LDC and making openings in the tensile zone led to the production of concrete elements that were less in weight by a rate ranging from 25% to 30% than the normal concrete elements, and as a result, it led to a significant saving of cost.
Through the experimental investigation of this research, LDC with coarse and fine zeolite was applied to reduce the weight of the structure and reduce the dead load, with satisfactory results. This was clear in the comparison between the NC beam and B1–1, in that B1–1 achieved a weight reduction of 30.39% over the NC beam and at the same time achieved a load close to the same load as the NC beam.
Disclosure statement
No potential conflict of interest was reported by the author(s).
References
- Topçu İB. Semi low density concretes produced by volcanic slags. Cem Concr Res. 1997 Jan;27(1):15–21. doi: 10.1016/S0008-8846(96)00190-1
- Al-Khaiat H, Haque MN. Effect of initial curing on early strength and physical properties of a low density concrete. Cem Concr Res. 1998 Jun;28(6):859–866. doi: 10.1016/S0008-8846(98)00051-9
- Uysal H, Demirboga R, Şahin R, et al. The effects of different cement dosages, slumps, and pumice aggregate ratios on the thermal conductivity and density of concrete. Cem Concr Res - CEM CONCR RES. 2004 May;34(5):845–848. doi: 10.1016/j.cemconres.2003.09.018
- Al-Jabri KS, Hago AW, Al-Nuaimi AS, et al. Concrete blocks for thermal insulation in hot climate. Cem Concr Res. 2005 Aug;35(8):1472–1479. doi: 10.1016/j.cemconres.2004.08.018
- Alengaram UJ, Jumaat Z, Mahmud H. Ductility behaviour of reinforced palm kernel shell concrete beams. Eur J Sci Res. 2008 Nov;23:406–420.
- Alengaram UJ, Mahmud H, Jumaat Z, et al. Effect of aggregate size and proportion on strength properties of palm kernel shell concrete. Int J Phys Sci. 2010 Oct;5:1848–1856.
- Libre NA, Shekarchi M, Mahoutian M, et al. Mechanical properties of hybrid fiber reinforced low density aggregate concrete made with natural pumice. Constr Build Mater - CONSTR BUILD MATER. 2011 May;25(5):2458–2464. doi: 10.1016/j.conbuildmat.2010.11.058
- Vázquez-Herrero C, Lage I, Vázquez-Vázquez H, et al. Comparative study of the flexural behavior of low density and normal weight prestressed concrete beams. Eng Struct. 2013 Nov;56:1868–1879. doi: 10.1016/j.engstruct.2013.08.008
- Alnasser S, Shannag MJ, Charif A. Structural behavior of reinforced concrete beams made with Natural Low density aggregates. 2014 Jan.
- Yang K-H, Lee J-S, Mun J-H. Flexural tests on pre-tensioned low density concrete beams. Proc ICE - Struct Build. 2014 Apr;167(4):203–216. doi: 10.1680/stbu.12.00003
- Tejaswini T, “Analysis of RCC beams using ABAQUS,” 2015. e:https://www.semanticscholar.org/paper/Analysis-of-RCC-Beams-using-ABAQUS-Tejaswini/7f29f479d0461eb0b541227987cb364ae9e07c3e
- Rumšys D, Bačinskas D, Spudulis E, et al. Comparison of material properties of low density concrete with recycled polyethylene and expanded clay aggregates. Procedia Eng. 2017 Jan;172:937–944. doi: 10.1016/j.proeng.2017.02.105
- “Suez, Helwan, Tourah,” Suez cement. https://www.heidelbergmaterials.eg/en/suez-opc