
ABSTRACT
Urban design evolves with socio-technical advancements. Digital ones had an important role in this evolution. One such digital technique that directly impacts urban effectiveness is augmented reality that based on integrating virtual elements into real environment and interacting with them in ways simulating reality. The effects of AR reflect in urban design on multiple levels, and the purpose of this paper is to define and determine these levels through measurable indicators in AR experiments. The research concludes to identify four indicators of AR impact on improving urban design: (1) Enhancing community participations in the design decision-making process. (2) Assisting designers in improving their design decisions. (3) Simultaneously, AR can serve as a task of designers and an output of design effectiveness when it focuses on enhancing the city’s image. (4) Lastly, AR can serve as a fundamental input of design effectiveness when user experience is utilized to enhance urban sensing activities, collecting data. A general theoretical framework has been developed, consisting of key and secondary measurable vocabulary in terms of achievement, non-achievement and degree of achievement, through assigning one of five possible numerical values for each vocabulary and measuring them in four case studies, which involved four AR experiments published in previous studies. All indicators achieved good proportions, although the proportions varied among them and from one experiment to another due to the difference in time, place and objectives of each one. The community participation achieved the highest level of achievement, while the urban sensing achieved the lowest one.
Introduction
Urban design plans and organizes urban environment to meet the residents’ needs, depending on available expertise and knowledge. Its concept emerged in ancient civilizations in Greek and Roman classical cities, and continued in subsequent civilizations, employing specific techniques to showcase the urban landscape and highlight its spatial identity. It has undergone many developments due to direct and indirect influences of socio-technical changes. The significant developments were in 20th century because of the numerous new emerging technologies that greatly impacted the theoretical concepts of urban design. A series of conferences were held, shifting the trend toward designing cities in harmony with people and in line with technological advancements. In 1974, the concept of sustainable urban development emerged, and with the onset of the digital revolution in 1991, urban design began to crystallize through computational advancements, allowing for the possibility of visualizing cities before their production, emerging the first attempts to involve residents in the urban design process [Citation1].
Many urban ideas that were introduced in 20th century become easily achievable thanks to the advanced digital techniques, emerging in 21st century. One of these rapidly evolving and widely spread techniques in various fields, including urban design, is the ‘Augmented Reality’. AR term appeared in 2001, and the possibility of using it to enhance the features of historic cities became evident. The first system to revive the memory of place using AR was accomplished by utilizing Greek civilization landmarks in the first application of time travel to the past and its civilizations [Citation2]. Also, the Department of Architecture at the National University of Singapore initiated the first experiment of AR by collecting historical images and integrating them into the geographical site, enabling users to see the city urban scene in previous periods [Citation3]. AR technique did not stop at those early applications but became one of the latest and most influential techniques in enhancing urban design efficiency, as it allows designers and planners to incorporate virtual elements in two or three dimensions and visualize them in the actual reality using methods that enhance users’ experience and contribute to their understanding of different urban spaces [Citation4]. Thanks to these capabilities, it became possible to increase the communication and interaction between the community and its urban environment, especially since the process is carried out through widely accessible tools such as smartphones and tablets.
A preliminary review of the subject literature indicates that developing urban design using AR can lead to improving design effectiveness on several levels. The research aims to contribute in supporting the claim of the positive impact of this emerging technique on the urban design effectiveness and emphasizing the importance of augmented experiments, encouraging their adoption and development as an innovative means of design in achieving urban sustainability.
Materials and method
Through reviewing a large number of studies, the knowledge gap was identified, representing by the statement that there is no comprehensive theoretical framework that identifies all indicators of the relationship between AR and urban design. Often, each study focuses on providing a specific indicator based on its own orientations. Therefore, this paper represents an attempt to deduce the most important indicators related to this relationship and formulate them within a theoretical framework that encompasses as many of measurable vocabulary as possible. To achieve this, the research methodology relies on the following steps:
Reviewing several studies, each representing a model for a significant number of studies concerned with one or more specific indicators. And synthesizing the most important indicators of this relationship from them. (Four indicators were identified for this relationship.)
Constructing a theoretical framework specific to each indicator, identifying key and secondary vocabulary that are measurable in terms of achievement, non-achievement or the degree of achievement in augmented experiments. (Details were explained in the measurement section)
Identifying and measuring these indicators in various AR experiments. (Four diverse experiments have been selected). This was done through describing each experiment briefly, including its procedures and contents, and concluding with an assessment of its potential in achieving those indicators, were measured by a special table.
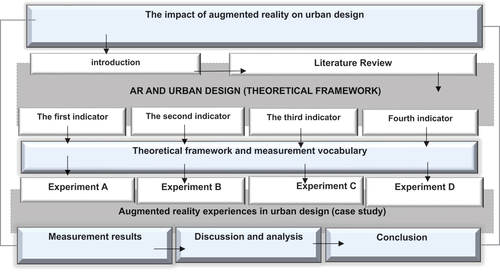
Then, the measurements’ results were discussed and analyzed, concluding the extent to which each of these indicators is achieved in each of these experiments as in .
Figure 1. Research structure and methodology.
Literature review
Many studies emphasized several concepts and ideas that represent the indicators of AR impact on urban design. One study by Daniel Broschart [Citation5] discussed a concept of involving residents in decision-making process, without considering their abilities to understand design process because AR provides an opportunity to visualize projects in high-clarity three-dimensional views, enabling ordinary individuals to comprehend and assess the project’s suitability for their requirements. Another study by Nan Bai [Citation6] examined the role of AR in facilitating public participation in urban design, whether in terms of development or in terms of preservation, starting from data collection and extending to implementation of designs. This participation is crucial in assisting decision-makers in meeting the residents’ needs, achieving a collaborative design serving both parties. Also, a study by Yuchen Wang [Citation7] highlighted the significant challenge of the public’s limited ability to understand the indicators relied on urban design, and the potential of AR to overcome this challenge by presenting these indicators interactively through three-dimensional models that can change shape based on changing the values of those indicators. This enables the public to contribute their opinions and express their aspirations, facilitating a bottom-up approach to urban decision-making alongside traditional top-down approaches. The study by Mottram Penn [Citation8] focused on AR as an important tool in design decision-making through assisting designers in achieving a comprehensive understanding of the design, as well as visually and spatially evaluating the project in various aspects, such as describing blocks and spaces, studying building density, analyzing movement paths and more. The study by José Miguel [Citation9] emphasizes the importance of exploring urban environments in the development activities, highlighting digital techniques such as GIS and 3D CAD as new mobile tools for this exploratory process by enabling experts to explore data and correct design errors with high precision and efficiency, especially when presented using AR techniques that provide designers with interactive design models. Additionally, a study by Naji Pezhman [Citation10] emphasized the role of AR and VR techniques in addressing issues of contemporary cities and i developing urban areas, by enabling designers to achieve urban sustainability and reduce costs of urbanism, all by assuming user interaction with the simulated artificial environment of the urban environment. The study also highlighted the role of spatial modeling that assist in replacing and evaluating designs in line with predicting the urban future of the city.
The study by Diana Szekely [Citation11] addressed the digitization of cultural heritage as the identity and protected memory of a city’s inhabitants. Although the various methods used in preserving and restoring the cultural landmarks, promoting them in historical cities, the study introduced the potential of AR as new concepts to enhance the city’s urban image. It developed an application that incorporates virtual elements of heritage buildings and integrates them with the real world, enabling virtual tourism of the city. Also, a study by D. Salgado [Citation12] presented the idea of combining AR with GPS to create a new and sustainable tourism experience, that allows users to access the cultural history of an area at each point of interest. It also emphasized the integration of the application with global web services to provide a wealth of information related to the region’s heritage. While, the study by Benjamin Allbach [Citation13] discussed the importance of reducing barriers for users to contribute in AR content rather than merely accessing it and viewed the contribution of individuals capable of using AR techniques on their mobile devices as an indefinite number of individual measurement stations that can provide exceptionally accurate data for urban sensing. Based on the above, research can extract and classify four key indicators of the relationship between AR and urban design, which will be explained in the next paragraphs.
AR and Urban design (Theoretical framework)
In this sense, AR applies to the digital symbolic and graphical applications that can provide users with enhanced interaction with their urban environment by integrating the virtual elements of development proposals with the realistic elements of the urban environment at the actual time and place, which contributes to improve the urban design effectiveness in these four indicators: (The key and secondary vocabulary for will be summarized and displayed in measurement table.)
Enhancing community participation in design decision-making
Community participation in the urban activities has become easier with the use of AR means, enabling individuals to have a visual perception of the project, understand it and evaluate the building or buildings in [Citation14]. The AR technique offers several advantages supporting this participation, notably enabling individuals to clearly see the proposed project before implementation. It also makes architectural output more understandable to the recipient due to the provision of interactive 3D presentations, representing an interactive loop between real design and virtual design created by computer. It allows the public to explore and perceive a planned building in a realistic environment under different conditions, enabling their understanding without the need for technical knowledge of designs [Citation15,Citation16]. The virtual designs in AR experiments can range from 3D to 2D models, as well as the information about the project. The models can vary between being in true scale and actual site or in a different scale and site.
Another advantage is enabling individuals to express opinions and participate in decision-making easily by survey platforms integrated into AR applications. The continuous urban development requires building cities aligning with the residents’ requirements, and achieving this task is challenging using traditional methods, which is why AR experiments have been employed to gather population opinions through personal interviews and questionnaires within the augmented experiment that allow to clearly view the project before implementation [Citation17]. Furthermore, AR empowers the public to participate at any time without the need to be in a specific location. This is achieved through what is known as participation scenarios, proposed by some studies, allowing users to initiate discussions and submit proposals through certain AR applications that facilitate two-way communication between developers and users [Citation13,Citation18].
In addition, AR enables the individuals to evaluate designs and choose the best among them. Sometimes, they can modify design features. The design process is difficult, therefore involving the public in decision-making and gathering their opinions be very beneficial in facilitating the replaceability of designs and selecting of best alternative, aligns with their needs. It also contributes to avoid or minimize potential errors in designs and enhances their continuous modifications, especially when engaging the public from the project’s inception to implementation [Citation14,Citation17]. Platforms designed by developers have helped in presenting urban design projects for residents easily, allowing them to evaluate the design and present the results to implementers. This can reduce the chances of project failures and help resolve conflicts with the public. AR has also overcome the challenge of the public’s inability to comprehend urban design indicators by presenting those indicators interactively to them into 3D virtual models linked to those indicators. Users can perceive and understand urban changes and evaluate them by interactively changing the indicator values [Citation7]. Based on previous work, AR plays a significant role in achieving community participation by allowing individuals to visualize proposed projects clearly before implementation, facilitating their participation in opinion-sharing, and allowing them to participate in the design process through evaluation, selection and modifying design.
Enhancing design decision accuracy and assisting designers
AR increases communication between various parties in the design process and decision-makers, also, between different parties in the design and construction process, allowing everyone to review designs and evaluate their potential impacts. Furthermore, it helps save time and effort in updating designs and testing different ideas before implementation. Urban design is a highly complex process, and AR has positive impacts on assisting designers in their decisions through applications that enable them to see the existing activities in the urban area and access all information about each one (e.g. whether shopping activities are available in the area, are restaurants open or closed at a certain time, etc.) [Citation10]. The process of visual perception of place is a fundamental factor in the urban development, and AR techniques have provided designers with the ability to study the perceptual range of urban spaces and the aesthetics of the city in a clearer way, with a greater understanding of the relationship between elements, present in the urban environment [Citation19]. AR features have helped create real scenes for the proposed design and enabled designers to interact tangibly with the urban scene resulting from the overlay of virtual objects with real environment. This has positively influenced the visual evaluation process of the city in terms of urban spaces, dealing with building heights and skyline, studying urban scale and studying visual balance, while enhancing the possibility of modifying design in a more straightforward manner by tangible interaction with the application and modifying signs specific to virtual models, which is a simple process, does not require prior training by designers [Citation20].
The capability of AR in hybridizing actual reality with virtual design has provided designers with the opportunity to create urban solutions that can be interactively controlled through virtual environments, enabling designers to reshape the urban context with minimal effort and time [Citation21]. AR allows designers to have control over the design before implementation and provides a direct visual perception of the urban reality of the city. It assists in spatially assessing the area to be designed, including measuring the built and population density, determining access mechanisms, controlling the orientation of buildings and blocks, and identifying key landmarks of the city, enabling more accurate and clear decisions [Citation22]. Thus, AR plays a crucial role in enhancing communication, and the exchange of ideas among all parties. It provides a realistic interaction with designs, facilitating the digital evaluation in terms of visual and spatial aspects. Moreover, it enhances the flexibility of modifying and replacing designs more easily and quickly.
Enhancing city image and improving user experience
The city image is not limited to its current appearance but extends to its cultural and historical character, as well as future visions for its development. In this context, AR becomes an effective tool of enhancing this image and bringing about positive changes in our understanding and interaction with the city by highlighting its beauty and unique urban features. From this perspective, AR can be considered a complementary efficacy to urban design, contributing to enabling designers and decision-makers to present future projects interactively, allowing the public to experience the future city before it comes real. AR can also revive the past that no longer actually exists and contribute to showing the cultural history. Despite various methods used to preserve and revive heritage, AR technique has introduced a completely new and different concept by integrating the digital into physical aspects, in order to achieve the desired visual attraction [Citation11]. It helps digitize the urban heritage by enhancing its sites through alternative methods to traditional maps, such as spatial tracking techniques and time-travel exploration of place. Also, it can complete missing parts of the image by virtually reconstructing the elements of the old scene, creating a spatially and visually realized heritage environment that closely resembles reality [Citation23]. The lost urban environments are explored by storing data and using virtual 3D graphics that are seamlessly integrated with the real environment, furthermore, collecting historical data using AR techniques provides an opportunity to virtually depict the city according to its historical timeline. Possible environments of the city in different eras can be compiled into virtual representations and transformed into a tangible reality that complements the current city scene with historical or unseen future content, contributing to providing information about the city’s areas and their changes over time [Citation11,Citation24]. The concept of a timeline is linked to the notion of ‘conversation locations’ scenarios, which involve capturing the unseen historical content within the current city environment and incorporating it as digital information, such as maps and old city photographs, in dedicated application archives. This allows tourists and locals alike to experience the history and cultural heritage of the city. Moreover, the information and events uploaded by users can serve as a source of reference for urban designers [Citation13]. AR experiments have the potential to enrich and continuously update this information by connecting the application to other emerging techniques, such as the semantic web, which is in turn linked to the World Wide Web [Citation25]. The main goal of enhancing the city’s image is tourism and attracting visitors, through AR experiments specifically designed for heritage sites. These experiments involve the digital storytelling of the historical panorama of city and achieving visual attraction by completing the missing parts, thus enhancing understanding and appreciation of its urban heritage [Citation26]. Also, AR can be used to highlight important cultural events such as traditional festivals and art exhibitions, providing interactive and engaging experiments for the public to directly interact with and explore these elements [Citation27].
Enhancing urban sensing mission and collecting data
In addition to the data provided in surveys, AR can effectively enable designers to gather information about urban environment by relying on participating users in AR experiments, employing them as live and mobile sources of data, collecting diverse information. In this sense, AR can be considered a main input of urban design effectiveness inputs. Urban life relies on movement within urban environments, between blocks and spaces, along with defining landmarks, therefore the process of tracking movement and within the city is very complex. AR techniques have been used in digitally tracking data through the concept of urban navigation, which helps perceive urban elements from all directions based on the provided markers on the main paths of the real world, represented by digital elements, that facilitate data collection, in terms of population and urbanization. Digital tracking and navigation occur in two directions: the first involves placing virtual elements within real environment, perceiving development projects, while the second involves moving virtual elements, or users, in the urban environment to collect data through urban sensing of the population’s movement and direction in targeted areas [Citation28]. AR can be used to remotely collect data about the area and its inhabitants through sensors integrated into mobile devices, within the concept of sensing urban areas and analyzing them in what is known as ‘mixed reality’, providing a future vision of the city from the user’s perspective. These capabilities give designers the opportunity to collect information from residents in a way saves effort and time, speeds up the process and reduces errors for a specific project [Citation29]. AR has provided the possibility of navigating urban environments, meaning simulating the future virtual city through mobile phones, using the AR interface represented by a prepared integrated model that provides data about the realistic urban environment through virtual objects. Consequently, the process of collecting real data about the current problems of the urban environment, along with future vision and predicting its variables related to population and urban uses, has become easier and clearer [Citation30]. The idea of urban navigation lies in using data recorded by individuals to create a wide understanding of the urban environment improve city planning by analyzing this data and using it to understand both challenges and opportunities.
Case studies
Four experiments in sequence (A, B, C, D), different in time, place, objectives and purposes of each one, were adopted as case studies to measure the theoretical framework. The first stage is a descriptive measurement including a brief description for each experiment examining the extent of achievement or potential achievement for each of the four indicators’ vocabulary.
Experiment A
The experiment, published by Daniel Broschart [Citation5], is conducted early on, compared with the current AR advancements. CPE research team worked on it during 2012, presenting the project ‘Stadt Mitt am Fluss’ in Saarbrucken, Germany. The area suffered from urban expansion on both sides of the Saar River, carries the city’s identity. The proposal included creating new projects aimed to reducing traffic pollution and harmful emissions. The central idea was to dig an underground tunnel for the highway, provide the resulting surfaces for using as a park, integrate the opposite side into the city’s urban pattern, creating a new urban scene aligning with modernity while preserving historical buildings such as the Castle Church. AR was used to present the proposal to the local authorities and residents, attract their participation in decision.
Technically, the experiment relied on three applications: LayAR 2009, for services using GPS; LayAR Vision 2012, a version utilizing markers; and AR Media, along with its sub-techniques for 3D modeling, and displaying the virtual visualizations of models on mobile screens with different system. Practically, it focused on developing what is called ‘smart walk’ which involved virtual tours through nine stations without a predefined path (). At each station, a different augmented experience. At a specific station, user could see an empty space and provided with a video clip, at other, he could obtain an overview and summary of the entire development area, enhanced with basic textual information. In a third one, a 3D model of the proposed pedestrian bridge was integrated. In the fourth or fifth, users could witness a 3D model that includes simulations of noise pollution and floods. The experiment not only presented futuristic visions of project but also included comparisons between it and both the current state of the area and its history, by utilizing narrative storytelling techniques enhanced with images. each station was provided with systems for sharing opinions and questionnaires on specific topics. AR was also used to allow residents to view the project from their homes.
Figure 2. (left to right) the nine stations in the (smart walk), 3D virtual images accompanied the virtual tour, the virtual 3D model of the pedestrian bridge integrating into real landscape.
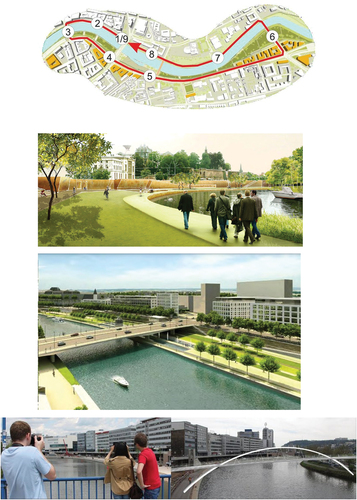
At the level of community participation, the experiment focused on enhancing the understanding of the project by residents, providing a virtual visualization before implementation in 3D models, enriched with additional information. However, due to the large-scale and multiple components, the visualization lacked sufficient details and did not be at true-scale on actual site, except for some components such as the pedestrian bridge. The experiment provided high capabilities for participation in decision-making, including the ability to comment and participate in questionnaires and personal interviews. This contributed to enhancing the diversity of design opinions and the feasibility of replacement, but it did not include the idea of choosing between alternatives or modifying design, despite its potential. In terms of enhancing design decision accuracy, the experiment provided designers with an ability to follow designs in the real world, rather than just virtual, assisting in digitally evaluating the project’s spatial and visual aspects to a great extent (). It enhanced interaction among different parties and allowed to replace designs according to public opinions, but it did not provide interactive modification during use.
Figure 3. AR abilities to assist designers in digitally visual and spatial evaluations.
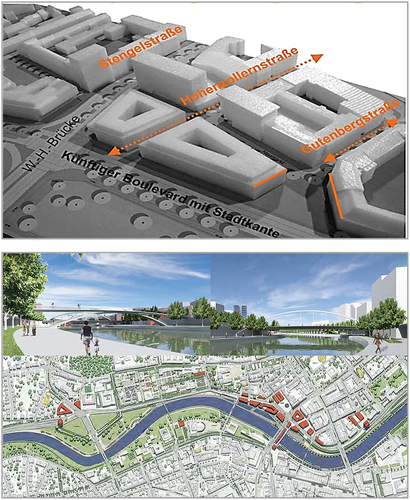
Regarding enhancing the city’s image, the experiment presented a comprehensive futuristic vision, declaring its media goal to attract attention and stimulate economic activity. There were no activities to digitize the heritage and recreate it virtually, except for historical information and archival images presented with models, creating an acceptable combination between the historical and futuristic scenes, referred in some questionnaire sections. The experiment largely focused on the concept of virtual tourism and the ability to travel through time and space. It was enhanced with the necessary digital guidance and succeeded to some extent in enhancing the exploration of the missing environment. At the level of urban sensing, the experiment provided significant potential for enhancing future virtual simulations. However, due to its objectives, it was limited to collecting data from residents and predicting their preferences. Also, it enhanced urban navigation in both directions: fixing virtual elements in reality and moving virtual elements into clear paths marked by signs. However, it did not utilize the sensors in users’ mobile device.
Experiment B
Honolulu District Project in Hawaii, USA. Published by Yuchen Wang [Citation7]. The experiment presented a virtual project was designed to achieve its goals. AR platform was developed with three main objectives: the ease of use for public, particularly in modifying design indicators values, the accuracy in placing model in the actual site, integrating with real conditions such as lighting, and the ability for designers to easily replace the model in subsequent tests (). It was conducted over several days, by providing a virtual model of a single urban block with small separate parts that allow visibility of urban landmarks without obstruction, choosing an empty space as the model’s location, and soliciting participation from passersby randomly.
Figure 4. Using the alignment cube for placing the model on site, controlling the six indicator values through the user interface.
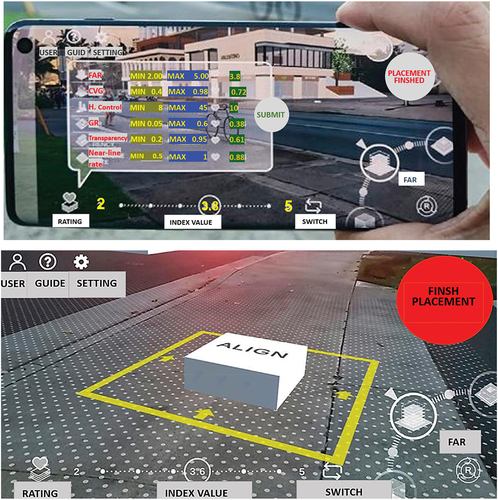
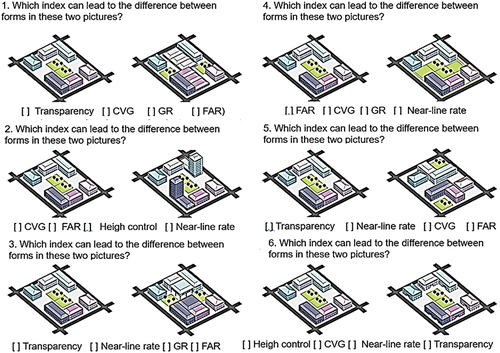
Technically, the experiment was created by Unity 2021, with several techniques to enrich it and facilitate its use on various operating systems. It allows users to control six key urban indicators and change the model, through sliders, between minimum and maximum values, also it possible to changing these values. These indicators were as follows: Floor Area Ratio (FAR), represents building density; (CVR), the percentage of site covered by buildings; Height Control, responsible for the skyline; Greening Rate (GR), the proportion of green spaces to total urban space; Transparency, the ratio of open spaces on the ground floor to the total street facade area; and the Near-line Rate, the setback distance of the ground floor from the street line. Participants were allowed to view model from multiple perspectives since controlling the different indicators was not possible from a single location. At the end, each participant presented his acceptable model. The presented models included different values for each indicator (), were presented to specialized committees to study and analysis their implications on the urban form. There was a preliminary questionnaire, presenting two different images of the same model in each question, asking about the responsible indicator for that difference (). It was conducted twice, before and after the experiment, the correct responses significantly increase in the second round. Another questionnaire was administered, consisting of several questions revolving around the experiment and its role in understanding urban design indicators, the responses were in favor of it and its goals in promoting public participation in urban design.
Figure 5. Three different values for each indicator from two different perspectives, A and B.
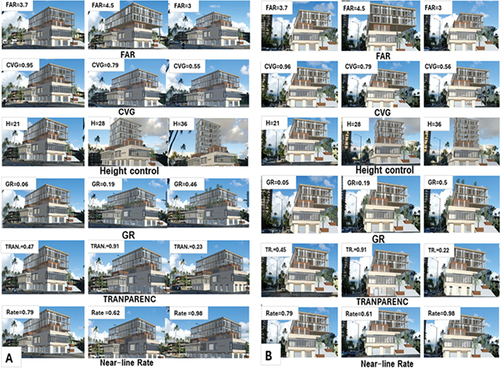
Figure 6. A preliminary questionnaire platform content.
At the first indicator, the experiment succeeded in enhancing understanding, not only to the project but also to the urban indicators and how their values are reflected in the form. Unlike Experiment A, the compact project size and advanced techniques allowed to displaying the model in true-scale and actual location, with sufficient detail. It allowed users to submit their preferred indicator values, enabling to collect opinions and extract the accepted average value for each indicator. Users were also able to provide written comments, as well as access textual and audio explanations about the project and how to control indicators. The experiment allowed designers to change and replace the model each time by importing 3D models created by Revit, SketchUp or 3ds Max, and using them at the same scale in Unity software, automatically reconnecting the interaction. With the parametric modeling, designers had the ability to interactively and modify designs, giving them a wide capability for the digital evaluation in the actual site. In short, it employed advanced modeling and presentation techniques, achieving the first and second indicators. Regarding enhancing the city’s image, the experiment did not aim for that as it was based on a virtual project. However, it had the potential to achieve all the aspects of that indicator. It can be said that it enhanced the urban scene in the area by adding a virtual future image, completing the existing urban scene. The same applies to urban sensing and data collection, as it had the capability to achieve many aspects of the indicator, but it was limited to virtual simulation of the future and collecting data from, and about, the participants.
Experiment C
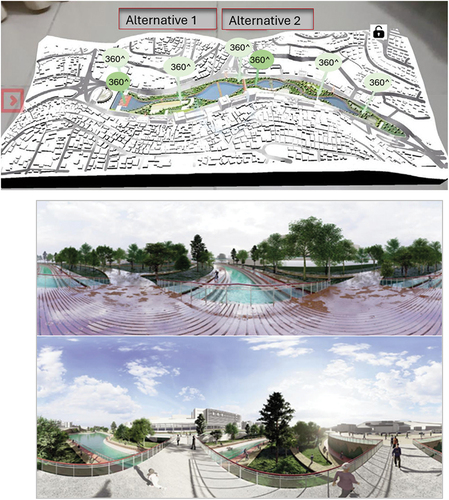
The experiment, published by Janset Shawash [Citation31], reviewed two proposed scenarios for development of the Siel River in Ras Al Ain, Amman, Jordan, which represents the city’s natural heritage that suffers from floodings and unsustainable urban expansion (). The first was the Rainwater Basin project in Ras Al Ain (2030), a short-term realistic vision, constructing underground water tanks of reinforced concrete to contain rainwater and avoid flood risks. The second was the ambitious long-term Amman Siel Park project (2050), aiming to completely and sustainably revive the area and transform it into a large park. The ‘Seil of Amman MAR’ application, developed in 2017, consists of three main sections: (1) The introductory section, called the Audio-Visual book, presents the historical context and the critical issues requiring development, as well as reviews all possible scenarios (). (2) The 3D models section showcases the scenarios, allowing users to create a virtual 3D model of the entire project when their mobile devices detect a horizontal surface, and providing interactive buttons to display specific images of key areas in 360-degree views (). (3) The survey and feedback section includes a internet questionnaire link to gather opinions and comments from users in four topics: personal information, satisfaction with proposals, acceptance of application and ease of use.
Figure 7. The first proposed scenario (2D model), the second proposed scenario (2D model).
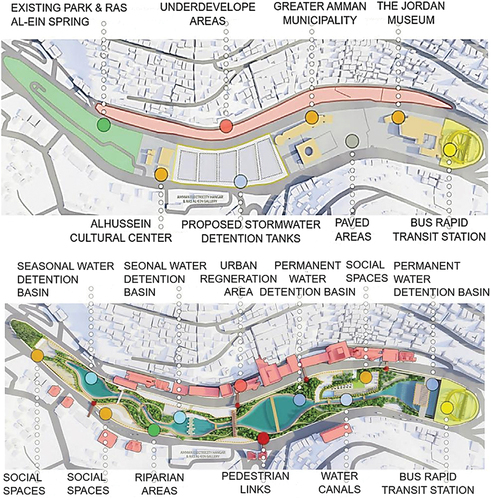
Figure 8. Displaying images accompanied by texts in the Audio-Visual History book of the seil.
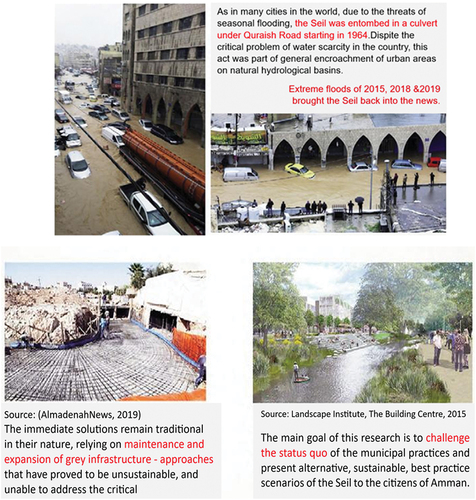
Figure 9. 3D model of the second scenario providing interactive buttons to display a 360-degree view for specific areas, 360-degree presentations of some key parts in second scenario.
From the technical side, the application was developed using Unity 3D along with various technologies that facilitate its use on different mobile devices. The 3D models were created using Autodesk Revit and then exported to Unity, with material compression to reduce the processing load on users’ devices. The application was announced by social media for a week. Forty participants were involved in the experiment and were interviewed afterward. Some elderly individuals participated, that was important due to their awareness of the area’s history. The key survey results were a 75% of the participants preference for the second proposal, some suggested the possibility of combining both proposals, and most of them interacted with the ease of use.
Considering the importance of natural heritage, community participation was very important. The experiment succeeded in significantly enhancing this participation and facilitating the understanding of the projects, but it was designed to view the models anywhere, in addition to the actual site. The models were not to scale and lacked sufficient detail, except for the 360-degree presentations. It enhanced the proposals with textual explanations, and allowed users to contribute to the decision-making by questionnaires and personal interviews, despite not providing dialogue platforms. It facilitated the ability to replace designs, providing the flexibility to choose between alternatives, but it did not provide the ability to modify designs. AR allowed designers to have the appropriate visual evaluation in terms of visual balance, urban scale and studying elevations, especially since the area is located in a low valley. Also, it assisted planners in spatially evaluating residential densities, in addition to providing the experiment with the potential to create communication among different parties. The development area is one of the natural heritage sites, which has partially disappeared due to flooding. AR was used to explore this lost environment by providing the application with historical data of the area and presenting it as a tourist guide through panoramic storytelling of the heritage. However, the experiment did not provide 3D modeling of the heritage elements and only relied on textual information and images. Despite the availability of urban navigation and urban sensing capabilities, the experiment only collected data from the participants, without utilizing those capabilities.
Experiment D
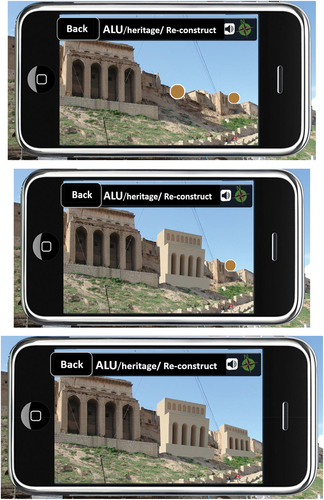
The experiment, published by Rozhen [Citation32], differs from previous ones as it represents a development project in itself, enhancing the urban landscape of Erbil Citadel by utilizing AR techniques to revitalize its historical image. Erbil Citadel is a historic castle with thousands of years and a prominent landmark in Erbil, Iraq. Despite its cultural and heritage significance, the existing urban fabric does not reflect its true age. Most of its history cannot be revived by traditional methods as it remains buried beneath the layers of the current fabric. To address this, the AR application ‘ARBELA Layers Uncovered’ (ALU) was developed to explore the memory of Erbil, revitalize the Citadel and present it in an innovative way to site visitors. ALU serves as a nucleus for a larger project can be adopted by government authorities. Its interface includes three main modes: (1) Historical Mode: That focuses on textual and audio data, video footage and historical images (panels) related to the city’s history, organized in a timeline, reflecting the civilizations that governed the Citadel, providing buttons that offer information about a specific stage or significant event (). All is presented in many languages, can choose from. (2) Heritage Mode: which provides information about traditional architecture in the remaining buildings. It offers three display options: 2D view, 3D views and reconstruction view. In 2D view, the visitor’s location is determined using the ‘My Location’ feature. When he enters the Citadel, a set of pins appear on the Citadel’s map. By tapping on one of them, the user can access information about this point and the buildings it contains. In 3D view, users activate the camera and direct it toward the surrounding scenes, which will display colored circles on the buildings. When a circle is tapped, information about the specific building is provided (). The third and important option is the reconstruction view, which operates similarly to the 3D view, but the circles appear in locations where parts of the scene are missing, not on existing buildings. When tapping on these circles, the scene is completed using archival photos or 3D models that simulate the missing parts (). (3) Database Mode: it allows user to access all information about the Citadel by connecting to various websites, and guides him to a dedicated webpage, the user can document his experience and share it as images and texts on that page.
Figure 10. The main interface shows three buttons for three modes, the history mode shows abilities of selecting according to timeline, displaying a panoramic painting of an important battle.
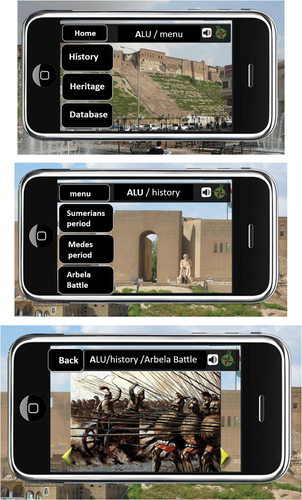
Figure 11. Heritage mode interface, activating 2D view of it, activating 3D view of it.
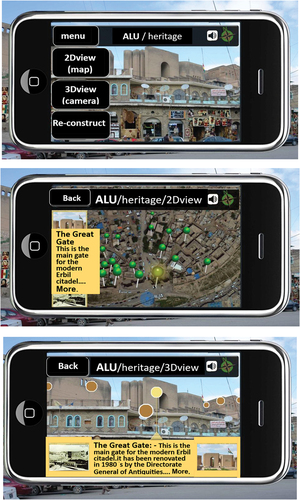
Figure 12. Reconstruction view, the abilities of activating one or more 3D models at the same time.
The experiment did not present a project and gather opinions about. It was a development project itself. Therefore, it did not aim for community participation beyond enhancing awareness of the area’s history. The focus was on presenting models as historical documents, not as future debatable visions to acceptance or rejection. Due to this approach, the experiment focused on enhancing the city’s image and improving the user experience. It clearly succeeded in achieving the vocabulary of this indicator through enhancing the urban landscape and presenting the historical virtual image that no longer exists in reality. It completed the urban scene by adding elements or completing the missing parts through the reconstruction feature. It also enriched the image with additional information. The application successfully enhanced the user experience by providing virtual exploration of the place and time-travel. It enhanced the tourist experience by providing necessary digital guidance, exploring missing environments and providing an acceptable timeline through historical contents. It also allowed users to browse festivals and cultural events, including displaying images of historical battles. Additionally, it was linked to the World Wide Web, allowing users to add content. The experiment had the potential to achieve many aspects of urban sensing, but it did not aim to achieve any of them, including surveys.
Measurement of indicators
After explaining it descriptively in the case studies, vocabulary of the theoretical framework will be measured in numerical values, representing the percentage of each item’s achievement in each experiment. This will be done according to a specific table prepared for this purpose. Each item will assign a value of five values, as following: 0%: Indicates that the vocabulary item is not achieved and cannot be achieved. For example, all experiments lack the ability to modify design item (except for B). 25%: The item can be achieved, but the experiment did not address it. For example, experiment D did not achieve personal interviews, but it had the potential to do. 50%: Indicates partial or indirect achievement of item. For example, experiment B did not provide platform for discussion but limited it to allowing the user to submit a modified form according to values they deemed appropriate. While, experiment C did not provide a full-scale model visualization, but achieved it by a 360-degree presentation. 75%: Indicates significant and clear achievement of item. For example, Experiment A did not provide a complete view of the project on the actual site, but it provided it for key parts such as the pedestrian bridge, in addition to the virtual images provided to the users at certain stations.100%: Indicates complete achievement of the item. For example, all experiments viewed the project in 2D and 3D models before implementation. Also, some items will be assigned a value of ‘x’ in certain experiments, indicating a logical reason preventing the adoption of it in that experiment. Therefore, it will not be included in the value calculation. For example, experiment D did not consider participant feedback on the model because, as mentioned, it presented the models as historical documents that cannot be modified according to preference. Similarly, experiment B reviewed a non-executable virtual project, so it is not possible to consider the execution teams.
As shown in , the results extracted by summing the values vertically within the columns represent the average achievement rate of each indicator in the individual experiment. While the results extracted by summing the values horizontally within the rows represent the degree or average achievement rate of the individual indicator in the four experiments. The table includes calculating the achievement rate of each indicator separately in the four experiments in general. It also includes the achievement rate of the four indicators in each individual experiment. The final value representing the achievement degree of the four indicators in the four experiments.
Table 1. Table of measurement.
Results and dissections
The important results can be discussed as follows:
The average of the four indicators’ achievement rate in all experiments was 69%, which is a good percentage considering the diverse and specific interests of the experiments. Typically, one indicator is achieved at a high rate, while the others are at lower rates, in each experiment.
The ‘Enhancing Community Participation’ was the most achieved indicator in the four experiments, with 83%, following by the ‘Enhancing City Image’ at 72%, then the ‘Enhancing Decision Accuracy’ at 70%, finally the ‘Urban Sensing’ at 53%. This aligns with expectations based on the focus of the AR experiments, almost, on increasing community participation in decision-making and considering it as a primary goal in improving urban design. However, the Urban Sensing seems to be less, because sensing activities require technical resources, with specialized expertise that often exceed the abilities of those limited use applications, it can be achieved by widely used applications. Thus, the sensing activities in the four experiments were limited to data collection from users, promoting idea of urban navigation within the project area.
Experiment B got the highest percentage in achieving the four indicators, reaching 74%, following by D with 73%, then A with 69%, finally C with 62%. Experiment B adopted a small virtual project designed to achieve its goals using advanced techniques in parametric project modeling and integrated the model within the real environment. This increased the user interaction with the application and enhanced realism in project visualization. The application of Experiment D was an urban development project in itself, which gave it a unique character that logically contributed to its high value due to neglect of many items, provided (x) value. While, the large projects in Experiments A and C posed challenges for augmented techniques in several aspects, mainly, the capacity to store all components due to the large data. To reduce and compress digital data to a manageable size that can be processed by user devices, both experiments focused on selected parts of the project with fewer details, as mentioned earlier.
The highest achievement percentage for an indicator in an experiment was the achievement rate of ‘community participation’ in Experiment B with 92%. Following by the achievement rate of ‘enhancing the city’s image’ in Experiment D with 88%. Then, the achievement rate of ‘assisting designers’ in Experiment A was 78%. The Experiment B focused on the ease of app use and provided an interactive method that gave users complete freedom to modifying designs, thus increasing interaction. As for Experiment D, it represented a special type of augmented experiments, serving as an urban development project in itself due to the logical constraint of not being able to implement a real project in the physical world. Thus, the city’s image and improving the user experience took the forefront of its priorities. Additionally, a real urban development project of Experiment A gave more importance to the accuracy of design decisions and assisting designers.
Conclusion
AR techniques significantly contribute to improving urban design effectiveness on multiple levels by effectively enhancing various supporting activities. Their direct impact lies in promoting and increasing community participation in the design decision-making process by enhancing understandability, facilitating opinion expression and providing opportunities for alternatives choice. Therefore, we can concern the augmented experiments as initiatives to encourage interactive communication between the community and urban activities. These capabilities, in turn, enhance the accuracy of design decisions and assist designers in digitally evaluating and testing different ideas, modifying them interactively to align with participants’ aspiration.
AR techniques can be a compliment effectiveness to urban development effectiveness, through contributing for enhancing the city’s image with future or historical content. And there is a specific type of augmented experiments that represents an urban development project in itself, becoming a task for urban designers and an outcome of design effectiveness, especially in many of development projects aiming to highlight the historical identity of cities or their future aspirations. Finally, AR techniques can be a fundamental input among the inputs of design process when utilizing user experience to enhance urban sensing activities and collect data.
The impact of AR on urban activities is directly proportional to the availability of necessary technologies, expertise, and specialized resources to implement applications. Additionally, mobile augmented applications rely on or consider the capabilities of available user devices. Therefore, the influence and success of augmented reality experiments is inversely proportional to the size and quality of the projects being addressed.
Disclosure statement
No potential conflict of interest was reported by the author(s).
References
- Mainak G, Sanjib N. Urban design - introduction, history, characteristics, parameters. In: From The Encycl Of Des. 1st ed. Bloomsbury; 2019. p. 69.
- Peddie J. Augmented reality where we will all live. 1st ed. SpringerScience. 2017. p. 24–25.
- Constantine S. Universal access in human-computer interaction: application and services. In: 4th International Conference; Copenhagen, Denmark; 2020 July. p. 20–23.
- Silva D, Barbosa. Augmented reality in urban design: a systematic literature review. J Urban Technol. 2020;27(4):110–112.
- Peter Z DB, Bernd S. Augmented reality as a communication tool in urban design processes. In: 18th International Conference on Urban Development, Regional Planning and Information Society; Rome, Italy; 2013 May. p. 119–126.
- Bai N, Ye W, Li J, et al. Customized collaborative Urban design-A collective user-based Urban information system through gaming. Conference: eCAADe36. Berlin, Germany; 2018 Sep.
- Yuchen W, Yin-Shan L. Public participation in urban design with augmented reality technology based on indicator evaluation. J Frontiersin Virtual Reality. 2023;4(16):1–18. doi: 10.3389/frvir.2023.1071355
- Penn A, Mottram C, Fatah A, et al. Augmented reality meetings: a multi-user narrative interface for architectural design. Bartlett Postgrad Sch J. 2005;5:5. doi: 10.1007/1-4020-2409-6_14
- José M, Jochen W, Agustín T, et al. Multimodal location. Based Services-Semantic. 3D city data as virtual and.Augmented reality. In: Proceedings of the thirteenth Conference on Advances in Location-Based Services; Austria, Vienna; 2016 oct. p. 231.
- Naji P. Introduction of augmented reality instances utilizing matter-information hybrid via technology in urban spaces. Int J Archit And Urban Devel. 2021;11(4):49.
- Diana S, Silvio F, Oana R, et al. Evaluating usability with eye tracking: a case study of mobile augmented reality with historical images of urban cultural heritage. Heritage J 2023;6(3):3256–3270. doi: 10.3390/heritage6030172
- Salgado D, Benitez D, Morales A, et al. Use of augmented reality technology and GPS to encourage tourism in the Sucre department. In: 4th IOP Conference Series: Materials Science and Engineering; Cartagena, Colombia; 2020 Nov. p. 5.
- Benjamin A, Martin M, Peter Z, et al. Mobile augmented city: new methods for Urban analysis and urban design processes by using-Mobile. Augmented reality services. In: 16th International Conference on Urban Development, Regional Planning and Information Society; Rome, Italy; 2011 May. p. 635–636.
- Kolivand H, Sunar S, Ji R, et al. Realistic real-time outdoor rendering in augmented reality. Plos One. 2014;9(9):9. doi: 10.1371/journal.pone.0108334
- Evangelos K. Comparison between augmented reality techniques in virtual-pilot [ Diploma thesis]. Thessaloniki Greece; 2020. p. 1–70.
- Johannes H, Stefan L, Yao-Yi, et al. Map archive mining: visual-analytical approaches to explore large historical map collections. ISPRS Int J Geo-Inf 2018; 7(4):1–19. doi: 10.3390/ijgi7040148
- Ursina C, Tumasch R, Peter K, et al. An augmented reality study of public participation in urban planning. J Locat-Based Serv. 2023;17(1):2–9. doi: 10.1080/17489725.2022.2086309
- Allen M, Regenbrecht H, Abbott M, et al. Smartphone augmented reality for public engagement in urban planning. In: Journal of Proceedings of the 23rd Australian Conference on Human-Computer, Australian; 2011 Nov. p. 1–20.
- Francesc V, Pilar G, A ER, et al. F “raw data to useful information: a representational approach to cadastral databases in urban planning. Future Internet J 2014; 6(4): 613–639. doi: 10.3390/fi6040612
- Albert S, Ernest R, David F, et al. Augmented reality application development. Within the framework of the architecture degree. In: 9th International Conference on User Experience in E-Learning and Augmented Technologies in Education; Japan; 2012 Nov. p. 37–42.
- David F, Ernest R, Albert S, et al. N urban education. Augmented reality and mobile learning technologies. Ibero-Am J Distance Educ. 2017;20(2):141–165.
- Adkins, Kirsten K. A aesthetics, authenticity, and the spectacle of reality: how to educate the visual world in which we live. Int J Art Des Ed. 2014;33(3):328–334.2014. doi: 10.1111/jade.12062
- Stefan H, Bernd S. Engaging Mobile publics – how mobile devices provide new avenues for civic engagement. In: Real Corp 2011 16th International Conference: Change for Stability: Life Cycles of Cities and Regions; Essen, Germany; 2011 May. p. 269–273.
- Malysheva SG. Use of augmented reality information and communication technologies in urban historical environment. In: IOP Conference Series: Materials Science and engineering; Russian; 2019 Nov. p. 5.
- Georgios L, Euclid K, Konstantinos D, et al. Semantically enriched augmented reality applications: a proposed system architecture and a case study. Int J Recent Contrib Eng Sci IT. 2022;10(10):29–46.2022. doi: 10.3991/ijes.v10i01.27463
- Anne C, John K. Mobile augmented reality for cultural heritage: technology admission study. In: IEEE International Symposium on Mixed and Augmented Reality 2012; Atlanta (GA); 2012 Nov. p. 249.
- Nawaz M. State-of-the-art virtual and augmented reality technology. 1st ed. London, (UK) London: Intech Open, Entcopene; 2018. p. 24.
- Narooie M. Promoting public participation in urban planning using web GIS technology: a case study of Stockholm County. Master’s thesis project certificate in urban and regional planning. Publisher kth royal institute of technology; 2014. p. 24.
- Manfred S, PopovichPeter Zeile VV, Memmel M, et al. Mobile augmented city–new methods for urban analysis and urban design processes by using Mobile augmented reality services. In: Real Corp 2011 16th International Conference: Change for Stability: Life Cycles of Cities and Regions; Essen, Germany; 2021 May. p. 433–441.
- Fotis L, Vesna B, Stelios P, et al. Exploring. Urban environments using virtual and augmented reality. J Virtual Reality And Broadcast. 2006;3(5):11.
- Janset S, Narmeen M. Visions for a greener future at sail Oman. Augmented reality as a tool for urban design. Int J Archit art and Des. 2020;10(8):220–229.
- Rozhen K. Augmented reality: anarrative Layer for historic sites. In: Prepared in partial fulfilment of the requirements of the degree in the faculty of environmental design. The University of Calgary; 2010. p. 1–200.