
 ?Mathematical formulae have been encoded as MathML and are displayed in this HTML version using MathJax in order to improve their display. Uncheck the box to turn MathJax off. This feature requires Javascript. Click on a formula to zoom.
ABSTRACT
The energy challenge and environmental degradation are currently two of the biggest obstacles to sustainable global growth. Due to emerging countries’ rapid industrialization and population increase, people have been migrating from rural to urban areas. One of the primary causes of environmental deterioration in Egypt is the country’s hundreds of tons of municipal solid waste generated every day, as well as the country’s struggles with waste management and energy production. Waste-to-energy (WTE) programs show promise as a remedy. However, given the inherent complexity and unpredictability of these endeavors, a careful examination of risk allocation methods is important, especially in the context of public-private partnerships. The present paper intends to identify important risk considerations, evaluate their allocation methodologies, and distribute insights for stakeholders and policymakers involved in WTE projects in Egypt through an extensive assessment of the literature and case studies subsequently in practice. In order to reduce the risks associated with Waste-to-Energy (WTE) projects in Egypt, the current paper considers eight categories: land accessibility, availability, and site risks; social risks; environmental and human health concerns; design risks; construction risks; operation risks; financial market risks; and collaboration risks.
Introduction
Egypt faces significant waste management and energy challenges due to its growing population, urbanization, and industrialization, causing environmental degradation, health hazards, and energy shortages. Understanding these issues is crucial for effective policy interventions [Citation1]. Rapid development in Cairo, Alexandria, and Giza leads to increased municipal solid waste (MSW) generation, hindered by inadequate infrastructure, incentives, and awareness campaigns for recycling and resource recovery programs [Citation2]. Egypt was promoting sustainable development, environmental protection, and public health by implementing waste-to-energy (WTE) projects, public-private partnerships, and exploring alternative waste management and energy-generating paths [Citation3]. Waste-to-energy (WTE) technologies offer renewable energy and reduce landfill pollution. Public-private partnerships (PPPs) in WTE leverage private sector capital and expertise for infrastructure development [Citation4]. PPPs enable governments to accelerate WTE infrastructure deployment by combining private sector efficiency and risk sharing, despite significant financial, technical, regulatory, environmental, and social risks [Citation5]. Developing nations exacerbate these risks due to potential limitations in institutional ability, regulatory frameworks, and capital access [Citation6]. So, the research questions are, what are the primary risk factors associated with waste-to-energy projects? How can Egypt benefit from the common relationship of public-private partnerships (PPPs) in waste-to-energy (WTE) solutions? What are the emerging technologies in waste-to-energy (WTE) conversion, and What are their potential contributions to environmental sustainability, resource efficiency, and energy production? What factors influence the selection of new technology for waste-to-energy WTE projects in Egypt? The research highlights the need for improved technology and community engagement strategies. It examines the risks associated with waste-to-energy projects through public-private partnerships (PPPs), aiming to reduce vulnerability and enhance resilience. The study uses a risk allocation matrix (RAM) and considers factors for selecting suitable technology to implement waste-to-energy WTE plants.
Literature review
Waste management in Egypt
Overview current situation
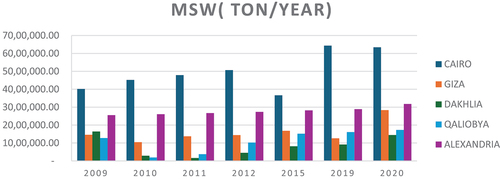
Egypt’s rapidly expanding population, industrialization, and urban development pose significant challenges in garbage management. Annually, Egypt generates in excess of 90 million tons of solid waste, with around 21 million tons constituting MSW [Citation7]. In the process of MSW, refer to the typical goods that are thrown out of residential areas, educational institutions, and medical facilities. These items encompass various materials, such as product packaging, newspapers, paint, batteries, furniture, clothing, bottles, grass clippings, and appliances. On a different matter, megacities such as Cairo and Giza produce most of the waste, generating 32,570 tons per day with a collection efficiency ranging from 50% to 70% [Citation8]. Only 7% of the country’s waste management practices involve landfilling, with 81% relying on open dumping. Around 65% of WM generation ends up at inadequate final disposal sites, including over 20 illegal dumpsites. Further open-burning dumpsites create health risks for workers and communities [Citation9,Citation10]. depicts the generation of municipal solid waste (MSW) in the top five Egyptian megacities – Cairo, Giza, Dakhlia, Qalyoubia, and Alexandria – both currently and in the future [Citation6,Citation10–13].
Figure 1. MSW generation over the years.
Challenges and opportunities for waste-to-energy (WTE) projects
Egypt faces challenges in maintaining an adequate energy supply, including a shortage of fuel, infrastructure restrictions, inadequate waste management, decreased subsidies, and the need for renewable energy. Waste-to-energy (WTE) is a promising solution to these issues, but there is a lack of research on its role in Egypt’s energy sector. The Egyptian Vision 2030 pillars emphasize the importance of WTE in advancing the country’s energy sector. New projects have been opened since 2019 and are still in the early stages of development [Citation14–17]. Saudi Arabia’s Energy has invested $500 million in a 100 MW WTE facility, while Belgium’s Besix and Orascom Construction have invested $225 million in a WTE power plant in Beheira. Renergy Group Partners plans to establish three WTE plants in Abu Rawash. In the same line, the state-owned Fayoum facility generates 100 KWh of power per day by processing 2.5 tons of waste without emitting carbon dioxide. However, investors face financial hurdles, and the state has made WTE projects eligible for subsidized loans with lower interest rates [Citation18].
Waste to energy (WTE) projects and public private partnerships (PPPs)
To better exploit the potential of PPPs, Egypt’s Vision 2030 WM plan is to generate energy and reduce waste while encouraging innovation, technology transfer, and information exchange. Waste management systems (WMS) illustrate that PPPs extend agreements for infrastructure and services between government agencies and the private sector, where the latter assumes management and risk-sharing duties. Governments use public services to attract private investment, and PPP initiatives promote sustainable development by fostering collaboration and executing capital restructuring strategies [Citation19].
Challenges of waste-to-energy (WTE) in worldwide projects
Several studies in India, Norway and China have stated that the government’s involvement, inadequate political decision-making, financial risk, fluctuations in market demand, corruption, subjective evaluation, interest rate fluctuations, and inflation were the top 10 risks associated with WTE projects in China [Citation20–23]. These risks included a lack of supporting infrastructure, an insufficient waste supply, unlicensed waste disposal, environmental risk, and payment risk [Citation24]. Similarly, a few studies have created a framework for risk analysis, specifically for projects that involve the conversion of waste into electricity. Despite this, researchers have divided risks related to construction, operation, macroeconomics, law, society, politics, and government into 14 categories [Citation25,Citation26]. In addition to the studies, four risk categories affect investors in public, private, and partnership incineration projects: financial and legal, technological advancements in WTE, obstacles to MSW, and opposition from indigenous people. In the same line, 21 risk factors were present: income, waste generation, output, public response, contaminated environment, and completion [Citation27]. Additionally, further development has constructed a model for risk assessment of incineration plants for waste-to-energy projects using scaled multiorganization fuzzy rough forms (MGFRSs) across two scenarios [Citation28]. Furthermore, the risks related to payment, local employment, economic growth, succession planning for local government, operating cost overruns, waste supply, revenue risk, and pricing change risk were, eventually, the top ten challenges [Citation29]. Therefore, the research aims to discuss all the aspects and categories that challenge WTE projects in Egypt, especially policy and legal considerations.
Policy and governmental laws
Egypt has implemented waste-to-energy (WTE) initiatives to meet its energy needs and manage its growing waste volumes [Citation30,Citation31]. In the process of setting renewable energy targets, a feed-in economic program encourages investments in renewable energy, particularly WTE. However, Egypt’s legal system, which consists of several laws controlling the disposal of solid waste, is insufficient. Since 2010, the Ministry of the Environment has been conducting programs to improve waste collection, transportation, and recycling. Law No. 717/2019 outlines the Egyptian code of design principles and implementation standards for the MSW management system. To enhance waste disposal conditions, the Egyptian Waste Management Authority (WMRA) has made efforts [Citation32]. Law 202/2020 establishes a comprehensive framework to enhance waste management and recycling methods [Citation33,Citation34]. Feed-in-Tariff (Fit) Decree No. 41 of 2019 controls Egypt’s WTE sector and sets the price for electricity made by WTE plants. However, the total capacity of WTE plants is limited to 300 MW, and the rate chosen by WTE projects is not a good way to make money in the first five years after the decree was issued. Moreover, the medium-voltage network, operating at either 11 or 22 kilovolts (KV), requires the station to have a minimum capacity of 500 KW and a maximum capacity of 20 MW. The station owner is responsible for covering the expenses associated with connecting the station to the nearest medium-voltage access point. So, the research aims to better exploit the potential of awareness for risk allocation between public-private partnership projects and technology implementation to share the risks between stakeholders for further development in waste management and achieve sustainability [Citation14,Citation15].
Waste-to-energy (WTE) technologies
Since most countries presently apply waste as an example of sustainable energy, reusing waste for energy is a sustainable choice for generating power and heating buildings [Citation35]. Burning is still the most popular reduction technique in developing countries, despite the evaluation of anaerobic digestion, gasification, and WTE technologies for circular economy systems [Citation36,Citation37]. Waste technology can address MSW issues, with eight technologies assessed, four emerging, and four proven to be the best fit for King’s County [Citation38]. The most efficient solution for Kafr El-Sheikh in Egypt was anaerobic digestion with recycling, which offered an annual energy potential of 1170 KWh per ton of waste, as shown in ‘s comparison of ten technologies for applying WTE in four main criteria: benefits, limitations for each technology, principal product, and final application output [Citation39]. Furthermore, thermal conversion techniques dominate most of the worldwide waste-to-energy business, despite the division of waste-to-energy technologies into thermal and non-thermal processing, each with unique hazards and consequences. Anaerobic digestion and hydrolysis are examples of non-thermal processes [Citation40]. PPP projects, particularly incineration, face significant risk due to technology choice, with 50% rated as highly critical, highlighting India’s low success rate in these technologies [Citation41]. Furthermore, researchers in Chittagong City, Bangladesh, found a more environmentally responsible way to convert waste into energy while also considering alternatives, including landfill gas rehabilitation, anaerobic digestion of waste, gasification processes, and incineration [Citation42]. The analysis found that there are four alternative ways to dispose of waste: burning in large quantities without processing, burning in large quantities with 25% recycling, burning in large quantities with 50% organic material eliminated, and burning in large quantities without 50% organic material excluded [Citation43].
Table 1. Comparison for WTE technologies [Citation35–41].
Research methdology
Risk identification factors
A literature review and expert interviews were carried out to collect Egyptian WM reports due to their confidence of the Ministry of Environment and WMRA. By exploring the challenges and complexities inherent in such endeavors, the research seeks to identify and categorize the various risks specific to WTE projects in Egypt. As a result, eight categories of risks related to WTE projects through PPPs were identified. The analysis showed that these categories of risks were mainly land accessibility, availability, and site risks; social risks; environmental and human health risks; design risks; construction risks; operational risks; financial risks; and risks related to strategy and collaboration, as shown in . Another study involved questionnaires for identifying the risks of WTE through PPP projects in different countries. In these studies, an analysis was conducted and different factors of risk were identified. The results showed that these risk factors included the availability of necessary land (land ownership, papers, and allocation confirmed), timing of provision of required land, community and business, resettlement, the heterogenous nature of MSW on human health, public acceptance, cost increases, etc., as shown in . These risks are believed to be of particular interest; hence, they have been included in the study for further analysis. In addition, an identification and allocation of risks were conducted and presented in . Taking into account the literature review and interviews with experts, a list of 67 potential risks was identified below 8 categories of risks, as shown in .
Questionnaire implementation
Three rounds of questionnaires were conducted in Egypt, especially in the two megacities of Cairo and Giza, from September 2023 to December 2023, to ensure the identified factors and their allocations. Initially, the first round started with a group of experts who have in-depth knowledge and experience about WTE projects, their technologies, and the implementation of using PPP in such projects. Who should comply with extensive working experience and recent research on WTE and PPP projects, or who should have a deep understanding of the concept of risks in PPP projects?
Questionnaire location, population and limitation
The data collected from the current questionnaire survey was analyzed using the mean score method according to the primary roles of the respondents. The three-point Likert scale described previously was used to calculate the mean score for each risk, which was then used to determine their allocation. Egypt’s PPP projects are the exclusive focus of the research on WTE projects. The respondents included managers at the Ministry of Environment, municipalities, environmental engineers (managers and seniors), and WMRA with experience working in WM and WTE project facilities. In addition, the questionnaire was limited to Egypt’s two mega-governorates, Cairo and Giza. Furthermore, the population survey was conducted using a sample size equation to determine the sample size of the distributed questionnaires. CAPMAS reports [Citation44] indicate that the environmental industry, particularly WM, employed 142 people at managerial and senior levels in Cairo and Giza municipalities in 2022. The sample size is equal to 83 surveys, as indicated in , the population size of two governorates, waste generation per person, and total MSW generation per year [Citation45].
Table 2. Cairo and Giza statistics.
The formula uses e as the margin of error (7%) and p as the population proportion, which is expressed as a decimal (0.50 for the required sample size), and z as the Z-score (1.96 for the 95% confidence level). N stands for population size.: Megacities’ disposal data [Citation46,Citation47]. indicates that 83 questionnaire forms were given in total, and 50 of those forms were returned by respondents, providing a 60% response rate.
Table 3. Questionnaire: respondents’ profile.
Questionnaire analysis tools
A total of 83 practitioners and academics were identified and invited to participate in this research, supported by identified criteria for the selection of suitable technology to implement in WTE plants to be reviewed. An invitation e-mail and interviews with selected experts accompanied the first round of the questionnaire. Consequently, the e-mail clarified the research’s purpose and informed the experts about the upcoming two rounds of questionnaires. In addition, the definition of each risk category as presented from the previous studies in was also provided at the beginning of the questionnaire, In the second round, which involved sending e-mails and some interviews, the risks were explained in two languages, Arabic and English, to ensure the same understanding of the terms among the respondents. Although, the questionnaire in the first round was conducted in two parts: general information for the respondents and all risk factors for allocation, In the second round, the experts suggested dividing it into 10 sections. The first section was for the experience of respondents and general information, second one was for risk category definitions and risk factor descriptions and ensuring identified criteria for suitable selection of the proper technology, as shown in . Subsequently, we presented the remaining 8 sections in two languages, one for each category. Furthermore, the respondents asked to assign the described risk to either the private PR or the public PB sector, or to describe it as a ‘shared’ SH between the public and private sectors, using a three-point Likert scale. 1: The public sector takes role responsibility, 2: Both parties take equal responsibility, 3: The private sector takes role responsibility. The third round was done by sending e-mails to the experts to ensure the additional comments were suggested as risk factors for allocation. Risk allocation matrix RAM was conducted from a total of 50 completed questionnaires received in the second round, representing a highly favorable successive rate of 60% with respect to the first and third rounds. provides information about the respondents. The analyzed data from the current questionnaire survey was used using the mean score method. The three-point Likert scale described previously was used to calculate the mean score for each risk, which was then used to determine their allocation as shown in .
Table 4. Risk categories contribute to waste-to-energy (WTE) projects [Citation20–27].
Table 5. Risk allocation matrix RAM for WTE-PPP projects.
Table 6. Major criteria for evaluation of waste-to-energy (WTE) technologies.
As previously mentioned in Emerging WTE Technologies; Some of the main emerging WTE technologies include: Anaerobic digestion (AD) – Breaks down organic waste to produce biogas that can be used for energy or transportation fuel, Pyrolysis and gasification – Heat waste at high temperatures with little or no oxygen to produce syngas or bio-oil that can be used for energy, Plasma gasification – Uses extremely high temperatures to convert waste into a syngas that can be used for energy, and Advanced thermal treatment – Includes pyrolysis, gasification and plasma technologies to produce energy from waste Potential Contributions These emerging WTE technologies have the potential to contribute to environmental sustainability, resource efficiency and energy production in Egypt in several ways: Divert waste from landfills and reduce methane emissions, Recover energy and valuable materials from waste, optimizing resource efficiency, by producing renewable energy in the form of electricity, heat, transportation fuels or syngas, Reduce reliance on fossil fuels and greenhouse gas emissions compared to landfilling and produce a stable, inert slag that can be used as construction material.
Discussions
The study employed statistical descriptive analysis using the Statistical Package for Social Sciences (SPSS) to explore the preferred risk allocation matrix (RAM) for sustainable solid waste management, focusing on municipal solid waste (MSW) PPP projects. The survey feedback concerning the preferred RAM is presented in , which involved input from stakeholders, legislators, governments, and municipalities to improve performance and risk awareness.
Risks of WTE allocation partiality
The findings indicate that 50 completed respondents, The preferred risk allocation options are presented as the mean values of participants’ responses. Three risk allocation categories are identified according to the ‘‘half-adjusting” principle: Risks (with a mean score smaller than 1.9) that should be solely allocated to the PB sector, risks (with a mean score range or equal to 2) that should be equally SH by both parties, and risks (with a mean score greater than or equal to 2.5) that should be solely allocated to the PR sector. However, no risk fell into the category that should be solely allocated to the private sector, as presented in .
Risks allocated to PB sector
The results diverge from the prevailing view that WTE-PPP in Indian studies risk allocation that the PB sector hadn’t been presented in the risk allocation matrix except in the risks related to the financial risks as revenue. In fact, this research found that there has been identified category of Financial Risk consist of 9 factors of risk anticipated revenue risk in 2 factors of the supply and demand than anticipated and refinancing risks [Citation20,Citation21]. In contrast with conclusions of Norwegian studies, their research was only focused on the challenges and opportunities of risk without focusing on assessment nor risk allocation for the sectors [Citation22]. However, the present research reveals that the first 12 factors under the category of land accessibility, availability, and site risks are carried out by the PB sector, as shown in . The mean score for the factors ranges from 1.48 to 2.02, as presented in the above section. In summary, the risk of availability of necessary land (land ownership, papers, and allocation confirmed with a mean score of 1.56), access to the site and associated infrastructure (ground water level), and suitability of land (geological factors (soil permeability and bearing capacity) have the same mean score of 1.58. Despite this, site utilities, installation, and site security have high mean scores of 2.02 and 2.16. On the same line, the three factors behind social risk have the same range of mean scores. Although it has some increases, it’s still allocated to the PB sector, such as communities and businesses. Resettlement, heritage, and indigenous people factors have scores of 2.1, 1.74, and 1.98, respectively. The data support the hypothesis of research in China that investigated and identified many factors of risk related to government as a high importance of risk such as public opposition, government decision making risk and government credit risk [Citation23,Citation24].
Risks allocated to PR sector
On the other hand, the PR sector has taken on the responsibility for three categories: design risks, construction risks, and operation risks. To mitigate the risks associated with design, three key factors need to be considered. Suitability of design and technological option, approval of designs, and changes to design have mean scores of 2.14, 2.16, and 2.26, respectively. In the same line, the construction risk factor of managing projects and interacting with other resources and facilities has the same mean score of 2.26, as shown in . The highest factor Third-party liability as well as accountability for death, physical injury, and property damage have a score 2.46. In addition to operation risk factors, they have many high mean scores, i.e. increased operating costs and affected performance (2.52), health and safety compliance 2.5, Maintenance Standards 2.4. The research results cooperate the findings of allocation of design risks and construction risks on PR sectors [Citation20]. Additionally, the risk assessment in WTE-PPP divided into 4 groups 2 of them are construction and operation risks allocated to PR [Citation23–25]. Consistent with the work of the present research, technical risks, construction cost overruns and performance risk, assessed the highest importance PR sector risks [Citation27]. The government of China recommended clearly specify the rights and obligations of both parties, with provisions reflecting reasonable levels of flexibility for the private entity to develop and manage the plant to conform with specific local requirements and conditions, where appropriate risk allocation between both parties [Citation26].
Risks allocated to SH parties
In the contrast with previous studies [Citation20–26], the present research found that the last three categories have been allocated as shared responsibility between the parties i.e. Environmental and human health Risks, Financial Risks, Risks related to strategy and collaboration. In the same line, financial risks such as MSW Supply and demand, inflation, exchange, currency, interest rate risks and force majeure were allocated as SH as presented in RAM risks related to strategy and collaboration [Citation27–29].
Thirty factors of risk have been allocated as SH risk in RAM out of total 67 factors of risk have mean scores as mentioned in . Which means that risks should be shared equally for both parties, the PB and PR sectors, to succeed in the complexity of WTE projects. In conclusion, the preferred risk allocation identified in this study can help the public and private sectors achieve a better balance in the distribution of responsibilities and risks in water PPP projects in Egypt. Adopting a standardized approach to risk allocation, based on international best practices, can reduce the time and cost of contract negotiation and facilitate the development of these projects in a more stable contractual framework.
Conclusions
This research has studied the allocation preferences of risks in Egypt WTE at PPP projects. The identified risk allocation preference would help the PB and PR sectors achieve a balance in the distribution of responsibilities and risks and thus reduce the time and cost of contract negotiation. Implementing this standardized approach of risk allocation matrix can help facilitate the development of WTE-PPP Projects in a stable contractual framework. According to the analysis, only 2 out of the 8 categories of risk – land accessibility, availability, site risks, and social risks – were allocated to the PB sector. 15 risks to be mostly allocated to the public sector were identified, as shown in , which were all related to the government or government officers and their actions. In the equally shared risk category option, there were 30 risks. The nature of these risk factors makes it difficult for either the PB or the PR sector to deal with them alone. The PR sector should take the majority of responsibility for the remaining 22 risks, which all belong to project-level risks. Hence, another observation that can be made is that PPP design, construction, and operation risks in Egypt have achieved the objective of full risk transfer from the public sector to the private sector. In the same vein, criteria for WTE technology like waste composition, scale, environmental impact, and financial viability influence the selection of these technologies [Citation27,Citation28], and [Citation29]. Researchers examined reduction technologies like plasma arc gasification and bio methanation, which are gaining acceptance in industrialized and developing countries, while the waste-to-energy method remains under investigation [Citation36–41]. Additionally, as indicated in , the current study demonstrates their progress in examining nine criteria for assessing the suitable WTE-PPP technologies in Egypt. Furthermore, the research revealed that Egypt’s waste management and waste-to-energy application restrictions require additional risk analysis and further development in data collection. The research paper recommends a comprehensive approach to the waste management model, involving waste characterization, life cycle assessment, community engagement, technological innovations, policy frameworks, public-private partnerships, robust monitoring, and local context adaptation for comprehensive sustainable development.
List of abbreviations
| MSW | = | Municipal Solid Waste |
| WTE | = | Waste-to-Energy |
| RAM | = | Risk Allocation Matrix |
| PPPs | = | Public-Private and Partnership |
| WM | = | Waste Management |
| WMS | = | Waste Management System |
| WMRA | = | Waste Management Regulation Authority |
| CAPMAS | = | Central Agency for Public Mobilization and Statistics |
| MW | = | Megawatt |
| KWH | = | Kilowatt per hour |
| KV | = | Kilovolt |
| PB | = | Public sector |
| PR | = | Private sector |
| SH | = | Shared relationship |
Disclosure statement
No potential conflict of interest was reported by the authors.
References
- Central Agency for Public Mobilization and Statistics [CAPMAS]. Population clock. 2021. Available from: http://www.capmas.gov.eg/Pages/populationClock.aspx
- Abdel-Shafy H, Mansour M. Solid waste issue: sources, composition, disposal, recycling, and valorization. Egypt J Petroleum. 2018;27(4):1275–1290. doi: 10.1016/j.ejpe.2018.07.003
- UNEP (United Nations Environment Programme). Waste-to-energy: a guide for decision-makers in developing and emerging countries. Nairobi, Kenya: United Nations Publications; 2010.
- Das S. Waste-to-energy (WTE) projects in developing countries: opportunities and challenges. Renewable Sustain Energy Rev. 2021;139:110674.
- Enterprise Agency, N. Market scan solid waste management in Egypt sector overview & business opportunities. Netherlands Enterprise Agency; 2023. https://www.rvo.nl/sites/default/files/2023-03/Market-Scan-Solid-Waste-Management-in-Egypt.pdf
- The annual report for environment statistics for the year 2019 by the central agency for public mobilization and statistics CAPMAS, the report published in March (2020).
- Country report on the solid waste management in EGYPT. 2015.
- EEAA. Egypt state of environment report. Chatswood, Australia: EEAA; 2017.
- Zaki T, Kafafi AG, Mina MB, et al. Annual report for solid waste management in Egypt. 2013.
- The annual report for environment statistics for the year 2009 by the central agency for public mobilization and statistics CAPMAS, the report published in March; 2010.
- The annual report for environment statistics for the year 2011 by the central agency for public mobilization and statistics CAPMAS. the report published in March; 2012.
- The annual report for environment statistics for the year 2013 by the central agency for public mobilization and statistics CAPMAS. the report published in March; 2014.
- The annual report for environment statistics for the year 2018 by the central agency for public mobilization and statistics CAPMAS, the report published in March; 2019.
- ARE. Prime Minister decree No.41 in 2019 (in Arabic), published in the official newspaper issue 48 (2) on 2 December. The Arab Republic of Egypt, Cairo; 2019.
- Waste Management Regulatory Authority (WMRA). Executive guidelines for investment in W2E. Cairo: Ministry of Environment; 2019.
- Farag M. Egypt sets waste-to-energy purchasing tariff at EGP 1.4 per kw/h. Daily news Egypt. 2019 [cited 2020 Apr 17]. Available from: https://dailyfeed.dailynewsegypt.com/2019/10/23/egypt-sets-waste-to-energy-purchasing-tariff-at-egp-1-4-per-kw-h/
- Farag M. Egypt receives $2bn worth bids to establish waste-to-energy projects”. Daily news Egypt. 2019 [cited 2020 Apr 17]. Available from: https://dailynewsegypt.com/2019/11/01/egypt-receives-2bn-worth-bids-to-e stablish-waste-to-energy-projects/
- American chamber of commerce in Egypt. Green Energy; fueling Egypt’s future. AmCham. 2022 [cited 2023 Nov 12]. Available from: https://www.amcham.org.eg/publications/industry-insight/issue/58/waste-to-energy
- Guidelines on people-first PPPS for waste to energy projects. n.d. Available from: https://sustainabledevelopment.un.org/sdg7
- Public private partnerships toolkit for public private partnership frameworks in municipal solid waste management volume I-Overview and process prepared by ICRA management consulting services limited INDIA with support. Available from: www.pppindia.com
- Song J, Song D, Zhang X, et al. Risk identification for PPP waste-to-energy incineration projects in China. Energy Policy. 2013;61:953–962. doi: 10.1016/j.enpol.2013.06.041
- Becidan M, Wang L, Fossum M, et al. Norwegian waste-to-energy (WTE) in 2030: challenges and opportunities. Chem Eng Trans. 2015;43:2401–2406. doi: 10.3303/CET1543401
- Cui C, Sun C, Liu Y, et al. Determining critical risk factors affecting public-private partnership waste-to-energy incineration projects in China. Energy Sci Eng. 2020;8(4):1181–1193. doi: 10.1002/ese3.577
- Xu Y, Chan APC, Xia B, et al. Critical risk factors affecting the implementation of PPP waste-to-energy projects in China. Appl Energy. 2015;158:403–411. doi: 10.1016/j.apenergy.2015.08.043
- Wu Y, Xu C, Li L, et al. A risk assessment framework of PPP waste-to-energy incineration projects in China under 2-dimension linguistic environment. J Cleaner Prod. 2018;183:602–617. doi: 10.1016/j.jclepro.2018.02.077
- Huang J, Liu S, Plaza A, et al. Creating an enabling environment for public–Private partnerships in waste-to-energy projects. 2018. doi: 10.22617/WPS189766-2
- Zhang X, Wang L. Causal relationships of risk factors in PPP waste-to-energy incineration projects. IJAEC. 2018;7(3). doi: 10.7492/ijaec.2018.018
- Luo C, Ju Y, Dong P, et al. Risk assessment for PPP waste-to-energy incineration plant projects in china based on hybrid weight methods and weighted multigranulation fuzzy rough sets. Sustain Cities Soc. 2021;74:103120. doi: 10.1016/j.scs.2021.103120
- Cao G, Guo C, Li H. Risk analysis of public–Private partnership waste-to-energy incineration projects from the perspective of rural revitalization. Sustainability (Switz). 2022;14(13):8205. doi: 10.3390/su14138205
- Egypt’s First Biennial Updated Report. Total final consumption by sector. IEA Stat Data. 2018. 77 Climate Watch. 2022.
- Egyptian Environmental Affairs Agency (EEAA). Egypt Third National Communication under the United Nations Framework Convention on Climate Change. Cairo, Egypt: Egyptian Environmental Affairs Agency (EEAA);. 2016.
- Ministry of International Cooperation, Arab Republic of Egypt. Sustainable Development Strategy (SDS): Egypt Vision 2030. National Voluntary Review.Cairo, Egypt: Ministry of International Cooperation; 2016.
- Egyptian Environmental Affairs Agency (EEAA). Environmental protection law – law #4 for 1994. 2019. Available from: https://www.eeaa.gov.eg/en-us/laws/envlaw.aspx
- Ministry of Environment, Arab Republic of Egypt. Waste management regulation Law - Law 202 for 2020 promulgating the waste management regulation Law. Egyptian environmental affairs agency (EEAA) - ministry of environment, Arab Republic of Egypt. 2020. Available from: https://www.eeaa.gov.eg/en-us/laws/wastemanagregulationlaw.aspx
- Ministry of Urban Development. The high powered expert committee (HPEC) for estimating the investment requirements for urban infrastructure services. Report on Indian urban infrastructure and services. Ministry of Urban Development, Government of India; 2011
- Funk K, Milford J, Simpkins T. The joint institute for strategic waste not, want not: analyzing the economic and environmental viability of waste-to-energy (WTE). Technology for Site-Specific Optimization of Renewable Energy Options; 2013. Available from: http://www.osti.gov/bridge
- Pan SY, Du MA, Huang IT, et al. Strategies on implementation of waste-to-energy (WTE) supply chain for circular economy system: a review. J Cleaner Prod. 2015;108:409–421. Elsevier Ltd. doi: 10.1016/j.jclepro.2015.06.124
- County Solid Waste Division, K. Waste-to-energy (WTE) options and solid waste export considerations - King county solid waste division; 2017. Available from: www.normandeau.cominconjunctionwith
- Abdallah M, Shanableh A, Arab M, et al. Waste to energy potential in middle income countries of MENA region based on multi-scenario analysis for Kafr El-sheikh governorate, Egypt. J Environ Manage. 2019;232:58–65. doi: 10.1016/j.jenvman.2018.11.029
- A waste to energy guideline for New Zealand. 2020.
- Dolla T, Laishram B. Effect of energy from waste technologies on the risk profile of public-private partnership waste treatment projects of India. J Cleaner Prod. 2021;284:284. doi: 10.1016/j.jclepro.2020.124726
- Alam S, Rahman KS, Rokonuzzaman M, et al. Selection of waste to energy technologies for municipal solid waste management—towards achieving sustainable development goals. Sustainability (Switz). 2022;14(19):11913. doi: 10.3390/su14191191
- Ezzat Salem M, Abd El-Halim H, Refky A, et al. Potential of waste to energy conversion in Egypt. J Electr Comput Eng. 2022;2022:1–17. doi: 10.1155/2022/7265553
- Daniel WW. Biostatistics: a foundation for analysis in the health sciences. 7th ed. (NY): John Wiley & Sons.-sample size; 1999.
- The annual report for workforce statistics for the year 2021 by the central agency for public mobilization and statistics CAPMAS. The report published in March. 2022.
- Cairo status report on preparing a strategic plan for solid waste management, published by WMRA and NSWMP. 2018
- Giza status report on preparing a strategic plan for solid waste management, published by WMRA and NSWMP; 2018