Abstract
The dynamic load distributions applied to Kirchhoff plates are determined by inverse analysis in this article. The initial continuous problem is discretized by FEM based on Laplace transformation as regards the dynamic behavior. The strains calculated by vibration analysis are selected as known additional information in this inverse analysis. The Tikhonov regularization and L-curve method for choosing regularization parameters are exploited to deal with the ill-posedness of this problem. The time histories of load distributions are achieved by numerical inverse Laplace transformation based on FFT algorithm. The analyses of numerical experiments show fine accuracy and stability of the solutions derived from the present inverse methodology.
1. Introduction
Determination of load distribution was always paid close attention by scientists and engineers due to its important influence on civil constructions and the actual difficulties with measurements. In aviation or spaceflight fields for example, aircraft often undergo collision with objects such as aerolites or birds Citation[1]. And sometimes the collision is fatal for high speeds. Hence studying the load distribution on the aircraft surface is crucial to improve aircraft structures. The same problem exists in other engineering fields too. Load distributions can be measured by some transducers such as accelerometers or force transducers only if the objects generating the loads are much harder than the structures. Otherwise the measurement cannot be made as the transducers are difficult to be installed in soft bodies, and moreover, the signals measured by the transducers are difficult to be transformed into forces in the contact field. Hence some technique has to be devised to determine the load distributions rather than direct measurement. One such successful approach is the inverse analysis. For example, Doyle Citation[2] studied the determination of the impact load distribution on a thin plate by combining classic theories of plates and shells with experimentation. Chang and Sun Citation[3] recovered the dynamic impact forces upon a composite laminate by using experimentally generated Green's functions and signal deconvolutions. The errors of the dynamic load distribution determined by deconvolution are relatively high in actual applications because deconvolution is an ill-posed problem and the noise in measuring signals is blown up. Inoue et al. Citation[4] compared five different methods to identify the transfer function, which connected the load with the input signal. They considered the influence of noise and estimated the impact load distribution by deconvolution. Arai et al. Citation[5] identified the dynamic pressure histories on the elastic thin plate by the boundary element method (BEM) based on Laplace transformation.
In this study, we determine the dynamic load distribution applied to Kirchhoff plates by inverse analysis. The continuous problem is discretized in space field by means of the FEM. Due to the dynamic behavior of the system, numerical Laplace transformation and inversion are introduced to discretize the problem in time and frequency fields respectively. Here, we employ Krings and Waller's numerical Laplace transformation and inversion based on the FFT algorithm Citation[6]. We consider the strain values on every FEM node as additional information for the inverse analysis. Compared with the difficulties of measurement of the dynamic load applied to the plate mentioned above, the strain values at an arbitrary point on the plate surface are easily measured by special instruments such as strain gauges Citation[2–Citation5,Citation7,Citation8]. In this study, however, the strain values are obtained through vibration analysis based on the Rayleigh–Ritz method rather than through measurement. In fact, if the dynamic load distributions are known beforehand, the problem will turn into a forced vibration problem of Kirchhoff plates. The transfer function connecting the input information with the output load is a very ill-conditioned square matrix in the discrete space and frequency fields. We introduce the Tikhonov regularization Citation[9], for better solutions, which is used widely to solve ill-posed problems of middle or small size. The optimal parameter during Tikhonov regularization process is determined by the L-curve method Citation[10]. The present inverse technique is applicable for not only simple structures like Kirchhoff plates but also some general complex engineering structures. The numerical results concerning a square Kirchhoff plate subjected to a dynamical load demonstrate the accuracy and stability of the current sureshguptamethodology.
This article is organized as follows. In section 2, we give the basic equations of the problem studied in this article; in section 3, the approximate solution of the forced vibration of the Kirchhoff plate is derived based on the Rayleigh–Ritz method, and the derived bending strains could be used as additional information for inverse analysis; in section 4, the continuous governing system is discretized by FEM in Laplace-transformed field. The transfer equation connecting the input strain with the unknown load is derived; in section 5, the definition of Laplace transformation and the formulations of the numerical Laplace transformation and inversion are given; in section 6, we apply the Tikhonov regularization and the L-curve method for choosing regularization parameters for the ill-posed problem studied in this article; in section 7, we make some numerical experiments to demonstrate the stability and accuracy of the regularized solutions. In the last section we give some general conclusions.
2. Basic equations
We consider a linear isotropic homogeneous elastic thin plate, with bending limits to small deformation. Such a plate is named as a Kirchhoff plate. Suppose (---485----1) (x, y, t) is the unknown transverse load function applied to the plate. And suppose Ω denotes the plate region, whose boundary is denoted by Γ = ∂Ω. According to Kirchhoff plate theories, the basic equation of the transverse deflection
(---485----2) (x, y, t) is
(---485--1)
where ρ and d denote the mass density and thickness of the plate respectively, D = Ed3/12(1 − υ2) denotes the flexural rigidity of the plate, and E, υ denote the modulus of elasticity and Poisson's ratio respectively.
(---485----3) , where
(---485----4) = (∂2/∂x2) + (∂2/∂y2) is the Laplace operator. Suppose the initial conditions are
(---485--2)
applying Laplace transformation about time t to Equationequation (1)
(---485--1) and using the initial conditions given in Equationequation (2)
(---485--2) , we have
(---485--3)
where p is the Laplace transformation parameter. So the basic Equationequation (1)
(---485--1) in the time domain is transformed into Equationequation (3)
(---485--3) in the frequency domain. The boundary conditions are considered to be fixed, free or simply supported edges.
3. Rayleigh–Ritz method for the direct problem
According to the successful experimental results in various literatures Citation[2–Citation5], we select strains as additional information for the inverse analysis. In fact, we find that the problem of Equationequation (1)(---485--1) plus the initial boundary value conditions is equivalent to a forced vibration problem of the Kirchhoff plate, which can be considered as the corresponding direct problem of determination of load distributions. The exact analytic solution of the forced vibration problem of the rectangular Kirchhoff plate can be obtained by Levy's method Citation[11] provided the plate has one pair of opposite edges simply supported at least. For other cases (e.g., the vibration problem of the plate of nonuniform thickness or with other supported conditions) solutions have to be achieved by using approximate methods among which the Rayleigh–Ritz energy method has proved to be a very popular and efficient technique for vibration analyses Citation[12].
Applications of Rayleigh–Ritz method are often associated with the use of trial functions Tmn(t) and Wmn(x, y) for the deflection (---485----5) , which can be further expressed as a series of products of beam functions in the space field and trigonometric functions in the time field, having the form
(---485--4)
where ωmn is the natural frequency of free vibration of the Kirchhoff plate, Xm(x) and Yn(y) are the principle mode shapes of uniform beams, which have boundary conditions at the beam ends to match with the plate under consideration. Such beam functions are based on classical Bernouilli–Euler beam theory, which is the one-dimensional equivalent of the Kirchhoff plate theory. And these functions have good orthogonal properties. For the case of the rectangular Kirchhoff plate with all edges clamped, which is discussed in section 7, the Bernouilli–Euler beam functions Xm in the x- direction and Yn in the y- direction have the following forms respectively
(---485--5)
(---485--6)
where a and b are the side lengths of the rectangular plate. Parameters km and kn are the roots of the characteristic equation of free vibration of the Bernouilli–Euler beam. Coefficients Dm and Dn are constants.
The coefficients Amn and Bmn in Equationequation (4)(---485--4) are determined by the initial conditions in Equationequation (2)
(---485--2) . And the coefficient Cmn in Equationequation (4)
(---485--4) is a special solution of Equationequation (1)
(---485--1) .
Rayleigh–Ritz energy method Citation[11] has been so well known that we omit the deducing process and derive directly the following formulation for calculating the natural frequency ωmn
(---485--7)
The approximate theoretical solution (---485----6) of the forced vibration of the Kirchhoff plate is obtained immediately after the calculated natural frequency ωmn is taken into Equationequation (4)
(---485--4) . According to the strain–displacement relation in Kirchhoff plate theory, it is simple to obtain the corresponding formulation for bending strains by means of which we can determine strain values at any point and time facilely. And that is another reason we employ the Rayleigh–Ritz method to calculate the strains that are to be used as additional information for the inverse analysis in the next section.
4. FEM analysis
We introduce Benthien–Gurtin's minimum transformed energy principle Citation[13], having the form
(---485--8)
which is equivalent to the problem of Equationequation (3)
(---485--3) plus the initial and boundary conditions. Here the functional Ep(w) is denoted as the total potential energy. The subsequent FEM analysis is carried out starting with the functional minimization problem Equation(8)
(---485--8) .
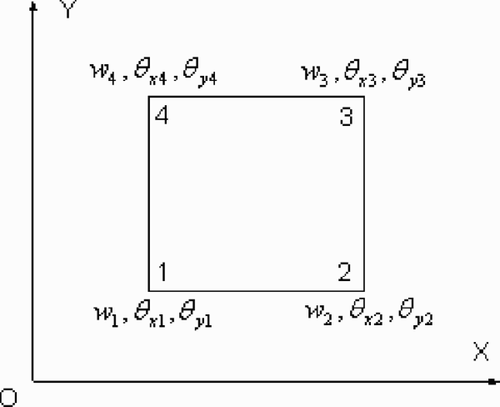
Firstly, we divide the plate region Ω by using the Adini rectangular element (see ), which is a popular inharmonious finite element used to solve bending problems of plates numerically. The triplet (w, ∂w/∂y, −∂w/∂x) is selected as the degrees of freedom every element node. So the element nodal displacement vector δe can be defined as
(---485--9)
(---485--10)
(---485--11)
where i is the local serial number of the element node. We interpolate the deflection w in Laplace-transformed domain by the use of a symmetrical incomplete quadrinomial of the form
(---485--13)
where
(---485--14)
(---485--15)
where the coefficients c1, c2, … , c12 can be determined by substituting the coordinates of nodes 1, 2, 3, 4 into the expressions of the deflection w and its derivatives, that is
(---485--16)
where G is a constant square matrix, which depends on the coordinates of element nodes. The interpolation expression of w is obtained by substituting Equationequation (16)
(---485--16) into Equationequation (13)
(---485--13) , thus yielding
(---485--17)
where N is called the shape function. After we replace w in functional Ep by the interpolation formula Equation(17)
(---485--17) and assuming δEp = 0, the equation of the total stiffness matrix can be derived as
(---485--18)
where K and δ are the total stiffness matrix and the total displacement vector of the system respectively. F is the undetermined discrete load distribution vector.
Figure 1. Adini element.
How to determine F is an essential issue in this study. We select the nodal strain values on the plate surface as additional information for the inverse analysis as mentioned in section 1. According to the strain–displacement relation in Kirchhoff plate theories, the three strain components on the plate surface can be written as
(---485--19)
(---485--20)
(---485--21)
The element strain vector is defined as
(---485--22)
After Equationequation (17)
(---485--17) is substituted into Equationequations (19)
(---485--19) –Equation(21)
(---485--21) , εe can be rewritten as
(---485--23)
where
(---485--24)
(---485--25)
Matrix Be in Equationequation (23)
(---485--23) is called element geometric matrix. The total geometric matrix equation will be created by the FEM superposition method, it should be noted that the strain values on each node are superposed only once. The equation of the total geometric matrix can be written as
(---485--26)
If we eliminate δ from Equationequations (18)
(---485--18) and Equation(26)
(---485--26) , the transfer matrix equation becomes
(---485--27)
where
(---485--28)
Here the undetermined load vector F is connected with the input strain vector ε via the transfer matrix J. We notice that matrix B is composed of the second partial derivatives of the shape function N, which indicates that matrix B is rank-deficient. Yet the condition number of K−1 is relatively small. It can be obviously concluded from Equationequation (28)
(---485--28) that J is also a rank-deficient matrix. In other words, the problem of determining dynamic load distribution applied to Kirchhoff plates discussed in this study is an ill-posed problem, which should be solved by a suitable regularization method like the Tikhonov regularization, which will be discussed in section 6.
It is well known that FEM has been and still is a robust and prevalent tool for numerical analyses in many engineering and scientific fields hitherto. We can extend the range of the object structures out of Kirchhoff plates to more complicated ones. However, thousands of elements will be required if we apply FEM to complicated and large-scale structures such as airplanes, automobiles, etc. in actuality. And the computational cost is often too expensive to be undertaken. Yet we can divide the whole body into available and smaller parts, which can be further analyzed by simple finite elements. The dynamic load distributions in local regions can be determined part by part in virtue of the corresponding strain values according to the above analyses. It must be noted that the determined solutions of boundaries between two parts should be superposed when parts are being combined into a complete unit. In this way, the rank of the system matrix is reduced and the efficiency of FEM is highly enhanced.
We should also notice that the FEM analysis described in this section and the Tikhonov regularization process in section 6 are both defined in the frequency domain. It is convenient to discretize the frequency first for calculation. Numerical Laplace transformation and inversion are introduced to determine time histories of the dynamic load in this study. Some details are described in the subsequent section.
5. Numerical Laplace transformation and inversion
Laplace transformation, as an important class of integral transformation, has been broadly applied to many physical or engineering problems numerically or theoretically. The main issue is about a three-dimensional partial differential system described in section 2. After we applied Laplace transformation about time t to the governing Equationequation (1)(---485--1) , the original problem became a simpler one in the frequency domain. Finally the solutions in the time domain can be derived from inverse Laplace transformation. But in reality it is often difficult to solve the inverse Laplace transformation analytically. Hence we employ in this study the Krings and Waller's Citation[6] numerical Laplace transformation method and inversion based on the FFT algorithm.
Suppose h(t) is a function defined at t ≥ 0 and satisfies h(t) = 0 at t<0, the Laplace transformation of h(t) can be written as
(---485--29)
and the inversion can be written as
(---485--30)
where L is the Laplace transformation operator, i is the imaginary unit and p is the Laplace transformation parameter, which generally is a complex number. Suppose p = γ + iω, where γ is a positive constant, we have
(---485--31)
which can be considered as the Fourier transformation of h(t) with a window function e−γt and be calculated efficiently by the use of FFT algorithm. The pair of numerical Laplace transformations can be formulated according to the sampling theorem as follows Citation[14]
(---485--32)
(---485--33)
where Δt and Δω are the sampling intervals in time and frequency domains respectively and satisfy the following relations
(---485--34)
where T is the time period.
The choice of the parameters γ and N determines the computing accuracy directly in the process of numerical Laplace transformation and inversion. In general, the larger the parameter N is, the smaller the computing errors. Wilcox Citation[15] claimed that γ should be 2Π/T in most circumstances. Krings and Waller Citation[6] found the valid range of γ, that is 3/T ≤ γ ≤ 10/T, from vast numerical experiments.
6. Tikhonov regularization
The Tikhonov method is a very famous regularization strategy developed independently by Phillips Citation[16] and Tikhonov Citation[17]. The main idea of this method is to incorporate a priori assumptions about the size and smoothness of the desired solution. For the discrete ill-posed problem in this study, the Tikhonov regularization in general form leads to the following minimization problem
(---485--35)
where subscript l is defined as the parameter for discretizing the natural frequency in the numerical Laplace transformation method.
(---485----7) denotes the Euclidean norm. The regularization parameter αl controls the weight given to minimization of the regularization term, relative to the minimization of the residual norm. The regularization matrix Ll essentially corresponds to a change of basis vectors for the regularized solution. This research can be found in Citation[18] and Citation[19]. Here we choose Ll as the discrete matrix to approximate the first derivative operator in the form
(---485--36)
(---485--37)
which is well suited for the desired solution. Here M is the row number of the transformed matrix Jl. General SVD (GSVD) of the matrix couple (Jl, Ll) can be written as
(---485--38)
where Ul = [u1,l, u2,l, … , uM,l] ∈ CM × M, Vl = [v1,l, v2,l, … ,v(M−1),l] ∈ C(M−1) × (M−1), are both unitary matrices, and Wl = [w1,l, w2,l, … , wM,l] ∈ CM × M is a nonsingular matrix. I1 is a unit matrix of order one. diag(σi,l) ∈ R(M−1) × (M−1) and diag(τi,l) ∈ R(M−1) × (M−1) are both diagonal matrices whose diagonal elements are nonnegative and satisfy
(---485--39)
The general singular values of (Jl, Ll) are defined as ρi,l = σi,l/τi,l, which satisfy
(---485--40)
If we minimize the functional (---485----8) according to the Tikhonov regularization, the optimal solution Fl tied to αl can be written as
(---485--41)
A sum formulation of the above equation can be written in the form
(---485--42)
where
(---485----9) are called the Tikhonov filter factors Citation[9].
(---485----10) are typically close to 1 for large ρi,l and much smaller than 1 for the small ρi,l. In this way, the contributions to the regularized solution corresponding to the smaller ρi,l are effectively filtered out.
The L-curve criterion is employed to choose the regularization parameter αl in this study. The L-curve is a graph for all valid regularization parameters αl of penalty norm (---485----11) versus residual norm
(---485----12) . The name “L-curve” for this plot was introduced in Citation[10,Citation20], wherein and the properties of the L-curve were studied in detail. It turns out that the L-curve, when plotted in log–log scale, generally has a characteristic L-shaped feature (hence its name) with a distinct corner separating the vertical and the horizontal parts of the curve. The key point in the L-curve criterion for choosing αl is to define the L-curve's corner in a suitable mathematic way and to use this as the criterion for choosing αl. Many details can be found in Hansen's book Citation[21].
7. Numerical experimentation
We present numerical experiments in this section. And our aim is to provide a detailed verification of the accuracy and stability of the current methodology via a representative and straightforward example, rather than to consider applications to some complicated and large-scale engineering structures. Consequently, our mind is focused on the square Kirchhoff plate (of edge a) with its four edges fixed.
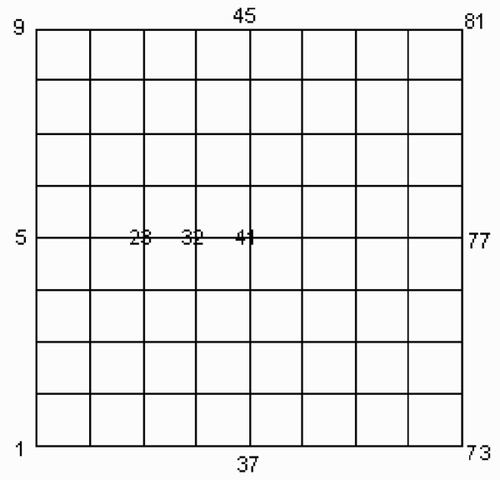
The region of the square plate is initially divided into 64 FEM rectangular elements (see ). shows the refined mesh (16 × 16) division of the whole plate region. The numbering scheme of the elements and nodes is from down to up and from left to right.
Figure 2. Initial FEM mesh division (8 × 8) of the whole plate region.
The dynamic load distribution is defined by
(---485--43)
where
(---485--44)
(---485--45)
where
(---485----13) denotes the time period.
illustrates the exact time histories of dynamic load on the 9, 77, 111, 145 nodal points of the square plate with the (16 × 16) FEM division mesh. The vertical axis in represents nondimensional load on one certain nodal point and fmax denotes the maximum value of the dynamic load during its time histories on the nodal point 145, while the horizontal axis represents a nondimensional time (---485----14) (=4). shows the model of the square Kirchhoff plate with all its edges clamped subjected to a transverse load. The time histories of bending strain values on the 9, 77, 111, 145 nodal points are illustrated in . The calculated strain distributions on the plate at time 3/8T is shown in .
The strain values on every nodal point calculated by the Rayleigh–Ritz method described in section 3, are employed as additional information in this study. If 8 × 8 FEM mesh division of the plate region is implemented, there are in total 243 pieces of additional information to be used. The artificial white noise will be added to the strains for examining the stability of the determined solutions. The way we add white noise is shown as: if εmax denotes the maximum value of all the additional information in time histories, we have
(---485--46)
(---485--47)
where η is a parameter that measures the white noise level; random and norm are MatLab functions used to generate a random vector or matrix and the norm of a vector respectively. So random(243, 1) in Equationequation (46)
(---485--46) represents a random vector containing 243 elements, which correspond to the strain vector containing 243 strain values. If the white noise vector generated in Equationequation (47)
(---485--47) is added to the pure strain vector, the added noise level is η%.
If the 8 × 8 FEM mesh division of the plate region is implemented, the time histories of dynamic load on the 5, 23, 32, 41 nodal points, which are derived directly from the matrix inverse in Equationequation (27)(---485--27) (in ). After careful calculation, we find that the condition numbers of the series of matrices J in discrete frequency domain vary from 1016 to 1019. It can be clearly seen from that the solutions derived directly become very unstable. illustrates the solutions with only 0.001% white noise added, which vibrate drastically compared with the pure solutions shown in .
The regularized time histories of dynamic load on the 5, 23, 32, 41 nodal points are shown in . Here we use the Tikhonov regularization and the L-curve method. And we exploit some subroutines of Hansen's Regularization tools package Citation[22] in the process of calculation. The pure solutions without any artificial noise are shown in subplot (a). And subplots (b)–(d) illustrate the solutions with noise level varying from 1 to 3% respectively. It can be seen clearly that the random noise added to solutions is under control effectively. In comparison with the instability of the solutions shown in , the powerful anti-noise property of the current solutions confirms the validity of the regularization methodology described, in detail, in section 6.
Traditional Tikhonov method, as we all know, is only suitable for middle or small-scale ill-posed problems Citation[23,Citation24]. In the above numerical experiments, the transfer matrix J was handled a 243 × 243 rank-deficient matrix (FEM mesh: (8 × 8)) and the results are satisfactory. The rank of J will increase if the FEM mesh are refined. We can see clearly the change in stability of the regularized solutions at the same two points when FEM meshes are refined gradually as shown in . To all the regularized solutions 3% white noise are added. As shown in , the solutions tend to be quite instable when the 10 × 10 FEM mesh division is implemented. Therefore, it is necessary to devise ways to apply the current inverse methodology to large-scale ill-posed problems in practice.
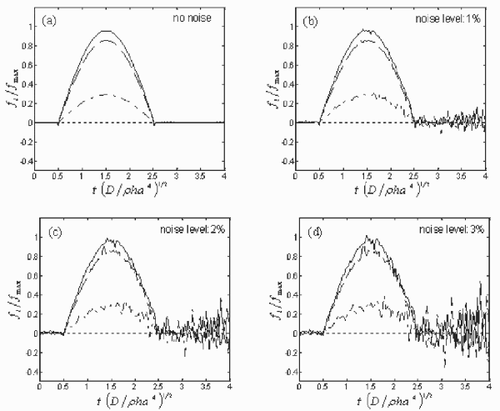
It is expensive to utilize the present inverse technique to identify the dynamic load applied to complex and large-scale structures; furthermore, the regularized solutions may become instable. However, we could divide the complex structure into small parts available for effective analysis. The solutions at the boundary points between two substructures are superposed and solutions at the inner points of each part remain unchanged as all the parts are combined into a unit. We still take the square Kirchhoff plate as an example for explanation. shows the refined FEM mesh division (16 × 16) of the plate region. If the plate is divided into four substructures of the same size (see ), the FEM mesh division of each part will be 8 × 8. The solutions of four substructures are completely symmetrical so that we only solve the same problem at any one substructure using the present inverse methodology, which saves much computing time and computer resources. After separate parts combination, we derive the regularized time histories of dynamic load on the 9, 77, 111, 145 nodal points (see ) shown in . Although different FEM mesh divisions of the plate region are shown in and , node 5, 23, 32, 41 and node 9, 77, 111, 145 are in fact exactly the same series of points. Therefore we can compare the solutions shown in and respectively. It is evident that the anti-noise property of the solutions with 16 × 16 mesh is very close to that with 8 × 8 mesh, which demonstrates the reliability and validity of the inverse methodology discussed in this study.
Figure 3. The square plate divided by the same four substructures.
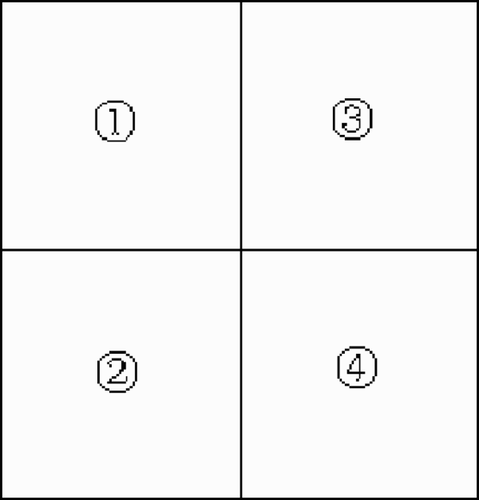
Figure 4. Refined FEM mesh division (16 × 16) of the whole plate region.
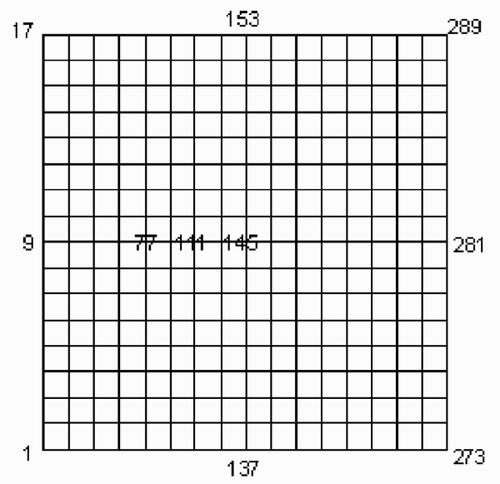
Figure 5. The exact time histories of the dynamic load on the 9, 77, 111, 145 nodal points (see ), which are represented by the dotted line (···), dash–dot line (– -), dashed line (— —) and solid line (—) respectively.
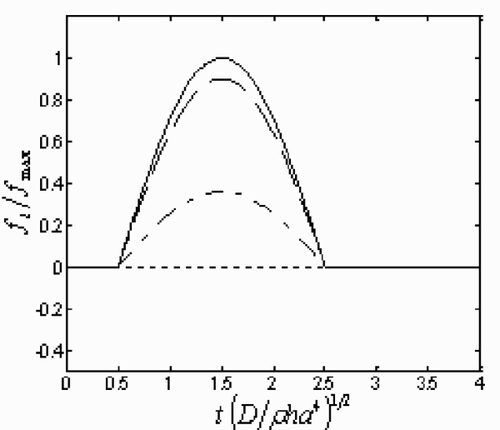
Figure 6. The time histories of the strains on the 9, 77, 111, 145 nodal points, which are represented by the dotted line (···), dash–dot line (– -), dashed line (— —) and solid line (—) respectively.
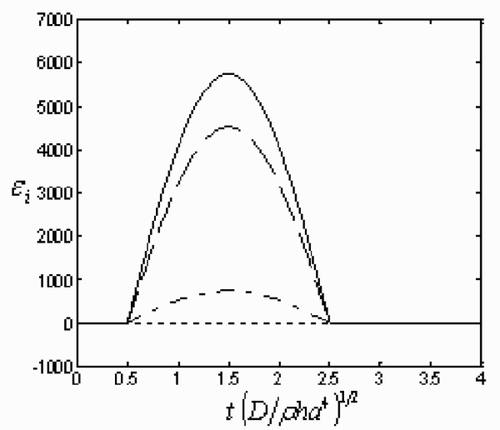
Figure 7. A square Kirchhoff plate with all its edges clamped subjected to a transverse load.
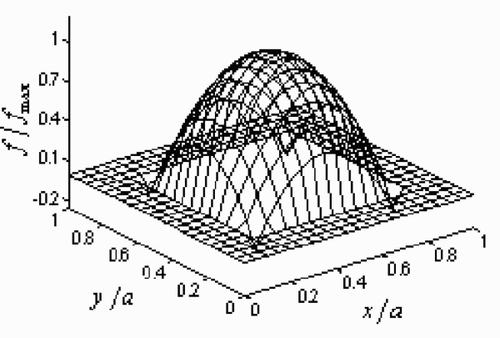
Figure 8. The strain distributions on the plate implemented as the additional information.
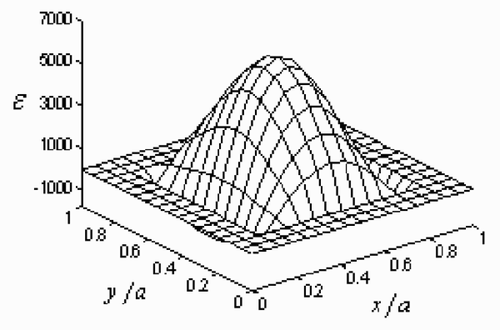
Figure 9. The directly derived time histories of dynamic load on the 5, 23, 32, 41 nodal points (see ), which are represented by dotted line (…), dash–dot line (—-), dashed line (— —) and solid line (—) respectively on the plot. Here FEM mesh division of the plate region is 8 × 8. The noise levels are: (a) 0%; (b) 0.001%.
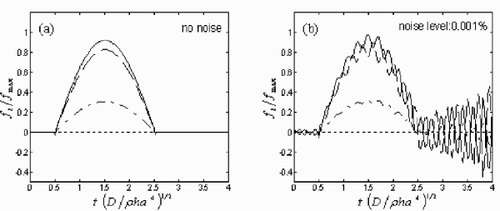
Figure 10. The regularized time histories of dynamic load on the 5, 23, 32, 41 nodal points (see ), which are represented by the dotted line (···), dash–dot line (– -), dashed line (— —) and solid line (—) respectively on the plot. Here FEM mesh division of the plate region is 8 × 8. The noise levels are: (a) 0%, (b) 1%, (c) 2% and (d) 3%.
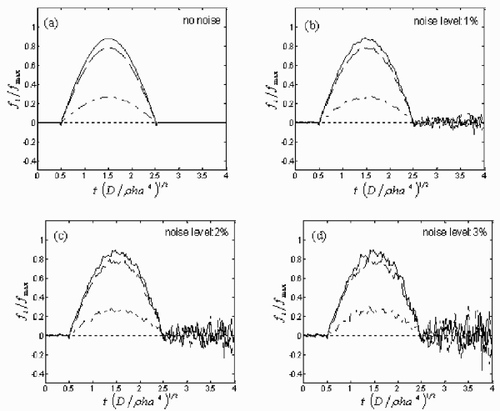
Figure 11. The regularized time histories of dynamic load at the left bottom end point P and the center point Q of the plate (shown in subplot (a)), which are represented by the dotted line (…) and solid line (—) respectively. FEM mesh divisions are: (b) 6 × 6; (c) 8 × 8; (d) 10 × 10.
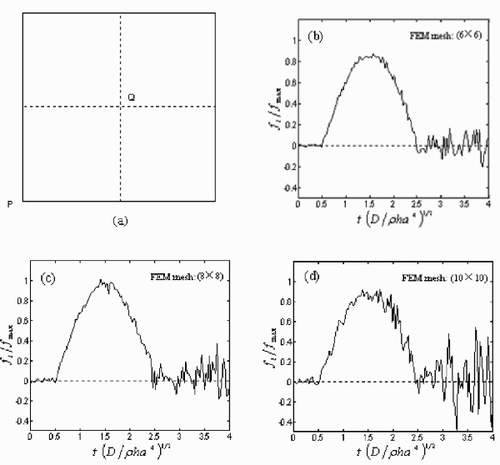
Figure 12. The regularized time histories of dynamic load on the 9, 77, 111, 145 nodal points (see ), which are represented by the dotted line (···), dash–dot line (—-), dashed line (— —) and solid line (—) respectively on the plot. Here FEM mesh division of the plate region is 16 × 16. The noise levels are: (a) 0%; (b) 1%; (c) 2%; (d) 3%.
It is well known that Laplace transformation parameter p is a complex number in general so that we suppose p = γ + iω where γ is a positive constant and i is the imaginary unit. Parameter γ should be different as numerical inverse Laplace transformation is applied to different functions and how to choose a suitable γ influences directly on accuracy of numerical results. Inoue et al. Citation[14] analyzed the effects of γ in the procedures of numerical inverse Laplace transformation applied to sinusoidal function and step function respectively. But there are no theories for determining γ in a general circumstance hitherto.
If h(t) in Equationequation (45)(---485--45) is chosen as the time history function of dynamic load distribution, H(g235
p), the Laplace transformation function of h(t) can be written as
(---485--48)
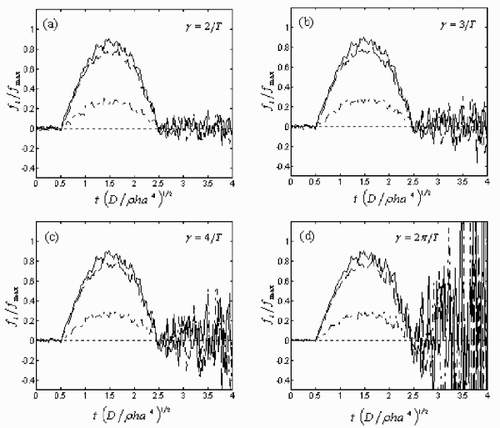
illustrates the different solutions at certain points with 8 × 8 FEM mesh and 3% noise level, where the parameter γ is selected as 2/T, 3/T, 4/T, 2Π/T respectively. The larger γ is, the more instable the solutions tend to be. When γ exceeds 4/T, the solutions are abberrant. On the other hand, we find that there is a distinct gap between the regularized solutions and the exact solutions when γ = 2/T, although the former seems more stable on the surface. When γ = 3/T, we find the derived solutions will agree better with the exact solutions. Therefore γ = 3/T is the optimal choice, which is carried out throughout the whole numerical experimentation in this section.
Figure 13. The regularized time histories of dynamic load on the 5, 23, 32, 41 nodal points (see ), which are represented by the dotted line (···), dash–dot line (—-), dashed line (— —) and solid line (—) respectively on the plot. γ, the real part of Laplace parameter p, is appointed as: (a) 2/T; (b) 3/T; (c) 4/T; (d) 2Π/T. The white noise level is 3%.
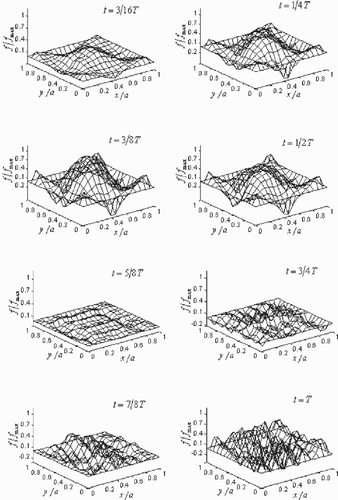
illustrates the exact dynamic load distributions applied to the square Kirchhoff plate at time 3/16T, 1/4T, 3/8T, 1/2T, 5/8T, 3/4T, 7/8T, T. The load distributions reaches its maximum at time 3/8T and remains zero at the last four times. shows the determined dynamic load distributions at the same eight times, which are regularized by the Tikhonov and L-curve methods and without any noise added. It is clear that the regularized solutions come close to the exact ones at any time in general. Besides, there is just a bit of undulation at time 5/8T and near the boundaries at the first four times, which has little influence on the principal satisfactory properties of the regularized solutions. The regularized load distributions added with 3% white noise at the same eight times are shown in . The noised solutions vary unnoticed at the first four times compared with the corresponding results shown in ; however, the last four subplots could not remain planes any more. The determined load distributions incline to fluctuate more and more orderlessly from time 5/8T to T. Even so, the amplitude of the fluctuation is finite and controlled within a certain range. And that proves again the availability and powerfulness of the present inverse methodology that can be utilized to determine the dynamic load applied to general engineering structures.
Figure 14. The exact dynamic load distributions applied to the square Kirchhoff plate at eight different times.
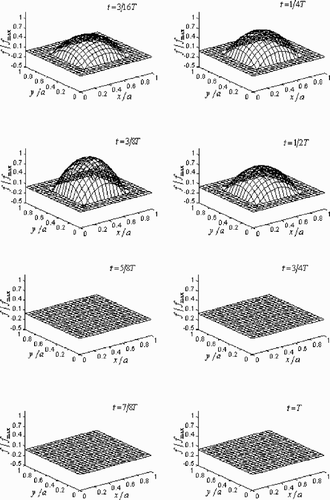
Figure 15. The regularized dynamic load distributions applied to the square Kirchhoff plate at eight times without noise added.
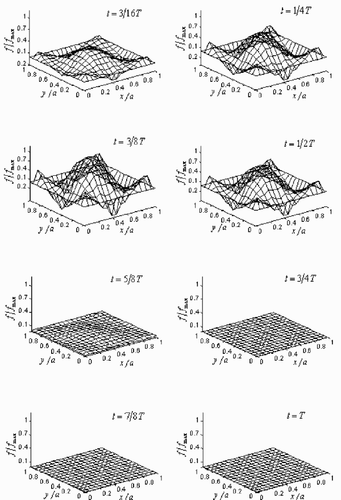
Figure 16. The regularized dynamic load distributions applied to the square Kirchhoff plate at eight times with 3% white noise.
8. Conclusions
In the present study, we bring forward an inverse technique for determining the dynamic load applied to Kirchhoff plates. For convenience the initial continuous problem in space and time domains is discretized in the matrix form by FEM and numerical Laplace transformation respectively. We find the transfer function, connecting input information with output load, an ill-conditioned matrix if strains are selected as known additional information. The famous Tikhonov regularization and L-curve method are exploited to solve this ill-posed problem in discrete frequency domain. The time histories of the regularized load distribution are achieved through numerical inverse Laplace transformation based on FFT algorithm. Numerical experiments show the accuracy and stability of the regularized solutions. Furthermore, the numerical results also indicate that the present inverse methodology is applicable for not only simple structures like Kirchhoff plates discussed in this study but also general engineering structures, which greatly extends the utility range of the current method.
Additional information
Notes on contributors
C. M. Ma *
Email: [email protected]
Notes
Email: [email protected]
- Wilbeck, JS, and Rand, JL, 1981. The development of a substitute bird model, ASME Journal of Engineering Power 103 (1981), pp. 725–730.
- Doyle, JF, 1987. Determining the contact force during the transverse impact of plates, Experimental Mechanics 27 (1) (1987), pp. 68–72.
- Chang, C, and Sun, CT, 1989. Determining transverse impact force on a composite laminate by signal deconvolution, Experimental Mechanics 29 (4) (1989), pp. 414–419.
- Inoue, H, Ishida, H, Kishimoto, K, and Shibuya, T, 1991. Measurement of impact load by using an inverse analysis technique, JSME International Journal of Series I 34 (4) (1991), pp. 453–458.
- Arai, M, Nishida, T, and Adachi, T, 2000. "Identification of dynamic pressure distribution applied to the elastic thin plate". In: Inverse Problems in Engineering Mechanics II. Nagano, Japan. 2000. p. pp. 129–138, In: M. Tanaka and G.S. Dulikravich (Eds).
- Krings, W, and Waller, H, 1979. Contribution of the numerical treatment of partial differential equations with the Laplace transformation (An application of the algorithm of the fast Fourier transformation), International Journal on Numerical Mechanical Engineering 14 (1979), pp. 1183–1196.
- Inoue, H, Kishimoto, K, Shibuya, T, and Kozumi, T, 1992. Estimation of impact load by inverse analysis (Optimal transfer function for inverse analysis), JSME International Journal of Series I 35 (4) (1992), pp. 420–427.
- Wu, E, Tsai, TD, and Yen, CS, 1995. Two methods for determining impact-force history on elastic plates, Exposition in Mechanics 35 (1) (1995), pp. 11–18.
- Kirsch, A, 1996. An Introduction to the Mathematical Theory of Inverse Problems. New York. 1996.
- Hansen, PC, and O'Leary, DP, 1993. The use of the L-curve in the regularization of discrete ill-posed problems, SIAM Journal of Scientific Computing 14 (1993), pp. 1487–1503.
- Leissa, AW, 1969. Vibration of Plates (NASA SP-160). U.S.. 1969.
- Leissa, AW, 1973. The free vibration of rectangular plates, Journal of Sound and Vibration 31 (1973), pp. 257–293.
- Hu, HC, 1982. Variational Principles and its Applications in Elastic Mechanics. Beijing, China. 1982.
- Inoue, H, Kamibayashi, M, Kishmoto, K, Shibuya, T, and Koizumi, T, 1992. Numerical Laplace transformation and inversion using fast Fourier transformation, JSME International Journal of Series I 35 (3) (1992), pp. 319–324.
- Wilcox, DJ, 1978. Numerical Laplace transformation and inversion, International Journal of Electro Engineering Education 15 (1978), pp. 247–265.
- Phillips, DL, 1962. A technique for the numerical solution of certain integral equations of the first kind, Journal of Association Computational Mechanics 9 (1962), pp. 84–97.
- Tikhonov, AN, 1963. Solution of incorrectly formulated problems and the regularization method, Soviet Mathematics Doklady 4 (1963), pp. 1035–1038.
- Varah, JM, 1979. A practical examination of some numerical methods for linear discrete ill-posed problems, SIAM Review 21 (1979), pp. 100–111.
- Linz, P, 1994. A new numerical method for ill-posed problems, Inverse Problems 10 (1994), pp. L1–L6.
- Hansen, PC, 1992. Analysis of discrete ill-posed problems by means of the L-curve, SIAM Review 34 (1992), pp. 561–580.
- Hansen, PC, 1998. Rank-Deficient and Discrete Ill-posed Problems. Philadelphia. 1998.
- Hansen, PC, 1994. Regularization tools: a Matlab package for analysis and solution of discrete ill-posed problems, Numerical Algorithms 6 (1994), pp. 1–35.
- Kilmer, ME, and O'Leary, DP, 2001. Choosing regularization parameters in iterative methods for ill-posed problems, SIAM Journal of Matrix Analysis Applications 22 (4) (2001), pp. 1204–1221.
- Hanke, M, and Hansen, PC, 1993. Regularization methods for large-scale problems, Surveys in Mathematics in Industry 3 (1993), pp. 253–315.