Abstract
In this study, the distribution strategies (DS) in evolutionary computations and their application to the inverse airfoil design problems have been introduced. Distribution strategies are based on the decomposition of the genetic operations for both upper and lower surfaces of the airfoil. We developed new strategies and combined these with a real coded genetic algorithm to obtain a faster and more robust method. We applied this new powerful method to the inverse airfoil design problems for inviscid, incompressible, and transonic flow conditions. The performance of this new method is compared with ones that were offered by classical or more commonly used genetic algorithms seen in the literature. That the number of computational fluid dynamics calculations decreased considerably, as much as 75%, shows the effectiveness of our new method.
1. Introduction
Recently, genetic algorithms (GAs) became more widely used, from the traditional and cutting-edge optimization problems in engineering and operation research, to non-traditional areas such as drug design, financial prediction, data mining, poetry, and music. Today, contributions from many scientists, researchers, and practitioners result in ably advancing the state of genetic and evolutionary algorithms (GEAs) and their application across a broad front Citation[1]. Using GAs in the optimization problems for aerodynamic shape has become a standard method due to the GA's robustness and the fact that it minimizes the more complex functions like non-convex, high multimodal, nonlinear, etc., and finds solutions very close to the global optimum. As GAs gain increasing favor and popularity in industrial environments, a wide range of design applications in aerodynamic shape optimization has been produced Citation[2–Citation9]. Despite their robustness and widespread applications, the main disadvantage of GAs are their substantial lack of computational efficiency Citation[4,Citation8,Citation10,Citation11]. That is, GAs are very time-consuming in aerodynamic shape optimization. In general, the number of function evaluations required by GAs exceeds the number required by a finite-difference-based gradient optimization Citation[8,Citation10,Citation12]. For that reason, a great effort is made by scientists to accelerate GA-based optimization methods. Various solutions to accelerate and improve the performance of GAs is suggested by Giannakoglou Citation[13] as in the following:
| 1. | (I) The use of improved genetic operators. | ||||
| 2. | (II) The use of multiprocessing. | ||||
| 3. | (III) Reduction of the number of exact evaluations, i.e., the reduction of the number of calls to the costly direct solver (for example, using an artificial neural network for a certain number of evaluations). | ||||
| 4. | (IV) Hybridization of GAs with a numerical optimization method. | ||||
In this work, we focus on the first type of solution. We use the distribution strategies (DS) concept suggested in Citation[19] as a new concept for the aerodynamic shape optimization with genetic algorithm. Also, we utilize the vibrational genetic algorithm (VGA) from our previous work Citation[15,Citation16] combining it with the DS concept. In the following sections, we explain the DS.
We show the application of our method to the inverse airfoil design problem and note its effectiveness. In the inverse design procedure, a vortex panel solver was used for an inviscid or incompressible case, and a full potential solver was used for a transonic flow case.
2. The distribution strategies
In the inverse airfoil design work using GA, a selection operation is performed according to the fitness values of airfoils (individual). During the genetic process, when one of two (upper or lower) surfaces of an airfoil in the population fits the target and the other surface does not, then this airfoil likely has a lower fitness value due to the unfitting surface, and it is probably eliminated through the selection phase. After elimination, the fitting surface of the airfoil will be useless for the genetic process. For that reason, obtaining fitting airfoils is delayed, the inverse design process becomes longer, and the number of Computational Fluid Dynamics (CFD) calculations increases. However, if the fitness values of upper and lower surfaces of an airfoil can be calculated separately, then the selection operation could be performed distinctly, and the fitting surfaces could be determined one by one. Thus, a fitting airfoil could be obtained earlier, the design process would become shorter, and the number of CFD calculations would decrease. The DS is proposed for this goal.
The DS concept is suggested as “The Distribution of Objective Function” and “The Distribution of Elitism” concepts. The essence of the concept is to divide the chromosome of each individual into a certain number of gene groups and to calculate the fitness value for each gene group separately. In this concept, besides carrying distinct calculations throughout the genetic processes, elitism can also be implemented distinctly for the gene groups of the individuals.
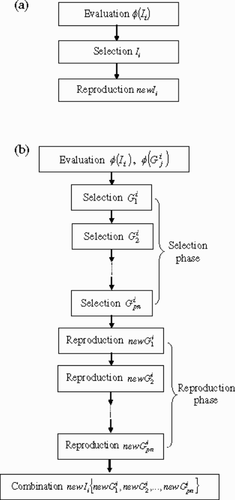
Let Ii be ith individual (chromosome) in the population, which is defined as (---563----1) , where
(---563----2) are the genes and gn is the total gene number. When we use a regular GA, as shown in , we evaluate the objective function of Ii (J(Ii)) to get the fitness value (ϕ(Ii)). The fitness value is usually a function of the objective function. For example, it is the inverse of the objective function (ϕ(Ii) = 1/J(Ii)) for the airfoil design problem. We select fitting individuals in the population according to their fitness values, and then we reproduce a new individual (newIi). The best individual in the population, Ibest, passes through the next generation as a result of elitism.
Figure 1. (a) Regular GA. (b) Distribution strategies.
2.1. The distribution of the objective function
In the DS concept, Ii consists of a combination of gene groups such as (---563----3) , where
(---563----4) are the gene groups and pn is the total number of gene groups. Gene groups,
(---563----5) , consist of genes (
(---563----6) ), which construct Ii in the regular GA. Each gene group of Ii, (
(---563----7) ), must have a different part of
(---563----8) .
If we use the DS concept, as shown in , both the objective function of an individual, J(Ii), and the objective function of gene groups, (---563----9) , are evaluated. In this case, the fitness values of the gene groups are obtained by using the objective function values of gene groups,
(---563----10) . (For the inverse airfoil design problem
(---563----11) .) To implement the DS concept successfully, the objective function can be distributed along the gene groups. That is, we must be able to evaluate
(---563----12) exactly or approximately. We show how
(---563----13) is evaluated for a test function in section 4, and for the inverse airfoil design problem in section 6.
The entire fitness values of the individuals (ϕ(Ii)) are used only to determine the best individual (Ibest) in the population. However, the selection phase of the genetic process is carried out by using the fitness values of the genes groups ((---563----14) ). In this case, at each step of the genetic process, the selection operation must be performed sequentially for each gene group of the individuals. In other words, in the beginning, the selection operation is performed for the first parts (
(---563----15) ) of the individuals. After that, the selection operation is performed for the second parts (
(---563----16) ), and the selection phase of the genetic process continues until the selection operation of the last parts (
(---563----17) ) is finished. The reproduction operations are carried out separately, the same as the selection phase, by using the selected gene groups. At first, we perform the reproduction operation for the selected first parts of the individuals and we obtain new
(---563----18) . Next, the reproduction operation is made for the second selected parts to get new
(---563----19) . The reproduction phase ends when new
(---563----20) are obtained. But this time, these new gene groups must be combined to construct new individuals, new
(---563----21) .
2.2. The distribution of elitism
In the regular GA, elitism is applied to the best individual (Ibest) in the population. When we use the DS, we can also apply elitism to the best gene groups, since their fitness values are evaluated. The best one in the first parts ((---563----22) ), in the second parts (
(---563----23) ), and so on, of the individuals can be chosen according to their fitness values. In addition to the best individual in the population, elitism is applied to these best parts, which may construct a more fitting individual,
(---563----24) . This individual, Ibest2, which consists of the best gene groups, will be passed through the next generation as a result of the distribution of elitism.
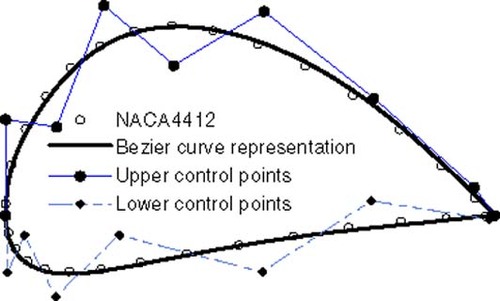
Another important issue is that the decomposition of the gene groups depends on the problem in hand and the airfoil coding technique. For the effective use of the DS concept in airfoil design, the chromosomes representing the airfoil are separated into the upper and the lower sections. We chose to use the Bezier curve method to represent the airfoil so that the control points of the upper and the lower surface will be two groups of chromosomes. We explain the application of the DS to the inverse airfoil design in section 6.
2.3. Aerodynamical interpretation of the concept
The pressure on any point on the airfoil depends on the entire geometry of the wing. If so, at that point a question arises: Does independent consideration of an airfoil's upper and lower surfaces result in erroneous calculations? In other words, is the DS successfully applicable to the inverse airfoil design problem?
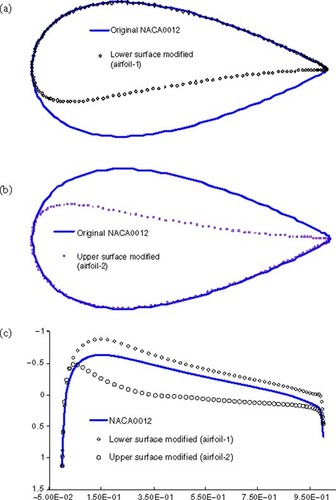
To find the answer to this question, the airfoil NACA0012 is considered in the flow condition of zero angle of attack at Mach 0.7. We use full potential flow solution for this case. The lower section of NACA0012 is changed to NACA4412 lower section (airfoil-1) to obtain a new pressure distribution for the upper section. Similarly the upper section of NACA0012 is changed to NACA4412 lower section symmetrically (airfoil-2) and then again the pressure distribution for the upper section is obtained. The modified airfoils and their pressure coefficient distributions for the upper sections are shown in .
Figure 2. (a) NACA0012 and lower surface modified airfoil (airfoil-1). (b) NACA0012 and upper surface modified airfoil (airfoil-2). (c) Upper surface Cp distribution for NACA 0012 and modified airfoils.
While changing the upper and lower sections of NACA0012, the pressure coefficient distributions on the upper surfaces of the modified airfoils are compared to the original NACA0012 upper sections’ pressure coefficient distributions, and error values are calculated along the surface coordinate, s, as follows:
(---563--1)
where Cpm and Cpo are the upper section pressure coefficient values of the modified and the original (NACA0012) airfoil respectively. If we assume that Cpo is the target, this error definition will be our objective function for the GA process.
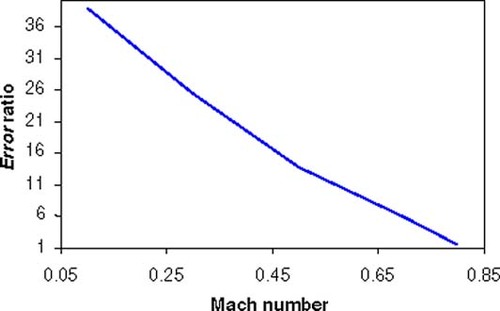
By these definitions, the error result from airfoil-1 is named Error1 and similarly the error result from airfoil-2 is named Error2. Comparison of these two errors (Error2/Error1) can be defined as the error ratio (ER). This ratio is 5.9 for Mach 0.7. The value of ER indicates how much the surface geometry itself has dominancy. On the other hand, for the GA process, ER will also be the fitness values ratio of both upper sections of the modified airfoils. (The fitness value will be defined as the inverse of the objective function; see section 5 and 6). That is, the upper portion of airfoil-1 has a higher probability of selection (about 5.9 times more) than the upper portion of airfoil-2. As clearly seen from , the upper portion of airfoil-1 is exactly the same as the original one, but the upper portion of airfoil-2 is not. However, if we do not use the DS concept, the exactly fitting upper portion of airfoil-1 and the non-fitting one of airfoil-2 will have the same chance for selection, since the fitness values of airfoil-1 and airfoil-2 will be exactly the same.
Using airfoil-1 and airfoil-2, the ER value is evaluated as about 40 for Mach 0.1. However, this ratio is reduced to 1.5 for Mach 0.8, since for this Mach number compressibility effects have had dominancy on flow field, and a probable result is a weak shock wave. But still, in this case, the surface geometry itself has kept its dominance of at least 50% or more. This Mach number's dependent change is depicted in . As long as the Mach number is in subsonic regime, not too close to transonic regime, the result can be deduced that the pressure distribution on any surface of the profile depends, to a great percentage, on the surface itself. We can conclude from the results that the surfaces are independent in the view of the genetic process. Since the genetic process is based on probability of selection, the DS concept is still valid in the transonic regime, due to its ability of assuring good probability, although the ER gets smaller.
Figure 3. Variation of error ratio with respect to Mach number.
3. The vibrational genetic algorithm
The vibrational genetic algorithm (VGA) is a GA which uses the vibration concept. It is well defined in Citation[15,Citation16,Citation19]. By applying a vibrational mutation periodically to all individuals in a population, they are spread out over the design space. Therefore, it becomes possible to escape local optimums and thus to obtain a global optimum quickly. Previous works Citation[15,Citation16,Citation19] show that the VGA can be efficiently used for aerodynamic design. It can be concluded from these works that the most important advantages of the VGA are that it makes using a great mutation rate and small population size possible for the genetic process.
Vibrational mutation is used after the reproduction phase. It is applied periodically from the initial steps of the genetic process. A vibrational wave is introduced into the population just after the first period. Amplitude of this wave is random. For this operation, entire genes in all chromosomes are mutated, due to the vibrational wave, as follows:
(---563--2)
where
(---563----25) are the i control points (gene) of the m individual; gn is the chromosome length (total gene number of a chromosome); n is the total number of individuals in the population (population size); MA is the main amplitude; u is a random real number between [1, 0], and w1 is a user defined real number between [0, 2] which controls MA.
Implementation of the vibrational mutation starts from a certain gene position at the first chromosome, and continues throughout the genes at the same position in the other chromosomes. This process is applied to all the individuals in the population every IP period (generation) of the genetic process. The mutation rate Pm is equal to 1/IP where IP is an integer number. As the population evolves, to spread out the population in a narrower band, the main amplitude MA is changed during the genetic process as follows:
(---563--3)
where AF0 and AFk are average fitness values at the initial and current steps of the genetic process, respectively, and r is a real number.
4. An application to a test function
In order to demonstrate the effectiveness and accuracy brought about by the proposed methods, a highly multimodal and epistatic function of Griewank (---563----26) is chosen. The parameter xi is in the range −600.0 to 600.0. This function has its global minimum fGriewank = 0 at xi = 0, i = 1, … , 10.
For this trial, the chromosome used in the regular GA would have a structure indicated for ith chromosome, (---563----27) , where xj's are the genes which are used to evaluate fGriewank. Let ϕi be the fitness value of ith chromosome, which is defined as follows:
(---563---1)
However, by this definition the problem turns into a maximization problem.
By applying our proposed technique (DS), the chromosome Ii must be defined by using the combination of a gene group. Under the assumption of equally divided gene groups, the new definition of ith chromosome would be (---563----28) , where
(---563----29) and
(---563----30) are the new gene groups, and
(---563----31) and
(---563----32) . New fitness values for these new gene groups would have the following forms:
(---563---2)
and
(---563---3)
The GA process depending on these new gene groups continues separately as explained in section 2.
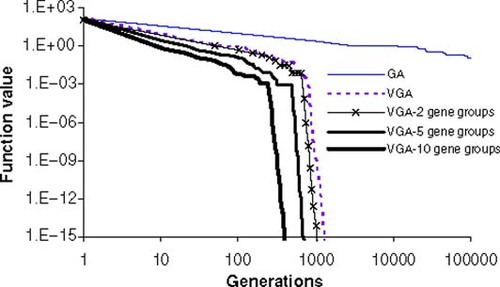
The function shown above will be tested with a regular GA, and VGA including DS. In DS application, gene groups will have the same size. We can obtain 2, 5 or 10 gene groups because the total number of genes in one chromosome is 10.
For the experiment, the following parameters and experimental conditions were used:
| 1. | (I) For regular GA: The crossover operator was BLX-α Citation[20] with α = 0.5. Mutation rate Pm = 0.01. The mutation method applied is the non-uniform mutation Citation[21]. | ||||
| 2. | (II) For VGA: The crossover operator was BLX-α with α = 0.5. Mutation rate Pm = 0.2, that is, IP = 5. | ||||
Population size was taken as 50. MA value in Equationequation (2)(---563--2) should be greater than 0.25 during the genetic process, due to the function's high multimodality. So, the value of r in Equationequation (3)
(---563--3) was taken as 0.1. This value of r has had a proper control on the decrement speed of MA. The crossover probability pc was 1. The selection procedure is Stochastic Universal Sampling (SUS) Citation[22]. Initial populations were distributed randomly in [−600.0, 600.0]. The results presented are the average values of each 10 different experiments.
The result in shows the convergence history with regular GA and the VGA including DS. As seen from , the number of function evaluation is drastically decreased by application of the VGA including DS. The function value reached 10−15 within 400 generations with 10 gene groups. On the other hand, DS implementation gives better results with smaller gene groups.
Figure 4. Test history for the Griewank function.
Application of the DS to this test function is straightforward. But implementation of the DS to any other engineering problem may not always be easy. Since the objective function of the problem may not be defined separately, decomposition of the chromosome cannot be possible. The following section will give the implementation of the DS to the inverse airfoil design. Using the DS concept in a different problem is a subject for another work.
5. The genetic algorithm operation for airfoil design
The surface pressure coefficient distribution, Cp, of the desired airfoil is given, and we start from a known airfoil such as NACA0012 to reach the desired airfoil. The objective function commonly used in the literature for this type of problem is the classical one which is given as follows:
(---563--4)
where Cps and Cpt are respectively the current and the target pressure coefficient distribution along the airfoil shape s at operation condition. The fitness function of a generated airfoil (individual) is proportional to the inverse of the objective function, i.e.,
(---563--5)
so the problem becomes a typical maximization problem and a fitness of infinite value would mean that the two Cp shapes are absolutely identical.
A very important issue is the representation of the geometry of the airfoil. For this problem we have used a Bezier curve representation, by means of which we defined a closed curve (the airfoil) with a set of (m + 1) control points. Its expression is given by the following equations:
(---563--6)
(---563--7)
where
(---563----33) and t is the parameter of the curve whose values vary uniformly between [0, 1]. The (xi, yi) are the coordinates of the control points which define the profile coordinates (x(t), y(t)). The two control points (0, 0) and (1, 0) at the leading and trailing edge are fixed. We consider the xi fixed, and the parameters coded in the genetic algorithm are only the yi coordinates of the control points. shows the Bezier curve representation of NACA4412.
Figure 5. Bezier curve representation of NACA4412 airfoil.
For one surface of the airfoil, in the incompressible test case 8th order (m = 8) representation with 9 control points will be used, and in the transonic test case 12th order (m = 12) representation with 13 control points will be used. Therefore, 14 and 22 parameters will be optimized for the incompressible and the transonic test cases, respectively.
6. Implementation of distribution strategies to airfoil design
To be clearer, for the Bezier curve representation of an airfoil, the following explorations are needed. As seen in , each surface of the airfoil is represented by its control points. Based on that decision, chromosomes which are used to represent the profile can be as follows:
(---563---4)
As seen from this representation, all the chromosomes representing the whole profile are decomposed as the top half (first gene group) and the bottom half (second gene group) so that the objective function and the fitness values will be calculated separately. Specifically, the objective functions for the upper and lower surfaces are these:
(---563--8)
(---563--9)
Similarly, the fitness values for the upper and lower surfaces are these:
(---563--10)
(---563--11)
When we use the DS concept, the genetic process works as explained in section 2. The chromosome (including top and bottom half) which has the greatest fitness value is carried into the next generation as a result of elitism. The best upper surface (the best one among the first gene groups) and the best lower surface (the best one among the second gene groups) construct an airfoil, which is carried into the next generation as a result of distribution of elitism.
7. Experiments
Experiments were performed for three different airfoils:
| 1. | (I) The surface pressure coefficient distribution, Cp, of NACA4412 airfoil at a 10° angle of attack is presented. The CFD method is the vortex panel technique for incompressible, inviscid flow, which is detailed in Citation[23]. We used 120 panels for CFD calculations. | ||||
| 2. | (II) The surface pressure coefficient distribution, Cp, of NACA64A410 airfoil at a 0° angle of attack and M = 0.75 is presented. A full potential solver, which is detailed in Citation[24], with 161 × 31 O-mesh was used for transonic, inviscid flow. | ||||
| 3. | (III) The surface pressure coefficient distribution, Cp, of RAE2822 airfoil at a 2° angle of attack and M = 0.725 is presented. A full potential solver with 161 × 31 O-mesh was used for transonic, inviscid flow. | ||||
Figure 6. Initial population.
The following strategies are used for genetic operations for the three cases above:
| 1. | (I) Strategy I: Crossover technique is BLX-α with α = 0.7 (the best value for this case), Pm = 0.015. VGA will not be used. Mutation is applied to randomly chosen ith gene in kth chromosome, which is selected randomly in the population, by using following formulas:
| ||||
| 2. | (II) Strategy II: Strategy I is used with DS concept. | ||||
| 3. | (III) Strategy III: VGA and DS concepts are used. Crossover technique is BLX-α with α = 0.7. | ||||
The selection method is SUS Citation[22]. In this experiment, for vibrational mutation, the value of r in Equationequation (3)(---563--3) was taken as 4. For the applications, 70,000 is good enough as the fitness value for the fast convergence. The results presented are the average value of each 10 different experiments. In the figures, the horizontal axis shows the number of CFD calculations, and the vertical axis gives the fitness values which correspond to each CFD calculation.
8. Results
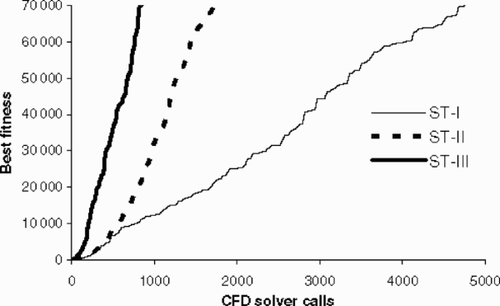
Case I: Strategy I and Strategy II (ST-I and ST-II) are applied for the population size n = 30. In the application of VGA, as we just did in our previous studies Citation[15,Citation16], a small population size and great mutation rate are more convenient. For ST-III application, the population size is n = 12. IP is chosen as 3 (Pm = 1/3) for the vibrational mutation. The value of w1 in Equationequation (2)(---563--2) is 2. (Users may choose 1 for w1 when they make an application. This time, using w1 = 2 gave a better result, but not much different from using w1 = 1). In the Bezier curve representation, for one of the surfaces, either top or bottom, 9 points are used. shows the comparison of the best fitness values for different strategies of Case I. The figure reveals that our proposed technique has a comparatively faster convergence than regular GA (ST-I).
Figure 7. Comparison of best fitness values for different strategies (Case I).
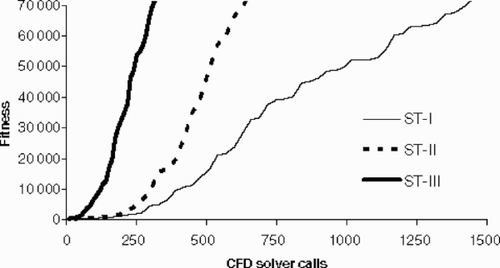
To obtain the target fitness value for regular GA (ST-I) 1440, regular GA including DS (ST-II) 630, and VGA including DS (ST-III), 312 CFD calculations are needed. Comparing these CFD calculations to the regular case indicates a 56% reduction for the case of ST-II and a 78% reduction for the case of ST-III.
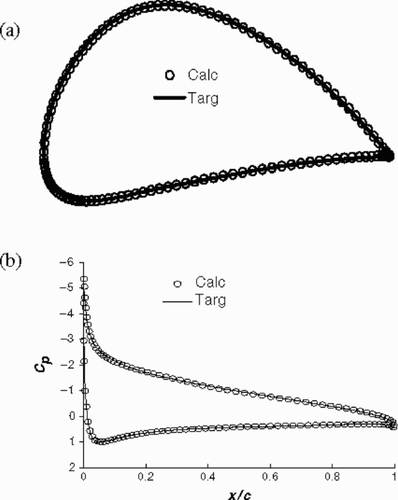
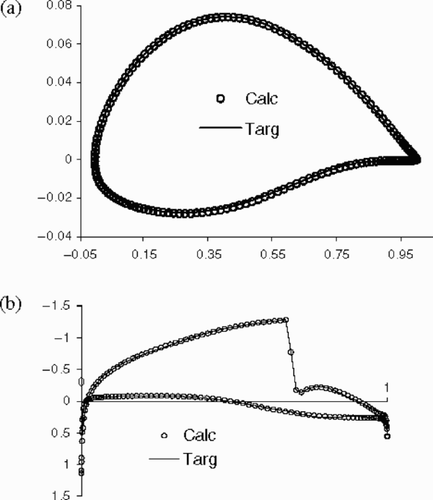
shows the target profile geometry and the one optimized by the inverse design. Similarly, gives the pressure coefficients for the related geometries. Both figures clearly show the excellence of the implemented method for the inverse airfoil design problem.
Figure 8. (a) Calculated and target airfoils (Case I). (b) Calculated and target Cp distributions (Case I).
Case II: In this case, while we apply ST-I and ST-II, the population size, n, is held at 30. However, during the application of ST-III, the population size, n, is taken as 14, and for the vibrational mutation, IP is taken as 4. The value of w1 in Equationequation (2)(---563--2) for the ST-III is kept as 2.
For the Bezier representation of airfoil surface, 13 control points were used, two of which were always constant. The differences between Case I and Case II result from the population size and number of control points which are chosen in transonic conditions.
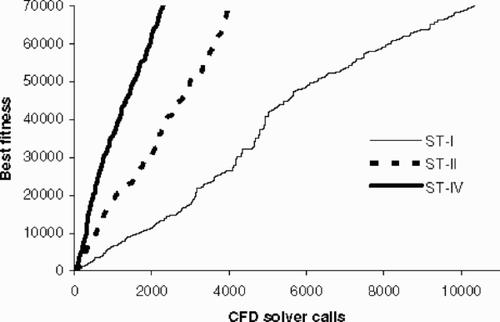
The transonic condition results for NACA64A410 are shown in . From this figure, one can say that the new strategies we applied gave better results than regular GA. To obtain target fitness values for ST-I 4740, ST-II 1710, and ST-III 854, CFD calculations are needed. Comparing these results with regular GA indicates that the gain in CFD calculations for ST-II and ST-III are 65 and 82%, respectively.
Figure 9. Comparison of best fitness values for different strategies (Case II).
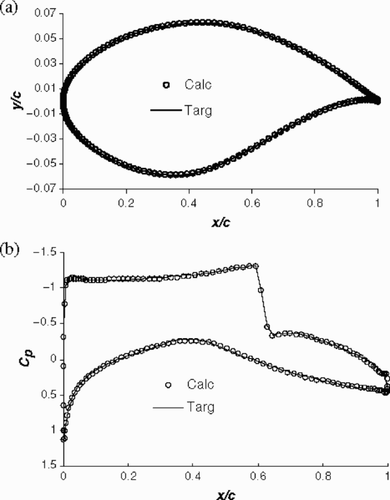
shows target profile geometry and the one optimized by the inverse design. Similarly, illustrates the pressure coefficients for the related geometries. Once again, these results are excellent from the point of view of computer time.
Figure 10. (a) Calculated and target airfoils (Case II). (b) Calculated and target Cp distributions (Case II).
Case III: In this trial, the size of the population n in which ST-I and ST-II were applied is 30. Similarly, for the application of ST-III, the population size, n, is taken as 14. In the vibrational mutation, IP is 4. In Equationequation (2)(---563--2) , w1 is taken as 0.5. The results obtained in transonic conditions for the profile RAE2822 are shown in .
Figure 11. Comparison of best fitness values for different strategies (Case III).
Similarly to Case II, to obtain target fitness value using ST-I, ST-II and ST-III, CFD calculations on the order of 10320, 4050, and 2282 are needed, respectively. Comparison of these results with regular GA indicates that the gain in CFD calculations for ST-II and ST-III are 61 and 78%, respectively.
In , the target profile, the profile optimized by inverse design, and their pressure coefficients are shown.
Figure 12. (a) Calculated and target airfoils (Case III). (b) Calculated and target Cp distributions (Case III).
9. Conclusion
The numerical experiments carried out in this study indicate that our proposed strategy, DS, has a great impact on the number of CFD calculations of the inverse airfoil design. This method is not only working for incompressible subsonic flow condition but transonic as well. For the inverse airfoil design, this method seems to be promising.
Inverse design by means of combined DS and VGA reduces the CFD calculation at least 75% more than a regular GA does. In many studies of inverse airfoil design problems, the time spent to achieve target design is almost all consumed by the CFD calculations. A small percentage of time is consumed by the genetic process applied. Therefore, a 75% reduction in CFD calculations means nearly a 75% reduction in total time for the inverse design problem. These combined techniques can be used with other techniques such as an artificial neural network and gradient based methods, as in Citation[4] and Citation[18].
Finally, our method presented here, the DS concept, results in a tremendous reduction in CFD calculations or CPU time. Usage of the DS concept in any other engineering problems is possible, but may be a subject for future works.
Acknowledgments
We wish to thank Professor Ülgen GÜLÇAT for his constructive comments on this work.
- Goldberg, DE, 1999. "Genetic and Evolutionary Algorithms in the Real World". 1999, Department of General Engineering, IlliGAL Report No. 99013 (www-illigal.ge.uiuc.edu), University of Illinois at Urbana-Champaign, March.
- Quagliarella, D, and Cioppa, AD, 1994. "Genetic Algorithms Applied to the Aerodynamic Design of Transonic Airfoils". 1994, AIAA-94-1896-CP.
- Cao, HV, and Bloom, GA, 1996. "Navier-Stokes/Genetic Optimization of Multi-Element Airfoils". 1996, AIAA 96-2487.
- Vicini, A, and Quagliarella, D, 1999. Airfoil and wing design through hybrid optimization strategies, AIAA Journal 37 (5) (1999), pp. 634–641.
- Obayashi, S, Yamaguchi, Y, and Nakamura, T, 1997. Multiobjective genetic algorithm for multidisciplinary design of transonic wing planform, Journal of Aircraft 34 (5) (1997), pp. 690–693.
- Falco, ID, Cioppa, AD, Balio, RD, and Tarantino, E, 1996. "Breeder genetic algorithms for airfoil design optimization". In: Proceedings of IEEE Int. Conf. on Evolutionary Computing. Nagoya, Japan. 1996. p. pp. 71–75.
- Oyama, A, 2000. "Wing design using evolutionary algorithms". In: PhD thesis, Department of Aeronautics and Space Engineering, Tohoku University. Japan. 2000.
- Holst, TL, and Pulliam, TH, 2001. "Aerodynamic Shape Optimization Using a Real-Encoded Genetic Algorithm". 2001, AIAA 2001-2473.
- Jones, BR, Crossly, WA, and Lyrintzis, AS, 2000. Aerodynamic and aeroacoustic optimization of airfoils via a parallel genetic algorithm, Journal of Aircraft 37 (6) (2000), pp. 1088–1098.
- Obayashi, S, and Tsukahara, T, 1997. Comparision of optimization algorithms for aerodynamic shape design, AIAA Journal 35 (1997), pp. 1413–1415.
- Quagliarella, D, and Vicini, A, 2000. "GAs for Aerodynamic Shape Design I: General Issues, Shape Parametrization Problems and Hybridization Techniques". In: GAs for Optimization in Aeronautics and Turbomachinery. 2000, von Karman Institute for Fluid Dynamics, Lecture Series 2000-07.
- Bock, KW, 1990. "Aerodynamic design by optimization". 1990, AGARD CP-463, Paper 20.
- Giannakoglou, KC, 2000. "Acceleration GAs Using ANN – Therotical Background". In: GAs for Optimization in Aeronautics and Turbomachinery. 2000, von Karman Institute for Fluid Dynamics, Lecture Series 2000-07.
- Falco, ID, Cioppa, AD, Lazzetta, A, and Tarantino, E, 1998. "Mijn mutation operator for airfoil design optimization". In: Soft Computing in Engineering Design and Manufacturing. London. 1998. p. pp. 211–220.
- Hacioğlu, A, and Özkol, İ., 2002. Vibrational genetic algorithm as a new concept in aerodynamic design, Aircraft Engineering and Aerospace Technology 74 (3) (2002), pp. 228–236.
- Hacioğlu, A, and Özkol, İ., 2003. Transonic airfoil design and optimisation by using vibrational genetic algorithm, Aircraft Engineering and Aerospace Technology 75 (4) (2003), pp. 350–357.
- Doorly, DJ, and Peiro, L, 1997. "Supervised parallel genetic algorithms in aerodynamic optimisation". 1997, AIAA 97-1852.
- Tse, DCM, and Chan, LYY, 1999. "Application of micro genetic algorithms and neural networks for airfoil design optimization". In: Aerodynamic Design and Optimisation of Flight Vehicles in a Concurrent Multi-Disciplinary Environment. 1999, RTO-MP-035.
- Hacioğlu, A, 2003. "Using genetic algorithm in aerodynamic design and optimization". In: PhD thesis, Department of Aeronautical Engineering, İstanbul Technical University. Turkey. 2003.
- Eshelman, LJ, and Schaffer, JD, 1993. "Real coded genetic algorithms and interval schemata". In: Foundations of Genetic Algorithms 2. San Mateo, CA. 1993. p. pp. 187–202.
- Wright, A, 1990. "Genetic algorithm for real parameter optimization". In: Foundations of Genetic Algorithm 1. San Mateo, CA. 1990. p. pp. 205–218.
- Baker, JE, 1987. "Reducing bias and inefficiency in the selection algorithm". In: Proceedings of the Second International Conference on Genetic Algorithms. San Francisco, CA. 1987. p. pp. 14–21.
- Kuethe, AM, and Chow, C-Y, 1998. Foundation of Aerodynamics. New York. 1998. p. pp. 161–163.
- Hacioğlu, A, 1997. "Interactive solution procedure for full potential and boundary layer equations". In: MSc thesis, Department of Aeronautical Engineering, Middle East Technical University. Turkey. 1997.