Abstract
In inverse problems, often there is no available analytical expression relating the physical quantities of interest and the available data. In these cases, one resorts to using a numerical model with a finite number of parameters, resulting in a discrete problem. Also, many discrete inverse problems involve a highly nonlinear mapping between the model parameters and the simulation of the data by the model. Algorithms exist for estimating the model parameters in nonlinear discrete inverse problems. However, one needs to investigate how these estimated models relate to the true structure of the studied system (i.e., the truth model). This is known as model appraisal and it is greatly affected by three sources of uncertainty: misleading search, non-uniqueness and errors. In this work, we aim at analysing the impact of the first two sources of uncertainty in model appraisal (misleading search and non-uniqueness) by characterising the parameter space of a highly nonlinear geophysical inverse problem. Our approach is to use an error-free synthetic data problem so that the truth model is known in advance and therefore the results can be compared against a known truth. The characterisation requires an exceptionally high quality sampling of the parameter space. A new Real-parameter Genetic Algorithm called Genetic Sampler (GS) is used for this purpose. The GS successfully characterises the parameter space by locating multiple unconnected optimal regions, including that of the truth model, in several instances of the inverse problem. It is argued that, given the characteristics of the parameter space, many search methods could misidentify a local optimum as the global optimum. Such a misleading search will, in this case, have terrible consequences, as all the local optima had no predictive value. Another important result is related to the issue of non-uniqueness. It seems that, for this model and in the absence of any error, there is a single global optimum, which constitutes a unique solution to this nonlinear inverse problem. Lastly, we investigated the effect of including more data in the inversion process. This resulted in the parameter space having fewer and less prominent locally optimal regions, which makes the search for the global optimum easier.
1. Introduction
In cases where the direct measurement of physical quantities is not possible, these might be inferred from a data set of indirect measurements. This is known as an inverse problem. Often, there is no available analytical expression relating the physical quantities of interest and the data. In these cases, one resorts to using a numerical model with a finite number of parameters, resulting in a discrete problem. This constitutes a parametrisation of the studied system, where an infinite number of unknowns (e.g., a given physical quantity defined in every location of the system) is reduced to a finite number (a set of model parameters). Also, many discrete inverse problems of great importance involve a highly nonlinear mapping between the model parameters and the simulation of the data by the model.
Geophysics is a rich source of nonlinear discrete inverse problems. Some examples are: the determination of static corrections in exploration seismics Citation1, the estimation of seismic velocity structure from high-frequency seismic wave forms Citation2 and the characterisation of petroleum reservoirs through the calibration of a numerical model Citation3. In the latter example, for instance, the location of petroleum reservoirs (thousands of metres below ground) and their extension (typically several kilometres) make direct measurement of the model parameters mostly impossible. Only few of these parameters can be estimated from measurements at wells drilled into the reservoir. In this context, indirect measurements usually take the form of fluid production data (e.g., the oil production rate at a given well) and thus the calibration is known as history matching. In addition, it has been argued elsewhere (e.g., Citation4) that the relationship between the reservoir model parameters and the production data is highly nonlinear.
Discrete inverse problems are often posed as a search and optimisation process by defining an objective function quantifying the mismatch between the measured data and their simulation by the assumed model. This function may also include additional terms such as a model regularisation term constraining the range of values that model variables can take. The choice of objective function is an important issue as it may directly influence the complexity of the search landscape. In problems where the model is linearly related to the (simulated) data, linearised inversion techniques have been successfully applied (for a summary see Citation5). These techniques incorporate a local optimiser (almost always a gradient method) for iteratively improving a single set of model parameters and thus returning a single best data-fit (i.e., best calibrated) model. Linearised techniques can be applied to linear and weakly nonlinear problems, but these are often inadequate when the nonlinearity becomes severe Citation6,Citation7, since they cannot handle the increasing complexity of the search landscape. As a consequence, they often fail to return an acceptable solution (e.g., Citation8). Indeed, the objective function landscape arising from a highly nonlinear inverse problem is usually multimodal (involving perhaps several unconnected optimal regions) and may be non-smooth as well as having discontinuities.
Unlike linearised techniques, Monte Carlo methods have a global perspective that make them suitable for searching a multimodal landscape. They are aimed at performing a wide exploration of the search space, with preference given to those models that fit the data relatively well. A characteristic feature of all these methods is that the output is an ensemble of calibrated models instead of a single best calibrated model. Also, Monte Carlo methods operate by carrying out a direct search, meaning that they only make use of objective function values to guide the search. Therefore, they do not rely on the function landscape being smooth in any sense. Monte Carlo methods are becoming increasingly important in the analysis of discrete nonlinear inverse problems Citation9. Among the most commonly used Monte Carlo methods, we have Markov Chain Monte Carlo (MCMC; Citation10), Simulated Annealing (SA; Citation11), Genetic Algorithms (GAs; Citation12) and Neighbourhood Algorithm (NA; Citation13). These methods have been successfully applied to a wide range of problems, providing important insights where linearised techniques have failed (e.g., Citation14). For a complete and very readable discussion about the suitability of Monte Carlo methods for tackling nonlinear inverse problems, see Citation6. An additional introductory text focusing on Monte Carlo methods applied to geophysical inverse problems is Citation15.
Independent of the Monte Carlo technique used to obtain the ensemble of calibrated models, one still needs to investigate how these calibrated models relate to the true structure of the studied system (henceforth referred to as the truth model or simply the truth). This is the model appraisal stage of the inverse problem, as defined by Snieder Citation16. The current practice is to use the sampling of the objective function provided by the ensemble to infer properties of the truth. There are a number of ensemble inference approaches in the literature (summaries can be found in Citation15 and Citation6). Many of these approaches are based on a probabilistic treatment of the inverse problem known as Bayesian inference. However, as pointed out by Sambridge and Mosegaard Citation6, any ensemble inference technique at best can only extract that information about the truth that exists in a given ensemble of models. Unfortunately, in a practical case, we can never be sure of how much of this information is contained in the ensemble. This uncertainty comes from three sources: misleading search, non-uniqueness and errors.
When tackling a real inverse problem, these three sources appear superposed, making it very difficult to analyse their individual contributions to the overall uncertainty. Therefore, we next analyse each source of uncertainty assuming no additional uncertainty coming from the remaining sources. In the absence of any errors and assuming that there is a unique solution, the truth model is by definition the global minimum of the objective function. Because of the multimodality, the search method may misidentify a local minimum as the global minimum Citation16. This misleading search has been identified Citation4,Citation6,Citation16 as a cause of obtaining biased results in ensemble inference. Furthermore, in the usual situation in which the location of the global minimum is not known, one cannot be certain that the search has not been misled. Therefore, a search method with a high probability of locating the globally optimal regions is needed.
A second source of uncertainty is that nonlinear inverse problems may be non-unique in the sense that the model cannot be uniquely determined by the data Citation6. This could be caused by a lack of enough information in the data or this information not being effectively exploited by the objective function. From an optimisation perspective and without considering errors, non-uniqueness manifests itself as a number of globally optimal regions (connected or unconnected) in the search landscape. By globally optimal regions, it is meant a region of the parameter space for which the objective value has a globally optimal value. If a globally optimal region is composed by a single point, then the definition of global optimum is recovered. Clearly, search methods capable of finding all optimal regions in the search landscape are needed. Although, even if all optimal regions could be identified, still there would be uncertainty as to which optimal region is associated with the truth. In practice, it is usually assumed that an inverse problem with more data points than model parameters is likely to result in a well-posed problem Citation17 (i.e., one with a unique solution). By contrast, it has been claimed (e.g., Citation16) that the solution of nonlinear inverse problems are inherently non-unique, even in those involving error-free data Citation18. Results in this work suggest that this does not seem to be always the case.
The last source of uncertainty is errors. Errors can be broadly classified into two categories: data and modelling errors. Data errors are inherent to the measurement process, whereas modelling errors are due to issues, such as inadequate physics, insufficient spatial and/or temporal resolution and inappropriate approximation of continuous equations by discrete analogues Citation19,Citation20. Data errors can be back-propagated into uncertainty in the model parameters through the Bayesian formulation of the inverse problem, providing the statistical character of these errors is known Citation6. By contrast, modelling errors are very difficult to quantify Citation6 and thus they have been mostly overlooked in the literature. Indeed, the model represents a finite parameterisation of the studied system and the quality of the inversion results will be inevitably dependent on the suitability of that choice Citation6. Modelling errors distort the objective function landscape with respect to the corresponding error-free case. In practice, we are uncertain about the extent of the distortion introduced by these errors on nonlinear inverse problems. In some cases, this distortion may cause the truth model not to be associated with a minimum (see Citation19,Citation21 for an example of this situation). Thus, regardless of the adopted search method, it is not clear how current ensemble inference approaches could carry out a reliable model appraisal under such circumstances. As concluded by Snieder Citation16, there is no general theory to deal with the model appraisal of highly nonlinear inverse problems, which constitutes a challenge of formidable proportions to the inverse problems community.
In this work, we aim at analysing the impact of the first two sources of model appraisal uncertainty (misleading search and non-uniqueness) in the context of a particular highly nonlinear inverse problem (the calibration of a petroleum reservoir model using fluid production data). We will use an error-free synthetic data instance of the problem so that the truth model is known in advance and therefore the results can be compared against a known truth. The analysis of the uncertainty introduced by errors on model appraisal is out of the scope of this article and it has been already the object of previous work Citation19,Citation21. Our analysis will address a number of issues that influence or are influenced by misleading search and non-uniqueness: How small is the basin of the global optimum associated with the truth in comparison with other optimal regions and with the whole parameter space? Are there several connected or unconnected optimal regions? Does a well calibrated model always provide a good forecasting for future data? Is this nonlinear inverse problem non-unique? What is the effect of adding more data in the inversion process? The study of these questions requires a sampling of the objective function landscape of exceptionally high quality. The search method needs to have the ability of overcoming local minima, so as to avoid misleading search. Moreover, the applied method is also required to have a high probability of locating all optimal regions of the parameter space, so that the question of non-uniqueness can be investigated. These requirements call for a method that preferentially samples the regions of the parameter space that fit the data well, rather than looking for a single optimal model. Mosegaard and Sambridge Citation9 identified GAs as a promising approach to sample the optimal regions of a parameter space, although these same authors pointed out that: ‘Attempts at constructing a sampling algorithm from the same principles as the genetic algorithm have failed so far, but if the problem can be solved, it will no doubt be a great step forward in many practical applications’. In this work, we will present and use a Real-parameter GA called Genetic Sampler (GS). This GA is a development of previously published studies Citation22–24 and has been developed to solve the type of problem described in this article, i.e., where we want to obtain a good sampling of the parameter space while identifying multiple optimal regions. The previous versions have been shown Citation24 to provide the best results in the literature for some highly multimodal test functions of various dimensionalities, which demonstrates its ability to overcome multimodality. On analytical test problems, GS is able to find simultaneously all global minima up to about 10 dimensions (the ensemble of a case with 7 dimensions was used in Citation25). We are not aware of any other search method that has shown this capability without using function information like the number, depth or width of minima. This is specially important when addressing inverse problems, since the structure of the objective function is largely unknown in the vast majority of the cases. Also, the robustness of this search and optimisation method will be demonstrated in a series of high quality sampling on analytical and real function landscapes. The detailed study of this algorithm is out of the scope of this article and it will be addressed in a future work Citation26.
We arrange the rest of the article as follows. In section 2 the forward problem, objective functions and an analogous test function are introduced. Section 3 describes the structure of the GS. The results of the experiments are discussed in section 4. Conclusions and future work are outlined in section 5.
2. An inverse problem from the petroleum industry
2.1. The forward problem
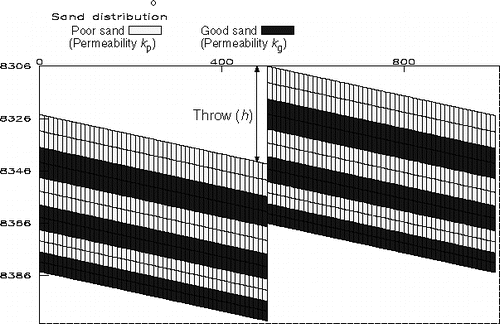
In this work we consider a cross-sectional model (IC Fault model) of a layered petroleum reservoir, as illustrated in . This is a problem involving fluid flow through complex porous media (i.e., rocks of different permeability). The geological model consists of six layers of alternating good and poor quality sand rocks (i.e., high and low permeability, respectively). Water is injected in a well at the left-hand edge and a producer well is located on the right-hand edge. Both wells are drilled through all layers and operate at fixed bottom hole pressures. There is also a fault mid way between the two wells. Three free parameters are considered: the fault throw (h), the permeability of the poor quality sand (kp) and that of the good quality sand (kg). The simulation is carried out on a mesh of 100× 12 grid blocks. A complete description of the model can be found in Citation27.
Figure 1. The IC Fault reservoir model.
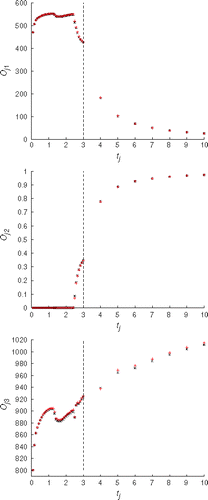
The reservoir performance is characterised by the way in which fluids (oil and water, in this model) are produced and injected. We consider three production series: Oil Production Rate, Water Production Rate (or Water Cut) and Water Injection Rate. In order to obtain these series, the reservoir model is input to a numerical flow simulator Citation28. These fluid rates are periodically recorded at 43 different times: first monthly for 36 months (3 years) and then annually for the next 7 years to simulate the observed ‘calibration’ data and the unknown ‘forecasted’ data, respectively. Typical measurements of these time series can be seen in .
2.2. Objective functions
In order to quantify the match between the model response and the measurements, we define first an objective function for the history matching (i.e., calibration) period, Δm, as follows
(------125799--1)
where Ns is the number of time steps and determines the extent of the history matching period, m=(h,kp,kg) is the considered model, Sjk(m) is its simulated response for the production series k at time step j, Ojk is the corresponding objective (‘measured’) value and σjk, data weights defined as an estimation of what would be the associated measurement error. We assume it as 6% of the measured value, i.e., σjk=0.06 Ojk.
Likewise, the objective function for the forecasting period, Δf, is
(------125799--2)
Since we are considering a synthetic reservoir, there are no real measurements. Consequently we generate the measurements Ojk as follows. First, ‘truth’ values for the three model parameters are chosen (h0=10.4 ft,
mD,
mD; the units are dropped henceforth). Thereafter, the response for the truth model is simulated to provide the measurements as
. Note that neither measurement errors are added to the production data, nor are modelling errors introduced. This is in line with the aims of this article and ensures that the truth model has a global optimum associated with it.
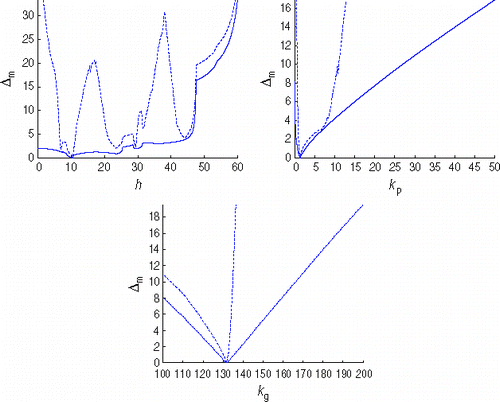
There is still an issue concerning the weighting factor σjk that needs to be addressed. The Water Production Rate is a series that takes zero values for the first 29 months of production (see ). Thus, an offset ε need to be added, i.e., σj2 =0.06 (Oj2+ε), to avoid dividing by zero in (1) and (2). Two offsets were considered: ε1=1.0 and ε3=0.001. For each offset, we set Ns=36 and carried out a line plot of Δm against h, kp and kg. For each line plot, we fixed two of the variables at their truth values. For instance, in the line plot of Δm against h, we fixed kp=1.31 and kg=131.7. shows how a smaller ε penalises more severely those models that disagree with the zero values in the Water Production Rate. In comparison with ε = 1.0, ε = 0.001 introduces features in the function landscape such as rapid changes in value, deep valleys and what might be new minima (e.g., h≈ 7 and h≈ 44). We believe that our algorithm would perform worse on such a function and therefore we use ε = 1.0 throughout this work.
Figure 2. Line plots of Δm (Ns=36) against h, kp and kg. The solid and the dashed line correspond to ε = 1.0 and ε = 0.001, respectively.
2.3. Building a test function
When the evaluation of the objective function is expensive, it is preferable to avoid tuning the control parameters of the search method directly on the problem. In our case, each forward simulation takes about 30 s on a Sun UltraSparc5 Workstation. As time is always limited, we allow a maximum number of function evaluations (7050) to carry out the inversion (this results in a total of 60 h of computation). Thus, our approach will be to use an analogous test function to tune the control parameters of the search method and thereafter apply the algorithm with the tuned parameters on the more computationally expensive target problem.
In this section, we build a test function aiming at capturing some particular features. Our insight into the search space is that it might contain several global minima, each of these having a similar structure to that of the global minimum pictured in . Hence, we propose the following test function
(------125799--3)
with
where
is the euclidean distance, C = 4 (number of global minima) and M = 3 (same dimensionality as the target problem). A high value of σk would result in negative function values because of overlapping between minima. The latter is not observed with the proposed widths. Also, B cannot be too large in comparison with the distance between minima to ensure a zero value at the minima. Once B is fixed, A controls the relative importance between the first and the second term. We fix A = 0.05 and B = 0.01. Lastly, the vector
introduces a correlation between variables.
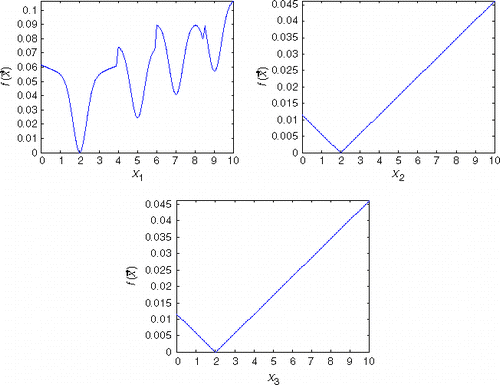
shows the line plots of the test function against x1, x2 and x3 for one of the global minima (the hidden variables are at the minimum xj=2). We regard x1 as equivalent to h, x2 as equivalent to kp and x3 as equivalent to kg. By comparing with , we can see that the test function has a similar structure to the real problem.
Figure 3. Line plots for one of the global minima of the test function. For each plot, the two hidden variables are at the minimum xj=2.
2.4. Previous work with the IC fault forward problem
The IC Fault Forward Problem has been the subject of a number of studies. A previous study using this model Citation29 demonstrated that it is difficult to obtain a history match using simple optimisation methods. Thus, the approach followed in a more recent study Citation30 was to generate a large number of models (159,645 were produced), with the values of the three parameters drawn independently from a uniform distribution (ranges were h∈ (0,60), kp∈ (0,50) and kg∈ (100,200)). None of the generated models were within the basin of the global minimum, since the hypervolume of the global minimum is actually quite small in comparison with that of the whole considered parameter space. In these circumstances, a purely random search is not effective, even if such a large number of models are generated. This shows that, despite having just three free parameters, the inversion of this model is hard in the sense that globally optimal regions are difficult to find.
3. Genetic Sampler: a GA for sampling
In this section, we introduce the method that we will be using to search the parameter space. This is a Steady-state Real-parameter GA (a version of SPC-vSBX Citation24) called GS.
Genetic Algorithms are a class of optimisation techniques inspired by ideas from Darwinian Evolution and Natural Genetics. Information that describes a candidate solution, e.g., the parameters of the numerical model, are encoded into a data structure (the genome), which in Real-parameter GAs corresponds to an array of real numbers. Using operations, analogous to those in nature, new offspring solutions are bred from parent solutions. After a number of generations (iterations), an ensemble of improved solutions is obtained. In minimisation, the measure of the solution quality (fitness) is given by how low the objective function value is. A reference book for Real-parameter GAs is Citation31.
In GS, two parents are selected from the current population of size N to produce λ children through the crossover operator. The objective function value associated with each child is thereafter evaluated. Offspring and current population are then combined so that the population remains at a constant size through the replacement operator. These four steps (selection, crossover, fitness evaluation and replacement) form one GA iteration (generation). Details of GS's selection, replacement and crossover schemes as well as the modifications made to improve its sampling capabilities are explained next.
3.1. Selection
We use uniform random selection, without replacement, to select two parents from the current population. Unusually for a GA, fitness is not taken into account during the selection process. The resulting unbiased selection helps to exploit the information contained in diverse, but low fitness parents.
3.2. Crossovers
In this work, we use a version of the Simulated Binary Crossover (SBX) Citation32,Citation33 called vSBX Citation22,Citation23, although others crossovers could be also used (e.g., PNX crossover Citation24). These crossovers are self-adaptive in the sense that the spread of the possible children solutions depends on the distance between the parents, which decreases as the population converges.
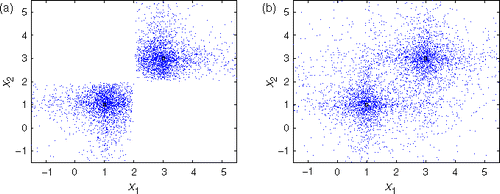
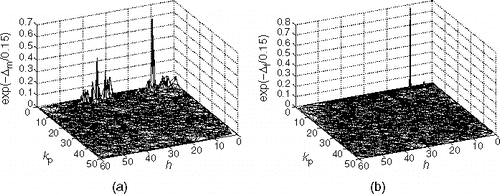
In SBX, children have zero probability of appearing in some regions of the parameter space, as shown in . vSBX does not exclude any regions, while preserving the good SBX properties. This may allow a better exploration of the search space. It should be noted that SBX and vSBX preferentially search along the coordinate directions. This may give an advantage on test functions where minima are aligned along coordinate directions.
Figure 4. Illustration of how the SBX (a) and vSBX (b) crossovers search the parameter space. It is observed that vSBX does not exclude any region of the parameter space and thus it is likely to perform a broader search. The plots were made by breeding many children from two parents fixed at and
for: (a) SBX (η = 1) and (b) vSBX (η = 1).
In vSBX, the first decision is which set of equations to use to generate the offspring. Using a single random number w∈ [0,1], the value of the offspring's jth gene, yj, is provided by the form if w < 0.5 and
if w≥ 0.5. We also need a set of random numbers uj∈ [0,1], one for each coordinate direction. The expression to generate the coordinates of
are
(------125799--4)
The expression to generate the coordinates of
are
(------125799--5)
for each expression βj is given by
(------125799--6)
The larger the value of η the more concentrated is the search around the parents.
3.3. Replacement
The scaled probabilistic crowding scheme is used as the replacement operator. This is an improvement of the probabilistic crowding scheme Citation34, where the closest of the two preselected individuals () enters a probabilistic tournament with the offspring (
), with culling likelihoods (survival, if we were in a maximisation problem) given by
(------125799--7)
where
is the objective function value for an individual
.
If the differences in function values across the population are small with respect to their absolute values, the latter likelihoods would be very similar in all cases. The scaled probabilistic crowding replacement is introduced to avoid this situation. First, for each offspring, NREP individuals from the current population are selected at random. These individuals then compete with the offspring for a place in the population according to the following culling likelihoods
(------125799--8)
where fbest is the function value of the best individual in the offspring and selected group of NREP individuals.
This replacement scheme has several beneficial features. The fittest individual in the replacement competition does not always win (unless it is also the best individual found so far). This helps to prevent premature convergence. Crowding schemes such as this promote the creation of subpopulations that explore different regions of the search space. This has been shown (e.g., Citation22) to be beneficial for creating multiple optimal solutions and to increase the effectiveness in finding the global minimum. Also, it implements elitism in an implicit way. If the best individual in either offspring or current parent population enters this replacement competition will have probability zero of being culled.
3.4. Modifications to improve sampling
The described algorithm (SPC-vSBX), with NREP,=2 fixed, has been shown in Citation24 to be an effective optimiser for high dimensional real-variable functions. This is an example of an optimisation method, since this GA tends to converge to a single optimal solution. In order to characterise the objective function landscape, we need a method that preferentially samples the regions of the parameter space that fit the data well, rather than looking for a single optimal model. This implies the capability of finding all the globally optimal regions of the function landscape. One way to try to achieve this behaviour with GAs is to maintain different parts of the population (i.e., subpopulations) associated with the main optimal regions, what is known as crowding or niching (see Citation31 for further details). The replacement scheme proposed in this section (scaled probabilistic crowding) belongs to the family of crowding techniques.
Genetic Sampler is a GA for Optimisation (SPC-vSBX) that has been modified to improve its sampling capabilities. The main modification consists in allowing the algorithm to take values of its replacement control parameter (NREP) greater than two. From its definition, the higher the value of the control parameter NREP, the more likely the replacement competition made between two similar solutions. Hence, individuals (candidate solutions) tend to be replaced by, not only better, but similar (i.e., with a short Euclidean distance in parameter space) children. This small, but important modification results therefore in the improved maintenance of subpopulations, which in turn improves the sampling of the search space. However, as NREP increases, an increasing number of individuals are found to make random walks outside the initialisation region (i.e., the region of the parameter space where initial individuals are generated). In order to concentrate the sampling on the region of interest, we introduce a second modification: children can only be bred within the initialisation region. This is implemented by repeating the crossover stage until children are within limits (discarded children outside limits are not evaluated). When applying GAs, it is the usual practice to initialise within the region that is likely to contain good solutions. However, with GS, it is advisable to consider a wider initialisation containing also solutions that, although unlikely, one is willing to accept.
4. Experiments
The GS contains four tunable parameters: N, λ, NREP and η. In this study, η = 0.01 and λ = 1 are fixed, and hence we operate the algorithm with just two control parameters: N and NREP. The output of the algorithm will be the ensemble of all the individuals that entered the population during the GS run (typically a third of the total number of evaluations).
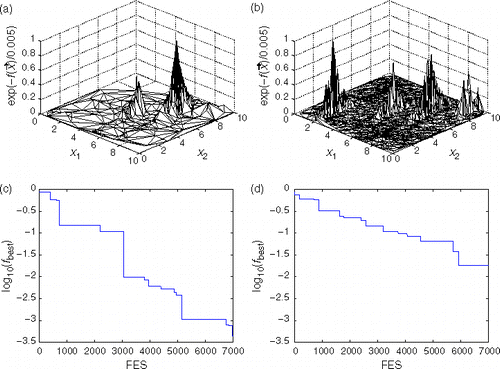
Firstly, we tune the GS on the test function described in section 2.3. The population was initialised within x_j∈ (0,10). We found N = 50 and NREP = 10 to provide a good compromise between average performance (it identified all four minima in 10 out of 10 times) and having a moderate computational cost (a maximum of 7050 evaluations was allowed). As the tuning was not exhaustive, we do not expect these values to be optimal in any way. We use these parameter values for all the runs made in this work with GS. As shown in , the algorithm is able to find all the global optima while providing an excellent sampling of the whole parameter space. In its final population solutions from all four global optima were found, this demonstrates the algorithm's ability to maintain subpopulations. We are not aware of any other search method that has shown this ability without using function information like the number, depth or width of minima. The rather noisy structure of the objective surface is largely an artifact of the way in which the hidden variable x3 is sampled. Any point is plotted no matter what value of x3 was used. This means that it is possible for two points to have identical values for x1 and x2 but different values of the test function. Hence a vertical line would be plotted. In order to compare with the performance offered by the GA for Optimisation, we ran one of the algorithms (N = 75, λ = 3 and NREP = 2) used in Citation23, allowing the same total number of evaluations. Results are presented in . The GA for Optimisation found just two global minima out of four and ended up converging to a single minima (that with xj=7), in part because of the comparatively poor sampling carried out. Lastly, and () show how the error between the best function value was found and show that a global minima decreases for both algorithms. Overall, it is observed that the convergence rate of the GA for Optimisation is significantly faster than that of GS. This is not surprising as GS is converging to, not only one, but the four global optima of the function landscape.
Figure 5. Sampling of the test function obtained with (a) GA for Optimisation and (b) GS. Points in the algorithm's output are connected to their neighbours with triangles. The same total number of function evaluations was allowed in both cases. GS is able to find all four global minima while providing an excellent sampling of the whole parameter space. By contrast, the GA for optimisation found just two global minima and ended up converging to a single minima (that with xj=7). The bottom plots present the error in finding a global minimum against the number of function evaluations (FES) with (c) GA for Optimisation and (d) GS. As the function value for the global minimum is zero, the error is measured as the logarithm of the best test function value (,fbest) alone. It is observed that the GA for optimisation converges to one of the global optima significantly faster than GS. This is not surprising as GS is converging to, not only one, but the four global optima of the function landscape.
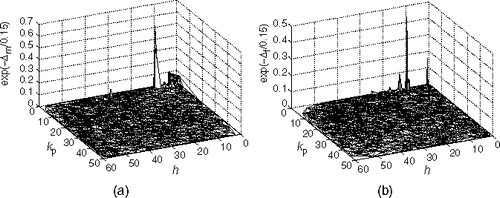
Next, we apply GS to the inversion of the reservoir model described in section 2. The population is now initialised within the region determined by h∈ (0,60), kp∈ (0,50) and kg∈ (100,200). shows the result of history matching using data corresponding to the first 36 months of production. The truth model has exactly the same physics and structure as the assumed model, and therefore truth model is a member of the set of possible models.
Figure 6. GS on objective function using Ns=36 for (a) history matching period with best model found Δm (10.37,1.425,131.50)=0.0795 and (b) forecasting period with best model found Δf (10.40,1.309, 131.83)=0.0373. The truth model was set as h0=10.4, and
. In both plots, the largest peak is associated with the truth model.
reveals an objective function landscape composed by several unconnected optimal regions, which are much smaller than the whole considered parameter space. The very large spike, with h≈ 10, corresponds to the truth model. We can also see notable local optima in the regions with 0<h<8 and 31<h<44. The global optimum has a small basin of attraction around it and has proved difficult to identify in a previous work Citation29. shows the result of carrying out the inversion using the objective function for the forecasting period, Δf. The only substantial point found corresponds to the truth model. All the other local optima that can be seen in are unable to match the observations during the forecasting period. We conclude that for this model one can only obtain a good forecasting from the truth case, and that other good matches from the history matching phase have no predictive value. Since they occupy the largest region, the easiest optima to find seems to be those in the region 31<h<44. A misled search ending up in this region would therefore lead to calibrated models without forecasting capabilities, but we might never know this. It is worth noting that the best found models in are very similar to the truth model. In order to check the quality of the results further, we consider the best model in and compare its simulated production with the measurements in . As expected, an excellent match for the history matching (Δm (10.37,1.425,131.50)= 0.0795) and forecasting (Δf (10.37,1.425, 131.50) = 0.2865) is observed.
Figure 7. The match of the three production series is shown: Oil Production Rate (Oj1), Water Production Rate (Oj,2) and Water Injection Rate (Oj,3). ‘×’ are the measured data and ‘+’ are the simulated data provided by the best model in . The vertical dotted line separates the history matching (Δm (10.37,1.425,131.50)= 0.0795) and forecasting (Δf (10.37,1.425,131.50)= 0.2865) periods.
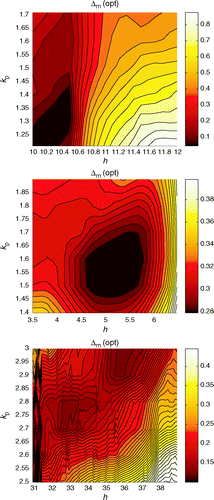
We now investigate the question of non-uniqueness in the context of this model. suggests that there is only one global optimum. We carry out next a grid search of each region containing local optima, to find a more precise value of the objective function minima within them. From it is possible to determine, for each optimal region, the range of h and kp (the values of kg were also clustered around a different value for each region). (top) shows a contour plot of the objective function Δm for the region including the truth model. The plot was generated by conducting a grid search on a fine grid. At each point on the grid, kg was optimised, this results in a much smoother representation of the objective function. The best function value found in that region was Δm=0.0017. Similar plots were carried out for the region with 3.5<h<6.5 and 31<h<39 finding best function values of Δm=0.2729 and Δm=0.0925, respectively. These results suggest that, for this model and in the absence of any error, there is a single global optimum, which constitutes a unique solution to this nonlinear inversion problem.
Figure 8. Grid search on a fine grid on the best optimal regions in .
Lastly, we investigate the effect of including more data in the inversion process. The history matching period is now extended to cover the first 5 years (Ns=38) and thus the forecasting period is shortened by two years. By comparing and , it is observed that there is a general tendency of having fewer local minima as the objective function involves a longer time period. This may be caused by the additional data constraining more strictly the range that variables can take in the model.
Figure 9. GS on objective function using Ns=38 for (a) history matching period with best model found Δm (10.34,1.413,131.14)=0.0962 and (b) forecasting period with best model found Δf (10.32,1.278, 131.59)=0.1258. The truth model was set as h0=10.4, and
. In both plots, the largest peak is associated with the truth model.
5. Conclusions and future work
This work aimed at analysing the impact of two sources of model appraisal uncertainty on a particular highly nonlinear inverse problem. Our approach consisted in using an error-free synthetic data problem so that the truth model is known in advance and therefore the quality of the results can be compared against a known truth.
The analysis was broken down into a number of questions that required a sampling of the objective function landscape of exceptionally high quality. Genetic Sampler succeed in providing such a sampling in the four considered instances of the nonlinear inverse problem (in every instance, the globally optimal region associated with the truth model was identified). This led to several important insights into this nonlinear inverse problem. First, the objective function landscape was composed by several unconnected optimal regions, which are much smaller than the whole considered parameter space. Also, the basin of attraction around the truth model was small in comparison with the other optimal regions. In these circumstances, many search methods (even those with a global perspective) could misidentify a local minimum as the global minimum. Such a misleading search will, in this case, have terrible consequences, as all the local optima had no predictive value. Another important result was found related to the issue of non-uniqueness. It seems that, for this model and in the absence of any error, there is a single global minimum, which constitutes a unique solution to this nonlinear inverse problem. This shows that not all nonlinear inverse problems have non-unique solutions, as it is widely believed. Lastly, we investigated the effect of including more data in the inversion process. This resulted in the objective function landscape having fewer and less prominent local minima, which makes the search easier for most methods. This effect seems to be caused by the additional data constraining more strictly the range that variables can take in the model.
The implications of these results are important for history matching as well as other similar nonlinear inverse problems. Currently, it is assumed that, if all errors are low or successfully corrected, a well history matched model will have predictive capabilities. This common assumption has been challenged in this article. Even in an error-free case, we have seen that only those history matched models associated with the truth (i.e., within the basin of attraction of the global minimum) had predictive value, with other well history matched models providing a poor prediction. In addition, the challenge of finding these models will be greater as the number of unknowns grows because this makes the optimisation more difficult and thus the global optimum harder to find. Therefore, one should aim for finding as many diverse and well calibrated models as possible in order to increase the probability that some of these models have predictive capabilities. Note that these implications are true regardless of how the inverse problem is formulated. For instance, if one opts for the Bayesian formulation and thus defines a posterior probability density function (pdf) as the objective function, still the adopted search method will have to locate (sample) the optimal regions of the parameter space within the affordable number of function evaluations. Otherwise, the results will be irremediably biased. These considerations make clear the importance of using global search methods when searching a parameter space.
A secondary goal of this article was to show that the proposed search method (GS) is an effective tool to provide the required high quality sampling. Such a sampling involves a high probability of locating simultaneously all the global minima of the objective function landscape. The latter was demonstrated on an analytical function landscape with four separated optima of equal depth, which were all identified by GS in 10 out of 10 trials. In addition, GS correctly identified the global minimum in all the instances of the studied nonlinear inverse problem. We are not aware of any other study addressing a nonlinear discrete inverse problem, in which multiple unconnected optimal regions (including the global minimum) were identified. Despite this, the uncertainty associated with misleading search and non-uniqueness in the model appraisal is not eliminated by using this search method. This is because, like any other search method in the literature, GS does not guarantee to reach the global minimum within a limited number of function evaluations. Nevertheless, given its proven ability to identify multiple unconnected globally optimal regions, GS seems very promising at overcoming the difficulties posed by strong multimodality in other nonlinear inverse problems.
On the other hand, we think that the error-free perspective taken in this article could be beneficial to analyse inverse problems before attempting to solve them using the real, error-contaminated data. This is because, with this perspective, the ensemble of estimated models can be checked against a known truth. Firstly, as adding errors is unlikely to make the search any easier, an error-free problem could be used to assess the suitability of the proposed search method. Also, since we only observe the parameter space through the ensemble of models provided by the search method, a poor search might lead to misconceptions about the parameter space (e.g., non-uniqueness). This perspective could serve to clarify these situations. Lastly, the sampling of the objective function landscape obtained from the error-free problem could be compared to that obtained using the real data. This comparison could be used to understand how the function landscape is distorted by errors. From a practical point of view, the proposed comparison could provide a way to assess whether the assumed model is likely to predict well or not. A small distortion would be indicative of low data and modelling errors, and thus a likely good forecast of the future data.
In a future work, we would like to explore the latter idea to address the uncertainty in model appraisal due to errors. In addition, we intend to extend the sampling capabilities of GS for problems with 10 or more variables. This may imply using all previously evaluated models to better guide the search. Also, we plan to carry out similar studies on nonlinear inverse problems with a higher number model parameters.
Acknowledgements
The authors would like to thank Kerry Gallagher and Malcolm Sambridge who provided helpful criticisms of the manuscript. Discussions with Peter King are also appreciated. We also thankfully acknowledge the referees' feedback.
References
- Rothman, DH, 1985. Nonlinear inversion, statistical mechanics and residual statics corrections, Geophysics 50 (1985), pp. 2784–2796.
- Cary, PW, and Chapman, CH, 1988. Automatic 1-d waveform inversion of marine seismic refraction data, Journal of Geophysics 93 (1988), pp. 527–546.
- Floris, FJT, Bush, MD, Cuypers, M, Roggero, F, and Syversveen, AR, 2001. Methods for quantifying the uncertainty of production forecasts: a comparitive study, Petroleum Geoscience 7 (2001), pp. S87–S96.
- Oliver, DS, Reynolds, AC, Bi, Z, and Abacioglu, Y, 2001. Integration of production data into reservoir models, Petroleum Geoscience 7 (2001), pp. S65–S73.
- Snieder, R, and Trampert, J, 1999. "Inverse problems in geophysics". In: Wirgin, A, ed. Wavefield Inversion. New York: Springer-Verlag; 1999. pp. 119–190, (Ed.).
- Sambridge, M, and Mosegaard, K, 2002. Monte carlo methods in geophysical inverse problems, Reviews of Geophysics 40 (2002), pp. 3.1–3.29.
- Sambridge, M, 2003. An ensemble view of earth's inner core, Science 299 (2003), pp. 529–530.
- Lomax, A, Virieux, J, Volant, P, and Berge, C, 2000. "Probabilistic earthquake location in 3d and layered models: introduction of a metropolis-gibbs method and comparison with linear locations". In: Thurber, C, and Rabinowitz, N, eds. Advances in Seismic Event Location. Norwell Mass: Kluwer Acad.; 2000, (Eds).
- Mosegaard, K, and Sambridge, M, 2002. Monte carlo analysis of inverse problems, Inverse Problems 18 (2002), pp. R29–R54.
- Metropolis, N, Rosenbluth, AW, Teller, AH, and Teller, E, 1953. Equation of state calculations by fast computing machines, Journal of Chemical Physics 21 (1953), pp. 1087–1092.
- Kirkpatrick, SC, Gelatt, D, and Vecchi, MP, 1983. Optimization by simulated annealing, Science 220 (1983), pp. 671–680.
- Holland, JH, 1975. Adaptation in Natural and Artificial Systems. Ann Arbor Mich: Univ. of Mich. Press; 1975.
- Sambridge, M, 1999. Geophysical inversion with a neighbourhood algorithm -- i. Searching a parameter space, International Journal of Geophysics 138 (1999), pp. 479–494.
- Beghein, C, and Trampert, J, 2003. Robust normal mode constraints on inner-core anisotropy from model space search, Science 299 (2003), pp. 552–555.
- Sen, MK, and Stoffa, PL, 1995. Global Optimization Methods in Geophysical Inversion. New York: Elsevier Science; 1995, Vol. 4 of Adv. Explor. Geophys..
- Snieder, R, 1998. The role of nonlinearity in inverse problems, Inverse Problems 14 (1998), pp. 387–404.
- Gavalas, GR, Shah, PC, and Seinfield, JH, 1976. Reservoir history matching by bayesian estimation, Society of Petroleum Engineers Journal 16 (1976), pp. 337–350.
- Scales, JA, and Snieder, R, 2000. The anatomy of inverse problems, Geophysics 65 (2000), pp. 1708–1710.
- Carter, JN, Ballester, PJ, Tavassoli, Z, and King, PR, 2004. Our calibrated model has no predictive value: an example from the petroleum industry, Reliability Engineering and System Safety (2004), (In press).
- Christie, MA, Subbey, S, and Sambridge, M, Prediction under uncertainty in reservoir modeling. Presented at Proceedings of the Eighth European Conference on the Mathematics of Oil Recovery (ECMOR VIII). 2002, E53.
- Carter, JN, Ballester, PJ, Tavassoli, Z, and King, PR, Our calibrated model has no predictive value: an example from the petroleum industry. Presented at Proceedings of the Sensitivity Analysis and Model Output Conference. 2004, (Eds), http://library.lanl.gov/ccw/samo2004/.
- Ballester, PJ, and Carter, JN, 2003. "Real-parameter genetic algorithms for finding multiple optimal solutions in multi-modal optimization". In: Cantú-Paz, E, Foster, JA, Deb, K, Davis, L, Roy, R, and O'Reilly, U-M, eds. Lecture Notes in Computer Science 2723. Berlin, Heidelberg: Springer; 2003. pp. 706–717, (Eds).
- Ballester, PJ, and Carter, JN, 2004. "An effective real-parameter genetic algorithms for multimodal optimization". In: Parmee, IC, ed. Adaptive Computing in Design and Manufacture. Vol. VI. London: Springer; 2004. pp. 359–364, (Ed.).
- Ballester, PJ, and Carter, JN, 2004. "An effective real-parameter genetic algorithm with parent centric normal crossover for multimodal optimization". In: Deb, K, Poli, R, Banzhaf, W, Beyer, H-G, Burke, EK, Darwen, PJ, and Dasgupta, D, eds. Lecture Notes in Computer Science 3102. Berlin, Heidelberg: Springer; 2004. pp. 901–913, (Eds).
- Ballester, PJ, and Carter, JN, 2004. "An algorithm to identify clusters of solutions in multimodal optimisation". In: Ribeiro, CC, and Martins, SL, eds. Lecture Notes in Computer Science 3059. Berlin, Heidelberg: Springer; 2004. pp. 42–56, (Eds).
- Ballester, PJ, 2005. "New computational methods to address nonlinear inverse problems". PhD thesis. Department of Earth Science and Engineering, Imperial College, University of London; 2005.
- Carter, JN, 2004. Using bayesian statistics to capture the effects of modelling error in inverse problems, Mathematical Geology 36 (2004), pp. 187–216.
- Schlumberger GeoQuest Reservoir Technologies, 1998. Eclipse 100 Technical Description 98A, (1998).
- Bush, MD, and Carter, JN, 1996. "Application of a modied genetic algorithm to parameter estimation in the petroleum industry". In: Dagli, , ed. Intelligent Engineering Systems through Artificial Neural Networks 6. New York: ASME Press; 1996. pp. 397–402, (Ed.).
- Tavassoli, Z, Carter, JN, and King, PR, 2004. Errors in history matching, SPE Journal 9 (2004), pp. 352–361.
- Deb, K, 2001. "Multi-Objective Optimization using Evolutionary Algorithms". Chichester: J. Wiley & Sons Ltd; 2001.
- Deb, K, and Agrawal, S, 1995. Simulated binary crossover for continous search space, Complex Systems 9 (1995), pp. 115–148.
- Deb, K, and Kumar, A, 1995. Real-coded genetic algorithms with simulated binary crossover: studies on multi-modal and multi-objective problems, Complex Systems 9 (1995), pp. 431–454.
- Mengshoel, OJ, and Goldberg, DE, Probabilistic crowding: deterministic crowding with probabilistic replacement. Presented at Conference of the Genetic and Evolutionary Computation. 1999, (Eds).