Abstract
The prediction and monitoring of aircraft structural fatigue damage is vital for the safe operation of ageing aircraft. The ability to determine aerodynamic loading inversely using structural response data has the potential to significantly improve fatigue monitoring capabilities. This study examines how a Neural Network can be used to estimate and predict aerodynamic loading from structural response data. To simulate aerodynamic loading conditions F/A-18 Empennage fatigue test data which includes the application of both high frequency buffet and low frequency manoeuvre loading will be used. The neural network was trained using response data from several strain gauges as input and known applied loads as output. It was then tested with new data and compared to the known applied loading corresponding to the new data. The network was also tested in its ability to predict the aerodynamic loading across locations different to the locations of the training data.
1. Introduction
Aerodynamic loads can currently be determined directly using expensive and complex instrumentation. But this is primarily during developmental stages and is not effective for ongoing monitoring of fleet operations. New methods of measuring pressure distributions are being developed such as pressure sensitive paints (PSP). However, a system that enables aerodynamic loads to be reconstructed using existing structural instrumentation would be invaluable.
Methods have been developed, which aim at mathematically calculating the aerodynamic loading inversely from structural response data. Shkarayev et al. (2000) developed an inverse interpolation formulation based on a parametric approximation of the aerodynamic loading Citation1. This approach becomes very complex under real flight conditions.
Cao et al. (1998) were also able to demonstrate that simple aerodynamic loading can be found inversely by using Artificial Neural Networks (ANNs) Citation2.
A software system, ALORENES, was developed by Sofyan and Trivailo (2001) which uses a hybrid neural network–finite element model to solve aerodynamic load inverse problems Citation3. ALORENES was successful in determining linear, non-linear, non-steady and combined aerodynamic loads. This system used FE models to obtain structural response data used to train the neural networks.
Structural health monitoring (SHM) systems monitor structural response data in order to determine the fatigue damage incurred during operations so that effective maintenance can be applied. Instrumentation such as strain gauges and accelerometers are already used to determine the levels of overall flight loads, such as wing root bending moment and torque Citation4. The current systems do not measure pressure distributions or aerodynamic loads on the aircraft. A better and continuous understanding of these loads during real flight conditions is useful for more accurate SHM.
Research has also been conducted in the area of utilising ANN methods in SHM systems. Troudet and Merrill (1990) proposed and demonstrated the use of ANN methods in the real-time estimation of fatigue life of components of reusable rocket engines Citation5, Sofge (1994) used ANN techniques for recognising structural defects in composite materials Citation6, and Lopes (1997) showed that ANN methods can be used to monitor fatigue damage in offshore structures Citation7. Clearly ANN techniques are a valuable tool in any SHM system.
This article demonstrates the ability of neural networks to estimate the complex aerodynamic loading as found in actual conditions inversely using structural response data.
2. Description of the test conditions
The nature of aerodynamic loads experienced by an aircraft surface during operation can vary greatly. Types of loading to be expected include low frequency manoeuvre loading and high frequency buffet loads. Loading may be static or dynamic, linear or non-linear.
The air pressures over a wing or control surface can change quickly over time and at different surface locations. In order to have a useful neural network system which can inversely estimate aerodynamic loading from structural response data, the training and testing data should cover the whole range of the expected operational loading conditions.
For this research data was taken from the International Follow-On Structural Test Project (IFOSTP) F/A-18 fatigue test conducted by the Royal Australian Air Force and Canadian Forces. This fatigue test involved the simultaneous application of both manoeuvre and buffet loads using airbag actuators and shakers. The applied loads were representative of the actual loads experienced by an F/A-18 during flight tests.
From the large number of gauges installed on the test article a selection of 19 strain gauges along with nine load actuators and two shakers were selected. These gauges are located on the port side vertical stabiliser and port side aft fuselage stub frames of the test article, and the selected actuators and shakers apply loads to the port side vertical stabiliser.
For these gauges and load channels, a data set of 200,000 data points per gauge/load channel was selected which corresponds to 5 min and 33 s of test time. This was then divided into a set of 100,000 data points which was used to train the neural network, and a data set of 100,000 data points which was selected to test the neural network.
The relationship between the strain gauges and the applied loads is complex. The gauges are placed within the aircraft structure primarily on the surfaces of spars and ribs at different depths and orientations.
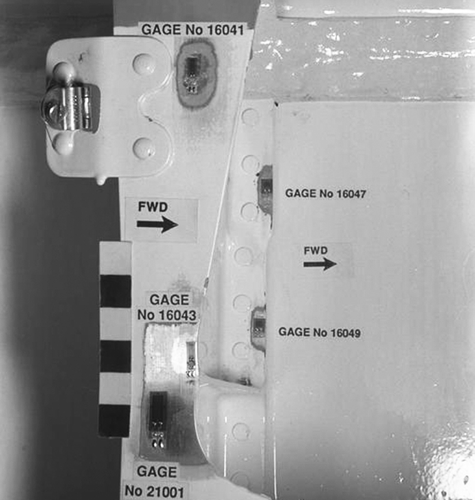
The photograph in shows several gauges installed on an aft fuselage stub frame. The stub frame is attached to the vertical tail structure so the responses of gauges located on the stub frame will be affected by the loading on the vertical tail.
Figure 1. Strain gauges installed on the aft fuselage in the vicinity of the vertical tail.
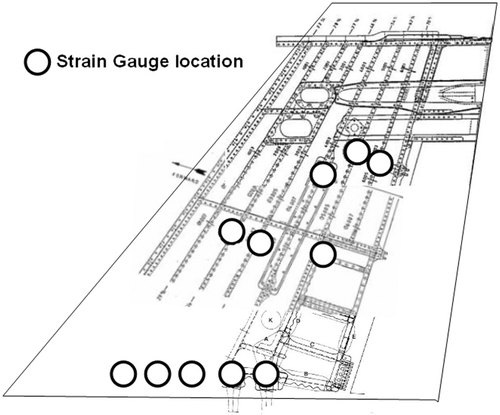
The 19 strain gauges locations are shown in . Some locations have two or more gauges in close proximity.
Figure 2. Locations of strain gauges used to train the neural network.
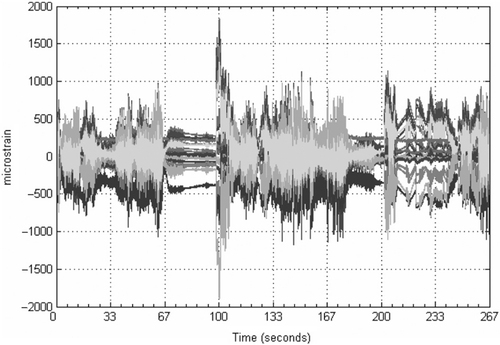
shows the training input data taken from the 19 strain gauges. The data shows the gauge response to both low frequency manoeuvre loading applied by the actuators and the high frequency buffet loading applied by the shakers.
Figure 3. Strain gauge data used as input data to train the network.
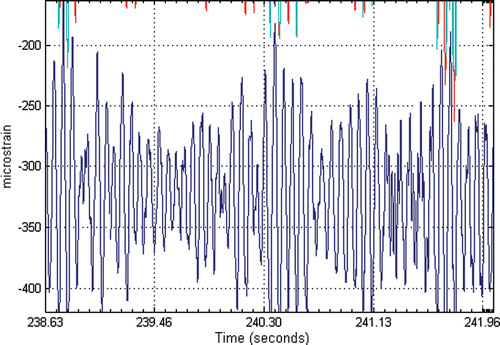
A segment of is magnified and shown in . Closer examination of the strain gauge data in demonstrates the high frequency, large amplitude nature of the buffet loading and corresponding strain response. For this study the buffet loading can be considered symmetrical in magnitude about zero and therefore the filtering can be used to remove high frequency oscillations from the neural network input data. In order for the neural network to be able to process the manoeuvre loading the strain gauge response data (network input data) was first filtered using a MATLAB algorithm to separate the high frequency strain response data from the low frequency data.
Figure 4. Magnification of strain gauge data illustrating the effect of buffet loading.
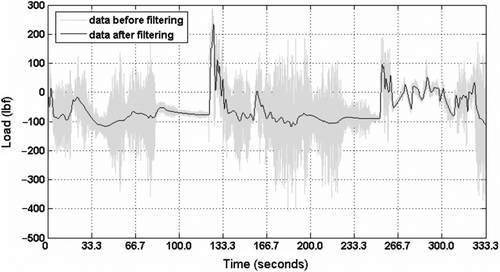
Neither the manoeuvre nor buffet load data was filtered so that the loads data that the neural network output was tested against is still the actual data applied to the vertical tail as recorded during the IFOSTP fatigue test. shows a graph of the original data from one gauge along with the data after filtering.
Figure 5. Strain data before and after filtering.
The filtered strain data was used to train the network when determining its ability to model the manoeuvre loading. The original unfiltered strain data was used to train the network when determining its ability to model the buffet loading.
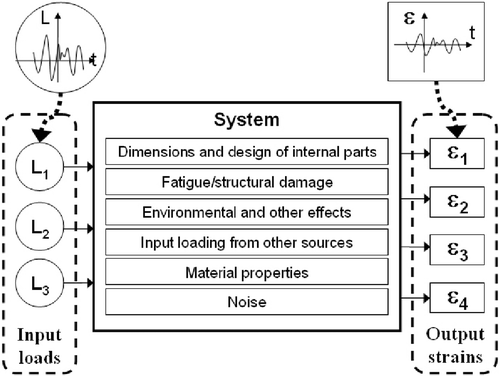
shows a simplified model of the relationship between aerodynamic loads and the structural response data on the aircraft vertical tail.
Figure 6. Model of relationship between aerodynamic loading and strain response.
In this article the ‘real’ system of the tail structure, properties and other variables is replaced with the neural network which is used to simulate the inverse relationship as shown in .
Figure 7. Model of inverse relationship between strain response data and aerodynamic loading.
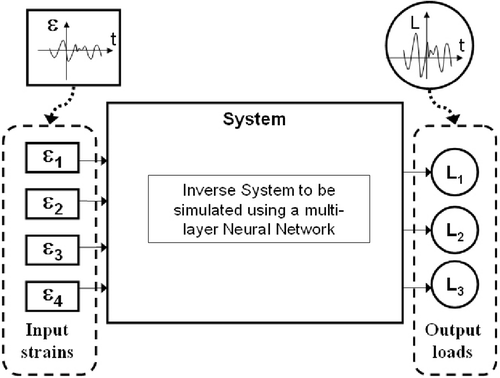
This test shows that a neural network can be used to simulate the system without having to know the properties of the system. This model assumes that there is a unique solution of the load values for the given strain values. This is achieved by using a set of strain values taken from gauges at different locations in the structure. When the number of gauges used as input is increased the accuracy of the system can be improved.
3. Developing the neural network
The software used throughout this research is MATLAB version 6.5 by The Mathworks, Inc. with the MATLAB Neural Network Toolbox.
Initially, several common network types were considered for modelling the system, as listed in . These network types are supported by the MATLAB software and descriptions may be found in Haykin (1994) Citation8.
Table 1. Common network types
Tests were conducted using a sample of input and output training and test data. The input data consisted of 10,000 data points for 19 gauges and one output load, with a test set of 2,000 data points. This resulted in an input training matrix with a size of 19 × 10,000 elements. Parameters and network structure was adjusted for network type to optimise performance. Most network types were found to be unsuitable for the task. A brief summary of results is shown in . It lists only networks that could form any kind of convergence during training.
Table 2. Summary of results for several networks
Following further testing and comparisons between the cascade-forward and Elman back-propagation networks, a specially adapted Elman back-propagation network was selected to model the system and for testing with larger training and testing data sets.
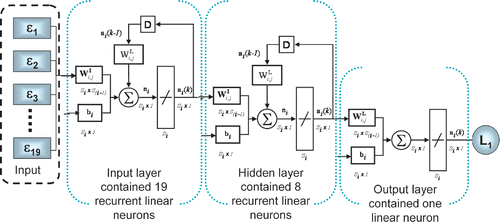
An Elman network with three linear layers was used. The first input layer contained 19 neurons (corresponding to the 19 input variables), a hidden layer of 8 neurons and a single neuron output layer. Each neuron contains a linear transfer function. shows the layout of the Elman back-propagation network used.
Figure 8. Layout of the selected Elman neural network.
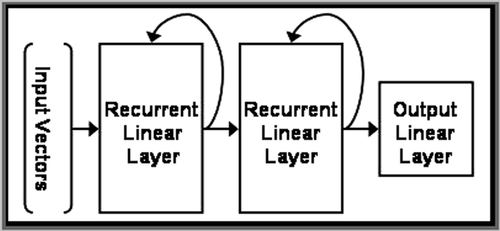
The first layer in the selected Elman back-propagation network is a recurrent layer of linear neurons that accepts input from the network input vectors. The output from the first layer is connected to the input to the second layer and is also fed back into itself with a delay factor.
The second layer also contains linear neurons that likewise has input which is a combination of the output of the first layer as well as its own output with a time delay factor. The output from the second layer is also fed to the output layer which contains a single linear neuron.
The output layer is not recurrent and its output produces the network output vector.
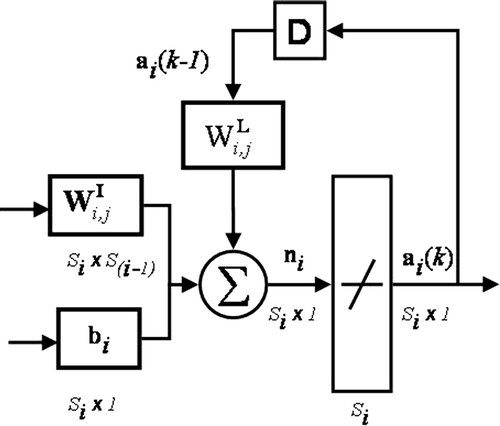
The architecture of the recurrent layers is identical and is depicted in , where ai(k) = the output vector of the ith layer and is dependent on time: k; = the vector of input weights for the ith layer and the jth input;
= the vector of recurrent weights for the ith layer and the jth input; bi = the bias for the ith layer; si = indicates the number of elements for the given layer; D = the delay factor for the recurrent inputs.
Figure 9. The layout of the first and second layers in the selected Elman network.
The structure of the output layer is shown in . The output layer is not a recurrent layer. The complete nature of the Elman network is illustrated in showing all three layers combined.
Figure 10. Diagram of the output layer in the selected Elman network.
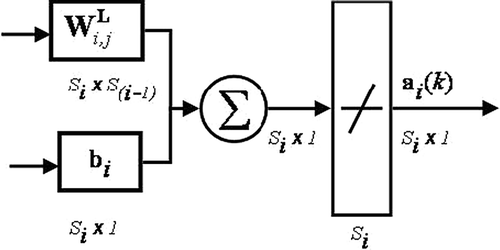
Figure 11. Diagram of the complete Elman network.
Each of the recurrent linear layers (i = 1, 2) performs according to:
(1)
where f is the linear transfer function, and pi is the input at layer i. The output layer (i = 3) performs according to the equation (2) shown next, where f is the same linear transfer function
(2)
For the first layer of the network (i = 1), the input is the input vector of strain values for j number of gauges for one time interval, as shown in equation (3):
(3)
where ε is the input strain matrix. For the second and third layers of the network (I = 2, 3), the input is taken from the output of the previous layers as shown in equation (4):
(4)
Equation (5) represents the calculations of the Load at position j, Lj, as a function of the input strain matrix ε.
(5)
The Elman back-propagation network was tested with various parameters and structures. It was found to perform better with linear layers. In trials conducted using one or two layers of neurons with the ‘tansig’ transfer function were not able to approximate the output data even when the number of neurons in each layer was varied. A network with only one recurrent layer and two layers in total was tried but it produced less accurate results than the three layer network. When extra neurons were added to the first layer, the training time was significantly increased. The inclusion of the second recurrent layer enabled greater accuracy with a lower increase in training time.
The network was trained using the MATLAB ‘traingdx’ function which is a gradient descent with momentum and adaptive learning rate back-propagation algorithm.
Other training methods were tried such as the Levenberg–Marquardt back-propagation method but they could not operate successfully due to the computer memory required to process the large input matrices. Even when the Levenberg–Marquardt back-propagation method was tried with one input vector and a training data set of only 1,000 data points the network could not converge.
4. Test results
4.1. Network performance in estimating buffet loads
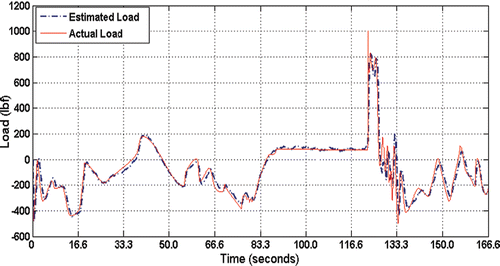
After 820 epochs the Elman network converged to a mean square error (MSE) of 2012. The MSE for a network fitted perfectly to the training data would be zero, however considering the complex nature of the system involved and the large input training matrix it would be undesirable for the network to fit the data exactly. A non-zero MSE value indicates that the network is approximating the system, which is better if new data different to the training data is to be successfully estimated. To see how well the network has modelled the training data a sample of the same training data was fed back into the network and the output was compared to the actual output (load) as shown in .
Figure 12. Estimated load compared with actual load for sample training data.
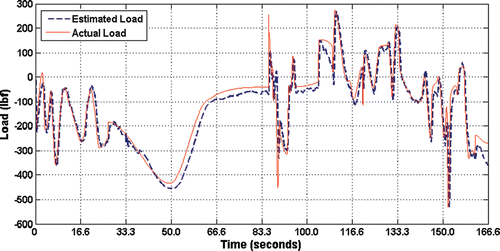
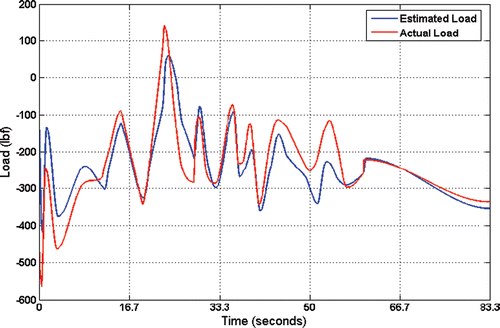
As shows when the Elman network is tested with new data from strain response data not already in the input data set the Elman network does not match the manoeuvre loading exactly. However, the network can still provide a good approximation of the actual manoeuvre load at the location where the training loads data was recorded even for input values which differ from the training input values. The estimated load provides a good indication of the magnitude and frequency of the actual load for expected operating conditions.
Figure 13. A comparison of estimated manoeuvre load to actual manoeuvre load.
4.3. Network performance in estimating buffet loads
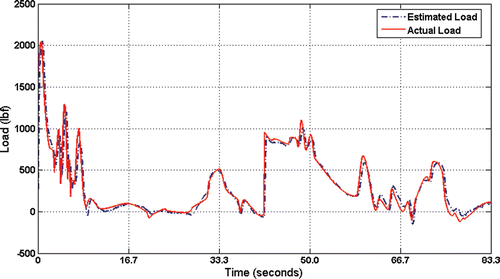
It is important that the network not only be able to determine the manoeuvre loads, but also the magnitude and frequency of the buffet loads. In this case the network was retrained using a subset of the same data set as was used for the manoeuvre load estimation, but without filtering. The matrix for the training input contained 20,000 data points for 19 gauges. The network parameters remained the same and after 980 epochs the network was able to model the training data as shown in . The results using new test data are shown in .
Figure 14. A comparison of estimated buffet load to actual buffet load for the training data.
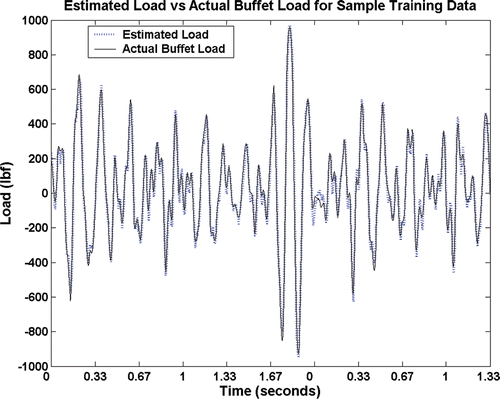
Figure 15. A comparison of estimated buffet load to actual buffet load for the test data.
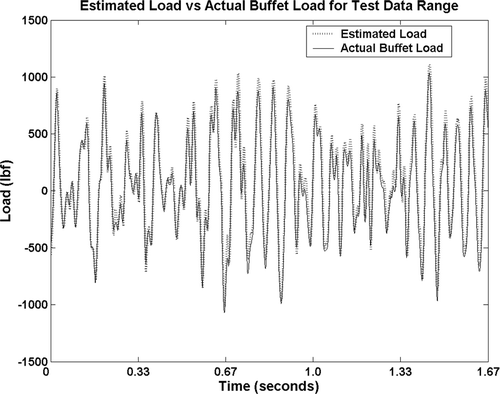
The error in the test data range is slightly higher than that of the training data, but the results still show that the network is capable of estimating the high frequency dynamic buffet loading to a good level of accuracy.
5. Calculating load at a new location
The aerodynamic loading across an aircraft surface differs from the test conditions so far in that actual loading is distributed across the surface and may differ significantly at different locations. This exercise tests the network's ability to estimate the aerodynamic loading at a location different from the training data to determine whether the neural network can estimate the load at any point across the surface.
By learning how the position of the actuators influences the actuator load's influence on the strain response data, the network is able to estimate the load at a ‘new’ location outside of the training data. The ‘new’ location is between the locations of the other actuators so that it is within the location range the network has been trained for. shows the locations of the nine load actuators on the vertical tail, along with the locations of three strain gauges.
Figure 16. Locations of load actuators, strain gauges and ‘unknown load’.
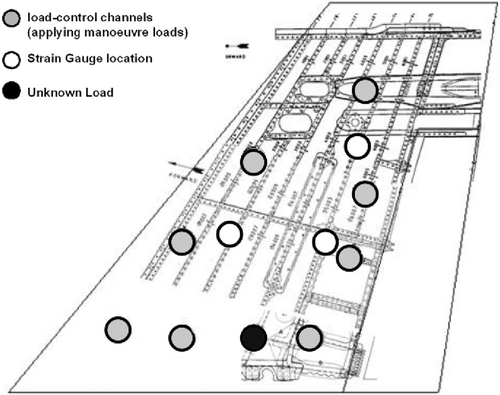
Each load L1, L2, … , Ln corresponds to the input loading applied at known locations 1, 2, … , n corresponding to (X1, Y1), (X2, Y2), … , (Xn, Yn) on the vertical tail surface (the vertical tail is assumed to be a flat two dimensional surface).
Two methods were developed and tested to determine loading as a function of x- and y- coordinates. The first, Method A, involves creating an input data set that incorporates the x- and y- coordinates for known loads together with strain response data to test whether the neural network can be trained to learn the relationship between loading and location.
The second, Method B, involves mathematical interpolation of neural network output loading to estimate the loading at an unknown location and subsequent training of the network to learn the relationship between input data and unknown load.
The available data set of nine manoeuvre loads at nine locations at 200,000 points was used to test these methods by dividing the data set into 50,000 points to comprise the training data with the remaining 150,000 used to test each method.
5.3. Method A: neural network estimation
If the coordinates for the locations of the loads are used as input in training the neural network then, the network can also model the relationship between the location of the applied load and the resultant strain. So, the location of the load changes effectively while the locations of the gauges are unchanged.
(6)
Where i = no. of known loads,
(7)
Where t = 50,000
(8)
where
(9)
In order to train the network to include actuator locations the original training data set was modified. The input matrix consisted of the three gauge responses repeated and added to the location vector for each of the eight known load actuators over a 10 s period. The output is the sum of all eight load actuator outputs for the same time period. This allowed the network to learn the loading corresponding to the strain gauge data and the actuator position.
shows the network's ability to estimate the manoeuvre loading at a location outside of the training data set.
Figure 17. Estimated load at ‘new location’ compared to known actual load at that location.
demonstrates the network's ability to estimate loading at an unknown location. However this process was repeated at other locations and using different portions of the available data for training and testing the accuracy was found to degrade in some instances. A second method was developed to produce significantly improved results.
5.4. Method B: neural network with interpolation
This method involved using the neural network to estimate loading at locations of known load channels 1–8 using strain response data from 19 gauges as per section 4.1 of this article. Using the data set of eight loads output from the neural network, the load at each location was determined as a function of x and y for an instant t.
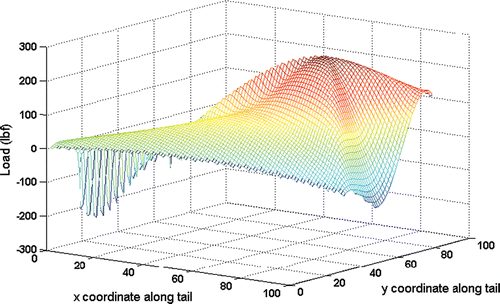
Using a programming loop for each of the 50,000 columns of data contained in the output data set of loading at the eight locations together with Cartesian coordinates, the MATLAB ‘griddata’ function was used to estimate the approximate load at the unknown location. The griddata interpolation function uses Qhull Citation9 method of Delaunay triangulation. It was used to generate a loading matrix over a 100 × 100 grid spanning the eight load locations across the vertical tail surface. Once the loading was interpolated across the vertical tail the estimated load value for this given instant can be found for any x–y coordinates in the 100 × 100 grid as illustrated in .
Figure 18. Plot of instantaneous loading across vertical tail following interpolation of known loads.
This step was repeated for each of the 50,000 data points using a recursive loop to generate a vector of load versus time at location 9. shows the results of determining loading using this location compared with the actual loading provided in the original data set.
Figure 19. Estimated load at ‘new location’ compared to known load in region of training data.
The results indicate this step provides a result close to the recorded value. The differences are due to the errors from the estimation using neural networks of loading at each of the locations 1–8 as well as possible errors in the interpolation approximation process.
This derived loading at location 9 was then used as training output to train a neural network to estimate the loading at this new location from the input data from the 19 strain gauges. The results of the loading at location 9 estimated by the newly trained neural network are shown compared to the actual loading in .
Figure 20. Estimated load at ‘new location’ compared to known load for test data.
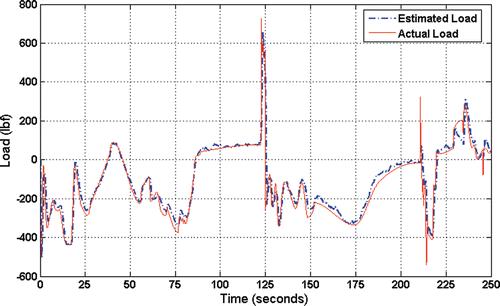
These results indicate that the loading can be determined at any point on the surface provided there is sufficient training data available at locations which allow accurate interpolation and extrapolation across the surface.
6. Conclusions
Results show that neural networks are capable of estimating the aerodynamic loads inversely from the strain gauge data. The network cannot model an exact relationship between strain gauges and loads and the results contain a significant amount of error. The results are still useful, however, because the actual relationships between response data and aerodynamic loading are complex and once trained the network has the potential to provide a good estimate of the aerodynamic loading. This may be suitable for SHM conditions where the exact load values are not as important as knowing the level of loading and frequencies.
Further work must be carried out to examine if the errors can either be eliminated or to determine whether or not they have a significant effect on the potential applications of the network.
The selection of training data plays a large role in the ability of the network to accurately predict the aerodynamic loading. It is important that the network is trained with data that represents the full spectrum of expected loading conditions.
It would be better if the network could automatically identify and separate manoeuvre and buffet load components without prior filtering. More work could be done to modify the network or to combine more than one neural network in order to achieve this.
Overall, the results obtained so far are promising and neural networks do have the potential for enhancing existing SHM practices through the inverse determination of aerodynamic loads from structural response data.
Acknowledgements
This project could not have been carried out without the support of Defence Science Technology Organisation (DSTO), Australia, which provided, along with financial assistance, access to data and technical resources required in order to carry out much of the work presented here and carried out by the DSTO/RMIT Centre of Expertise in Aerodynamic Loading (CoE-AL). In particular, the authors would like to thank Dr Douglas Sherman, Functional Head, Aircraft Loads from the Platform Sciences Laboratory for his vision, suggestions, support, initiative and thorough guidance of the work. The authors would also like to thank Dr Chris Blanksby for helpful discussions.
References
- Shkarayev, S, Krashantisa, R, and Tessler, A, 2000. An Inverse Interpolation Method Utilizing In-Flight Strain Measurements for Determining Loads and Structural Response of Aerospace Vehicles. Tucson: University of Arizona; 2000, AZ 85721, & Analytical and Computational Methods Branch, M/S 240 NASA Langley Research Center, Hampton, VA 23681-0001.
- Cao, X, Sugiyama, Y, and Mitsui, Y, 1998. Application of artificial neural networks to load identification, Computers and Structures 69 (1998), pp. 63–78.
- Sofyan, E, and Trivailo, PM, Solving Aerodynamic Load Inverse Problems Using a Hybrid FEM – Artificial Intelligence. Presented at 3rd Australasian Matlab Users Conference [organised by CEANET and MATHWORKS]. Crown Towers, Melbourne, Australia, 09–10, Nov, 2000.
- Molent, L, and Inan, S, Specifications for an unified strain and flight parameter based aircraft fatigue usage monitoring system. Presented at DSTO International Conference on Health and Usage Monitoring. Melbourne, Australia, 19–20, Feb, 2001.
- Troudet, T, and Merrill, W, 1990. A real time neural net estimator of fatigue life neural networks, IJCNN International Joint Conference 2 (1990), pp. 59–64.
- Sofge, DA, Structural health monitoring using neural network based vibrational system identification. Presented at Proceedings of the 1994 Second Australian and New Zealand Conference on Intelligent Information Systems (IEEE). 29 November–2 December, 1994.
- Lopes, TAP, 1997. Neural networks on fatigue damage prediction, International Conference on Neural Networks 1 (1997), pp. 183–187.
- Haykin, SS, 1999. Neural Networks: A Comprehensive Foundation. New Jersey, USA: Prentice Hall; 1999.
- Barber, CB, Dobkin, DP, and Huhdanpaa, HT, 1996. The Quickhull algorithm for convex hulls, ACM Trans. on Mathematical Software 22 (1996), pp. 469–483, http://www.qhull.org.