Abstract
The algorithm developed in this study integrates a frequency analysis of key frequency bands (alpha, beta, delta, and theta) with an inverse solution using the principal component analysis (PCA) to validate brain functional mappings associated with the characterization effects of an auditory/comprehension task. The results are found to be consistent with earlier findings involving the Wernicke and Broca's brain areas in relation to language comprehension. These cortical areas were discovered in 1874 and 1861 respectively, to be associated with the language comprehension and production. In support of these findings, spectral arrays and topographic maps are used for both listening and answering phases. The areas most responsible for the language comprehension were reverse-detected by means of an innovative search algorithm that iteratively relocates electrodes based on the direction of increasing PCA outcomes. The inverse PCA reveals that eigenvectors associated with the largest eigenvalues produce an interesting activity pattern directly attributable to those characteristic behaviors found in the different frequency bands. The clinical electroencephalogram (EEG) data involved nine subjects at Miami Children's Hospital using the Electrical Source Imaging system with 256 electrodes.
Keywords:
1. Introduction
The study focuses primarily on exploring human brain mechanisms responsible for auditory language comprehension and response functions. The purpose of this study is thus to examine the electroencephalogram (EEG) data and the subjective effects resulting from auditory/comprehension of these tasks in combination with the so-mentioned frequency brain waves. Conceivably, as the EEG and subjective effects of these tasks become better understood, their use as a helpful tool in mapping the different functions of the brain will become more effective. A forward solution to this problem was performed earlier in a previous study Citation1. Now, an inverse approach is proposed in order to find which electrodes are indeed those associated with the auditory/comprehension test that correspond to a given activity pattern extracted from all EEG data provided. The method is based on the analysis of the standard deviation of the principal components of predetermined groups of electrodes that represent different areas of the brain. In others words, for each of these groups, the eigenvalues were calculated and the standard deviation of this set of eigenvalues was considered with the purpose of ascertaining the level of standard deviation among these different groups. While looking at activity levels in the EEG data, electrodes were grouped into different sets. Each combination of sets produced different activity patterns. Given the inverse relationship by an activity mapping, the collection of electrode sets, which produces the expected outcome, will be found.
The anticipated outcome is that the highest standard deviation would point to the area on the brain with more correlation. The EEG of each subject was recorded during the auditory/comprehension test. The original EEG signals were divided into the auditory/comprehension phase of the test and its response time, in order to differentiate between the auditory phase and the response phase. The fluctuations of changes in the frequency spectrum are displayed for both tasks. By means of complex digital analysis, an evaluation of spectral arrays is shown in comprehensive color topographic maps illustrating the resulting brain activities in order to establish relationships between brain waves at different cortex locations. Methods such as the one proposed in this study may provide a picture of the dynamic neural processes underlying the allocation of attention during the performance of auditory and response tasks.
A new algorithm was thus developed to find specific patterns of dynamic brain behavior during monitoring of these processes. The algorithm developed, in addition to producing detailed head topography maps showing the frequency changes that take place, also compares EEG signals of any new subject to be potentially included in the experimental study in order to evaluate similar/dissimilar behaviors. Auditory/comprehension and answering tasks as measured by the previously mentioned brain waves activities identify specific involvement of each cerebral hemisphere. Each brain lobe (frontal, temporal, parietal, and occipital) is associated with different human functions Citation2,Citation3. Therefore, it is important to know the involvement of the two brain hemispheres (left and right) as well as the involvement of each region of the brain during an auditory/comprehension test.
2. Methods
2.1. Data acquisition
EEG data was recorded using the ESI-256 recording system, under expert clinical supervision. The ESI-256 system allows us to acquire data using large electrode arrays up to 256 channels. An illustration of this machine is shown in .
Figure 1. ESI-256 system components: (a) ESI-256 system (eight SynAmp amplifiers, host computer, and display monitor), (b) eight head boxes (pre-amplifiers).
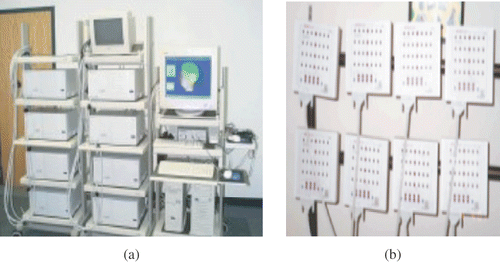
As illustrated in , the main modules of the ESI-256 system consists of eight SynAmps EEG amplifiers, a host computer, the Scan software, and a monitor for data display. The eight Synamp include an array of eight head boxes associated with each amplifier. Each head box accommodates up to 32 channels. The head box is the first gain stage since each channel is configured in order to amplify the signal coming from each electrode. The electrodes are connected to the corresponding head boxes, which relate and transmit data to the host computer through the synamp amplifiers.
Two amplifiers and head boxes were used, as illustrated in , for this conducted experiment, which resulted in using 41 electrodes given the chosen MCN setup. The electrodes were connected to the corresponding head boxes starting at channel 1 through 28 in the first head box and starting at channel 1 through 13 in the second head box. An electrode positioned in the forehead was selected as ground. This electrode was connected to the GROUND channel as specified in the head box.
Figure 2. Amplifiers and head boxes.
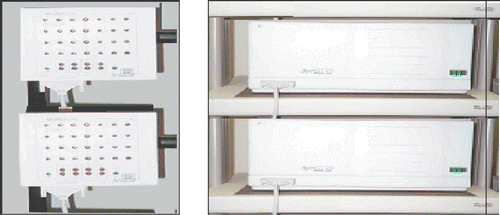
Each SynAmp has an input up to 32 channels. Since the system has eight amplifiers, you can go up to 256 channels. The user by modifying the setup selected could vary the number of channels to use in a specific study. shows the channel assignment table of the Edit or Acquire sub-modules. The user could enter at any time the number of electrodes desired as well as the labels corresponding to each one of them.
Figure 3. Interface showing electrode labels used in the experiment.
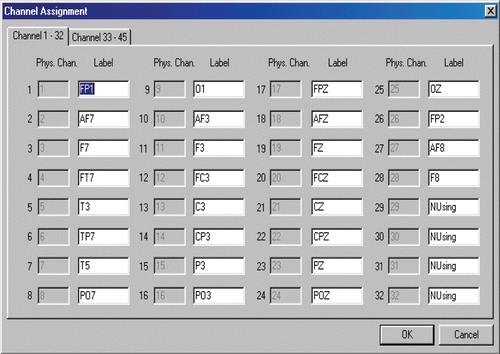
The conducted study was performed using the modified combinatorial nomenclature (MCN), with a total of 41 electrodes placed in key locations of the scalp. The SynAmp amplifiers provide the online digital signal processing, amplification, and digitization of the EEG signals recorded from the electrodes. Also, they transfer the digitized data to the host computer. The Acquire program, which is installed in the host computer, provides the acquisition and storage of the EEG data, and displays the signals coming from each electrode in continuous mode on the screen. An illustration of the type of data acquisition is provided in .
Figure 4. Continuous EEG data recorded.
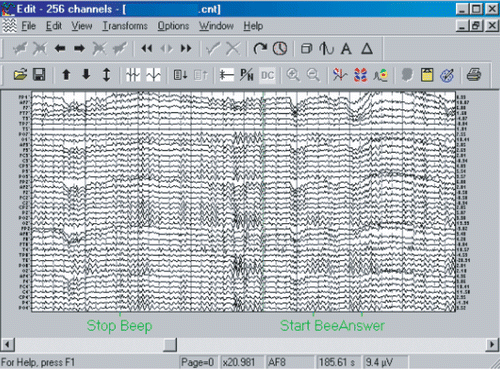
The EEG data collected was done in continuous mode using a 500 Hz sampling frequency for all subjects. The total number of electrodes used was 41 following the MCN montage Citation4. The EEG recording time for each subject was no more than 10 min. The subjects that took part in the experiment had standard requirements placed on them prior to the test. Each subject was laid down in a bed and a brief explanation about the test was given before starting with the procedure. The test administered to the subject is a standard auditory test used in behavioral medicine. The subject has to complete 34 sentences. It was required from the subject to have his/her eyes closed and to maintain the maximum possible relaxation in order to reduce the effect of artifacts in the EEG signal. Then 30–40 s of normal brain activity of the relaxed subject is recorded with the eyes closed in order to have a normal EEG behavior to be used as baseline behavior for comparative purposes. Once the EEG data was collected for all the subjects, the data was digitized in order to perform the second offline digital signal processing on the EEG data.
2.2. Algorithm development process
EEG data recorded from all the channels was initially preprocessed through the ESI-256 in order to eliminate common EEG artifacts together with the background noise. The algorithm is designed to contend with seven files, which consist of the baseline file and six auditory/answering files for each subject. The program reads the files and creates a matrix with 41 columns, where each column of a given matrix represents a digitized data recorded from a single electrode. The vertical axis thus represents all electrodes used in the experiment, and the horizontal axis displays the EEG data recorded at 500 Hz sampling frequency. A Fast Fourier Transform (FFT) is performed in these sections of the EEG data to determine the power content of the frequency bands in order to perform spectrum analysis. The resulting waveforms are displayed as a brain map, which will show the power distribution within each frequency band. In this case, the FFT is applied to six different auditory/comprehension and answering blocks of the EEG signals (these signals are obtained from the same subject, and during the same task, either listening or answering).
The algorithm integrated the following important processing steps that led to the desired results:
Step 1
Removing the DC offset of the EEG signals by subtracting the average behavior for each electrode.
Step 2
Filtering unwanted noise of the EEG signals by applying Daubechies family of wavelet functions.
Step 3
Applying the FFT in order to perform spectrum analysis.
Step 4
Averaging the 6 epochs of EEG, during auditory and response tasks in frequency and time domains.
Step 5
Subtracting the baseline of a subject from the averaged EEG signal of the auditory and answering blocks in frequency and time domains.
Step 6
Applying two algorithms on the available data. The first algorithm is an inverse region search approach that uses the standard deviation of the eigenvalues of different regions as fitness function. It locates regions in the hope that they will coincide with the doctors’ assessments with respect to which regions are more active for each different task. The second algorithm was developed to test new subjects based on the power of the frequency bands of their EEG and to establish a comparison with known patterns.
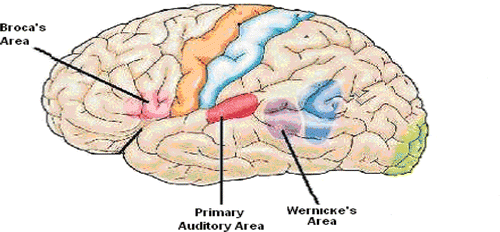
The first algorithm will try to prove how related Wernicke and Broca's brain areas are in relation to language comprehension. The localization of these regions is very important in the understanding of the results of this study. shows the different areas in charge of the auditory/comprehension process. The language comprehension area is just adjacent to auditory cortex, where the parietal lobe meets the temporal lobe. Wernicke discovered this area in 1874, by studying patients with comprehension deficits, which are called aphasias. Regions around this area have also been suggested to be involved in short time memory. Broca gave the first evidence of brain laterality and its connection with speech in 1861. He found out that a lesion in the frontal lobe of the left hemisphere limited the patient to understand speech, but on the other hand that patient had no problem talking correctly. The area described is the Broca's area, which is the cortical area in charge of language production.
Figure 5. Brain's areas involved in language/comprehension.
2.2.1. Inverse solution algorithm
The first search algorithm based its fitness function on regional EEG. The process consisted of finding the region whose EEG's eigenvalues have the highest standard deviation. Best candidate regions were usually integrated by consecutive electrodes, as depicted in . shows the region definitions used in this study.
Figure 6. Electrode placement.
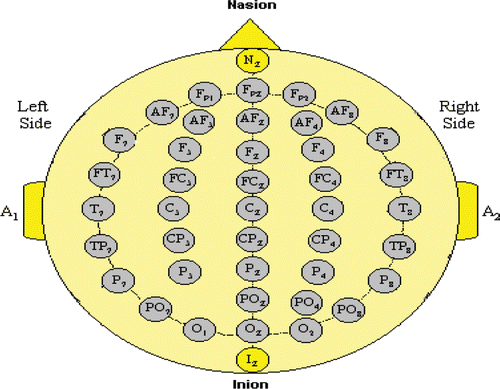
Table 1. Standard region definitions and corresponding electrodes
Initially, the EEG was stored as an N × M matrix X, where N is the number of samples and M the number of electrodes analyzed. Each matrix element xij denotes the discrete measurement taken from electrode j at time (sample) i. From this matrix, a matrix subset was constructed for each region that was created. The principal compound analysis (PCA) analysis Citation5–7 was then performed on those sub matrixes by calculating the elements of the covariance matrix C of each input matrix X (refer to equation (1)).
(1)
where
i and
j represent the means of the measurements of channels i and j. The PCA analysis was then performed based on the regional covariance matrixes.
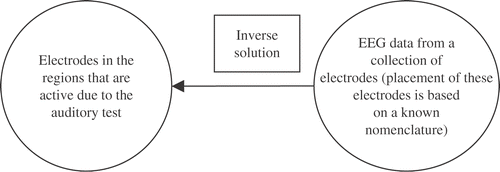
The problem can be formulated as follows: While looking at activity levels in the EEG, electrodes can be grouped differently into different sets. Each combination of sets produces a different activity pattern. This can be expressed as follows:
(2)
where AM expresses the spectrum of activity levels for the specific collection of electrode sets C, and where f represents some relationship. The problem is to find the specific collection of electrodes
that corresponds to a given activity pattern
, as follows:
(3)
where g represents the inverse relationship; i.e. given an activity mapping, the collection of electrode sets will be found which produces the expected outcome. depicts the problem.
For example, for the collection of sets shown in it is known that the highest level of activity in the auditory/comprehension test corresponds to regions 1 and 5. The inverse problem consists of finding the electrodes corresponding to these regions 1 and 5 given the EEG recordings of the test, while assuming that the highest activity will correspond to the highest standard deviation of the eigenvalues.
Figure 7. Representation of the inverse problem about finding the collection of electrode sets.
The proposed search algorithm iteratively moves a chosen number of contiguous electrodes through all possible contiguous electrode locations Ri, by displacement distances of one electrode at a time. The functional F(Ri) is the standard deviation of the eigenvalues obtained from a sub matrix Si which consists of EEG recordings corresponding to the electrodes in the current region Ri.
The displacement of the region is conducted in the four cardinal directions, following a sequence notated as E--B--N--B--W--B--S--B, where E, N, W, and S stand for east, north, west, and south, and B stands for back. As we can observe from the sequence, after the region is moved in one direction, it is sent back to the previous position and from there it continues with the next direction. This guarantees that all cardinal points surrounding a reference position are visited. Each time the group of electrodes is moved in one of the four possible directions, the functional is computed. After visiting all surrounding points of a location, the four computed functional values are compared and the highest one is used to move the region in that direction. An initial step consists in assigning to each electrode location the closest neighboring locations which approximately lie in the four cardinal directions.
The algorithm is governed by four motion operators ME, MN, MW, MS which moves all electrodes in a given region in the four cardinal directions, and a motion flag as the stopping condition during iterations.
The main steps of the search algorithm are depicted in the pseudo-code shown below:
Step 1
Initialization part
| 1. | Select a region R0 containing a small number of contiguous electrodes (between 3 and 9). The less electrodes selected, the more accurate the solutions. However, a minimum of two electrodes is indispensable to create a sub matrix S. | ||||
| 2. | Apply PCA analysis to the initial region R0 and compute its functional F(R0) (i.e. compute the standard deviation of the eigenvalues obtained from the initial sub matrix S0). | ||||
Step 2
Iteration part (simple electrode relocation)
| 1. | Set motion flag to true. | ||||||||||||||||||||||||||||||||||||||||
| 2. | While motion flag is true, do the following steps:
| ||||||||||||||||||||||||||||||||||||||||
As can be observed from the pseudo-code, the algorithm is a simplified iterative method; therefore, it does not account for local maxima in its current version. It should be also pointed out that the fewer electrodes used in the search, the more accurate solutions can be obtained; i.e., the centroid of the area covered by the electrodes is going to be closer to the area that has the highest activity during the task.
2.2.2. Subject evaluation algorithm
As a supplementary approach to improve the developed application, an algorithm for future subject evaluation was designed for evaluating the regions according to the power of the frequency bands. This step was performed by calculating the relative mean power and absolute mean voltage for each electrode in time domain and in the frequency bands (alpha, beta 1, beta 2, delta, and theta) of the different regions (), as shown in equations (4) and (5).
(4)
(5)
with
and
.
In equation (2), N is the total number of samples, X represents the voltage values for a specific band, and Y represents the voltage values for all the bands; fc1 and fc2 are the cutoff frequencies, fs is the sampling frequency, and X(w) is the vector containing the real values of the Fourier Transform. In this approach, two thresholds T1 and T2 of 1 and 2 standard deviation(s) respectively were applied in the positive and negative directions with respect to the absolute mean voltage of the signal in order to consider only those values V within the following ranges: [+T1 < V < +T2], [V > T2], [−T1 < V < −T2], and [V < −T2].
After creating specific data arrays for all subjects containing the number of active electrodes in each hemisphere and for each frequency band, a database was created to be used as a reference against to which each new subject should be compared. The criterion used for the selection of the case most similar to the test subject was the minimum energy difference criterion. The measure of similarity E between the observed behavior of an unknown subject and a behavior stored in the database are computed as shown in equation (6):
(6)
where E is the minimum energy value; two vectors are used in this formula, one for the unknown patient and the other one comes from the database. Each subject is assigned with a specific array that describes the activation in the different regions that we are analyzing. U values represent the number of active electrodes in each region for the unknown subject and frontal, temporal, parietal, central, and occipital (F, T, P, C, O) define the regions analyzed for the subjects in the database. This procedure was done with the five different frequency bands and for each hemisphere.
In this part of the application, topographical representations were performed for different testing subjects using a color-coding scheme in order to enhance locations in the brain that reflect increasing and decreasing changes.
3. Results
The results reveal that there were substantial but characterizing differences in hemispheric activation at the frontal, temporal, parietal, central, and occipital sites. Equation (7) was used to calculate the asymmetry ratio, which relates the left hemisphere to the right hemisphere.
(7)
where K is the asymmetry ratio, R is the number of electrodes active in the right hemisphere, and L is the number of electrodes active in the left hemisphere. If the ratio is negative, that means that the left hemisphere was more active than the right and vice versa if the ratio is positive. As an illustration of the results based on this asymmetry ratio, consolidates the results of the 9 patients considered out of the 15 tested by computing the centroids of activity.
Figure 8. Centroids of activity of the right and left hemispheres for all patients in terms of auditory (left) vs. response (right) phases.
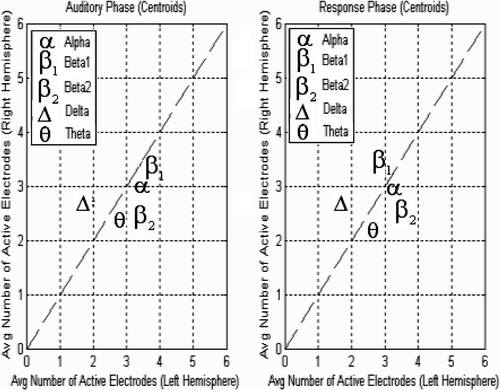
The centroids are defined in terms of the x- and y-axes for each one of the frequency bands analyzed, which correspond to the average number of electrodes found to be active in the left and right hemisphere, respectively. Note that during the auditory phase, there was more activation in the left hemisphere; nevertheless during the response phase, there was also some activation in the right hemisphere.
The frequency of EEG waves is divided into four groups of frequency bands. According to the activity level of an individual, one brain wave state may be dominant at any given time, even though all brain wave states will remain present at minimal levels, since the algorithm developed in this study is trying to interpret the most important frequency waves (delta, theta, alpha, and beta) that characterize the brain. The analysis is based on these specific frequency ranges in order to interpret the changes that occur during an auditory/comprehension task. Notice that the beta frequency is subdivided in two small ranges, so a more accurate analysis could be performed.
Illustrative examples of the results obtained in this clinical study are as shown in and . They represent EEG activity as it is during the performance of an auditory/comprehension task. These graphic results of the program are shown in order to illustrate the location in the brain with more activity during the auditory/comprehension and response phases. The black dots in the figure represent the electrodes that were positioned in the scalp. The color bar on the right side represents the voltage values. The scale of EEG amplitude goes from highest positive (red color) to the lowest negative (dark blue). In other words, the representation of different colors in the figure gives an idea of how activated the different regions were at the moment of the task. Note that there is a similar behavioral pattern of brain activity in all the subjects illustrated.
Figure 9. Illustrative frequency activities in five subjects during auditory/comprehension task. Black corresponds to red as mentioned in the text, and dark gray corresponds to blue. (Colour version available online.)
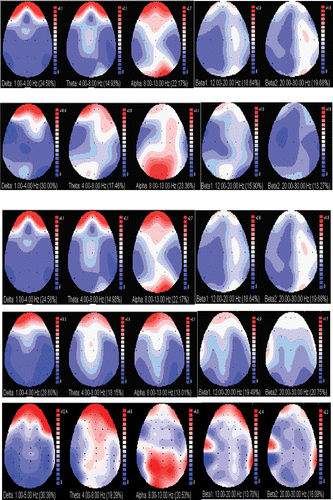
Figure 10. Illustrative frequency activities in five subjects during answer task. Black corresponds to red as mentioned in the text, and dark gray corresponds to blue. (Colour version available online.)
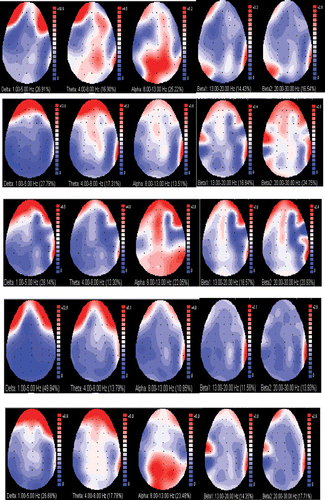
In terms of the PCA, and show the values of the standard deviation of the set of eigenvalues resultant of the different regions. Note that the highest standard deviations are located in the frontal and temporal regions respectively.
Table 2. Standard deviation of the eigenvalues of the different regions during listening task for the nine subjects
Table 3. Standard deviation of the eigenvalues of the different regions during answering task for the nine subjects
4. Discussion
From these results, it is noted that during the auditory/comprehension task, changes in the beta frequency, which is involved with mental activity, are more predominant in the left hemisphere. This corroborates the premise that the left hemisphere is associated with more logical thoughts patterns and analytical approaches to problem solving Citation2,Citation8. Changes in the delta band, the slowest frequency that is associated with less concentration, are predominant in the right hemisphere. The right hemisphere dominance is associated more with relatively less skill in articulations of thoughts. Theta frequency activity is evidently increased in the frontal region of the brain during the auditory/comprehension task. This concurred with previous research that claims that theta activity is increased during internal focus Citation3,Citation9. Evident changes of alpha activity are observed in the parietal and frontal regions of the brain. These results are in agreement with previous studies that claim that EEG alpha rhythm in response to manipulations of task practice shows activity in the frontal and parietal regions Citation10. During the answering task, it looks like the frontal region is the more active. Since Broca's area is located in the frontal lobe and it is associated with the production of language, the positive changes of most of the frequency bands are concentrated in the frontal cortex Citation11,Citation12. With respect to the decreasing changes, alpha activity seems to localize its activity in the temporal and parietal lobes of both hemispheres, even though the activity is more oriented to the left hemisphere than the right. It was established that the major activity of the brain during the processes of listening and answering was noted in the temporal and frontal lobes. It is therefore appropriate to conclude that the integration of the two methods will constitute a unified method for assessing EEG activity during a listening/answering session that conforms to earlier findings suggesting involvement of the Broca's and Wernicke's areas.
and present the general analysis of the increasing and decreasing frequency changes with respect to the mean during the auditory/comprehension and response phases (L&R stands for Left and Right).
Table 4. Final analysis (auditory phase)
Table 5. Final analysis (response phase)
5. Conclusion
The aim of this study was to identify those frequencies and regions in the brain that best characterize brain activity associated with an auditory/comprehension test. The objectives were to: (a) analyze the differences that exist between auditory/comprehension tasks versus answering phase; (b) visualize through color-coding maps the different activities of the cerebral hemispheres (right vs. left); and (c) contrast the EEG signals of any new subject included in the experimental study in order to evaluate similar/dissimilar behaviors. All of these objectives were addressed through the analysis of the changes in activity introduced for the different frequency bands; and (d) analyze the standard deviation of the principal components of predetermined groups of electrodes that represent different areas of the brain.
The results obtained reveal the following significant findings: (a) the left hemisphere was more involved with the auditory/comprehension task; (b) the frontal and temporal lobes were more involved in the auditory and answering tasks, recalling that Wernicke's area is located where the parietal lobe meets the temporal lobe and Broca's area is located in the frontal lobe; and (3) the highest standard deviation of the eigenvalues is located in the frontal and parietal areas of the brain in direct confirmation of the Wernicke and Broca areas.
The contribution of this study is in the development of a specific non-invasive technique based on EEG data that can be easily implemented in a clinical environment. Through the development of an automated algorithm, a detailed topographical study was performed and visualized in order to learn which cortical lobes of the brain are active during an oral comprehension process. Mapping the brain with non-invasive techniques produces results that are effective and may be applied to patients, without any health risks. It is this last assertion that this study has tried to attain while focusing on an oral comprehension test.
Acknowledgments
This research was supported by the National Science Foundation Grants EIA-9906600, HRD-0317692, CNS 042615 and the Office of Naval Research Grant N00014-99-1-0952, as well as the NSF Graduate Research Fellowship in support of Ms. Mercedes Cabrerizo. The support of Miami Children's Hospital is greatly appreciated.
References
- Cabrerizo, M, Adjouadi, M, Ayala, M, Nunez, K, Jayakar, P, and Yaylali, I, 2005. Integrated analysis of EEG functional brain mapping based on an auditory-comprehension process augmented through topographical maps and a new eigensystem study, Brain Topography 17 (3) (2005), pp. 151–153.
- Greenstein, B, and Greenstein, A, 2000. Color Atlas of Neuroscience, Neuroanatomy and Neurophysiology. New York: Thieme Stuttgart; 2000.
- Martini, FH, 2001. Fundamentals of Anatomy & Physiology. New Jersey 07458: Prentice Hall; 2001.
- Gevins, A, and Remomds, A, 1987. Handbook of Electroencephalography and Clinical Neurophysiology 1 (1987), pp. 309–354.
- Gonzalez, RC, and Woods, RE, 1993. Digital Image Processing. Reading, MA: Addison-Wesley Publishing Company Inc.; 1993.
- Duda, RO, Hart, PE, and Stork, DG, 2001. Pattern Classification. New York: John Wiley & Sons Inc.; 2001.
- Proakis, JG, and Dimitris, GM, 1996. Digital Signal Processing – Principles, Algorithms and Applications. Englewood Cliffs, NJ: Prentice Hall; 1996.
- Segalowitz, SJ, 1983. Two Sides of the Brain: Brain Lateralization Explored. Englewood Cliffs: Prentice-Hall Inc.; 1983.
- Matsuoka, S, 1990. Theta rhythms: states of consciousness, Brain Topography 3 (1) (1990), pp. 203–207.
- Lokhorst, GJC, 1996. The first theory about hemispheric specialization: fresh light on an old codex, Journal of the History of Medicine and Allied Sciences 51 (3) (1996), pp. 293–312.
- Inouye, T, Ishihara, T, and Shinosaki, K, 1995. Mathematically derived frequency correlates in cerebral function: theoretical and clinical implications for neurofeedback training, Journal of Neurotherapy 1 (2) (1995), pp. 1–15.
- Gevins, A, and Smith, ME, 2000. Neurophysiological measures of working memory and individual differences in cognitive ability and cognitive style, Cerebral Cortex 10 (2000), pp. 829–839.