Abstract
To monitor lungs, a real-time device based on applied potential must be able to detect conductivity variations in any area (cm2) inside the thorax at each 40 ms. An image, that represents the conductivity distribution of a transversal slice of the thorax, is reconstructed based on applied current and voltage measurements on the boundary. The quality of the image is strongly related with the total number of electrodes and regularization techniques. In this work, the total number of independent measurements is improved by an interpolation scheme applied to the measured voltages, to simulate extra electrodes and preserve the dipole model for electrical potential. Comparison parameters are the object position and maximum conductivity of the reconstructed image. The technique is applied to experimental and simulated data using backprojection algorithm, demonstrating a significant improvement of the images. Only a neighborhood filter is applied to all images to enhance the backprojection reconstruction.
1. Monitoring mechanical ventilation
Approximately 250,000 patients per year, under intensive care, are submitted to mechanical ventilation. Most commercial ventilators represent the patient–ventilator system by a single-compartment model, one gas-exchange region attached to a nondistensible airway Citation1. Measurements of O2 and CO2 level, elastic and resistive pressures which are, respectively, proportional to the total volume and air-flow injected during each respiratory cycle, can describe only global conditions. It means that the complexity of the pulmonary tree and local dynamics cannot be detected. However, the effective participation of any structure during respiratory cycle is defined by local critical pressures: the minimal pressure necessary to open a terminal branch or alveolar sac; a continuous support pressure to guarantee that the structure will remain opened during inspiration period; the maximal pressure that could be applied without causing any damage to the structure. Depending on physiological condition, the applied pressure can open or damage a structure. This is particularly critical in long periods of assisted ventilation Citation2,Citation3.
Computerized tomography detects these local phenomena, but radiation imposes severe restriction to this technique for continuous use. Electrical impedance tomography (EIT) is a noninvasive technique able to detect variations of electrical properties of different structures as tissues, blood, bones, air, etc. that has being improved in the last 20 years and tested for clinical applications. It can be used to distinguish dead from living tissues, to detect breast cancer, to distinguish intracellular versus extracellular fluid (premenstrual syndrome) Citation4. Some dynamical applications are: monitoring cardiovascular function, digestive system, internal bleeding, changes in intrathoracic fluid volumes and lung conditions under assisted ventilation Citation5. Particularly, the EIT has been demonstrated to be a consistent and stable technique for monitoring lung local conditions Citation6,Citation7.
Even with a large number of medical applications and many advantages, improvements in the apparatus are still in course. The main hardware improvements include electrode and computational technology, precision of current source and voltage measurement equipments. Software improvements involve the development of stable, convergent and consistent algorithms to solve the extremely ill-posed inverse problem Citation8.
In this work, the total number of independent measurements is improved by an interpolation scheme applied to the measured voltages. The interpolation is applied to different configurations of current injection and voltages measurements. The injection–electrode pair is defined assuming that the dipole model for the electrical field could be applied. Reconstructed images, running backprojection algorithm through the equipotential line of the dipole model, are used to compare different configurations. Comparison parameters are object position and maximum value conductivity of the reconstructed image.
Section 2 introduces the mathematical model and the equations of the reconstruction algorithm. Section 3 shows the interpolation scheme. In section 4 results are shown with simulated and experimental data.
2. Poisson equation with Neumann condition and the reconstruction algorithm
In EIT, an image of a transversal slice of the thorax is represented by the distribution conductivity inside the domain, knowing applied currents and measured voltages in the boundary. In bipolar injection–voltage configuration, two electrodes are used to apply the current and the other two to measure the difference of voltages. The total number of independent measurements depends on the number of electrodes and on the configuration defined for injection and data acquisition Citation9. In general, injection–voltage scheme is fixed in hardware configuration.
Considering N equally spaced electrodes positioned in the contour of the region of interest, a complete set of bipolar adjacent configuration measurement gives N(N − 3)/2 independent measures. Other nonadjacent configurations can be used with the benefit of improving the signal to noise ratio, even with a reduction of the total number of independent measurement Citation10. However, the adjacent configuration fits better in the electric dipole hypothesis: two equal electrical charges with opposite signals near each other. Therefore, to preserve the dipole model for other configurations, the distance between the injection pair must be reduced. The interpolation scheme used in this work simulates the existence of new electrodes in the boundary for all bipolar configurations, preserving the dipole conditions for the backprojection algorithm.
Beginning with electromagnetism classical equations, restrictive hypotheses are introduced to linearize the problem: the thorax is represented by the unitary circle Ω, the phenomenon is static, no internal currents or magnetic field are considered. For boundary conditions, the applied current ψ is normal to the surface. Assuming also that a small perturbation δu in the boundary voltages corresponds to a small perturbation δσ in the conductivity, and δσ ≈ 0 near the dipole, the linearized problem is defined by Poisson's equation with Neumann condition:
(1)
For each injection pair, the boundary voltages are propagated through the equipotential lines defined by the dipole model in a homogeneous medium. As the current is applied in turn in all pairs of electrodes, the final image is a composition of N images, each one related to one dipole. The reconstructed image represents a small perturbation of the homogeneous image.
The electrical potential u in a point x of the domain is defined as the first-order approximation of the superposition of the potentials generated by each charge:
(2)
where
∈ Ω,
is the dipole location and the vector is such that
and
represent, respectively, the positions of the positive and negative charges. In complex domain, the first-order term of the potential is obtained by the truncated Taylor's series in the neighborhood of z = 0:
(3)
with the dipole hypothesis defined by
.
The real and imaginary parts of U are, respectively ud and vd. Considering
(4)
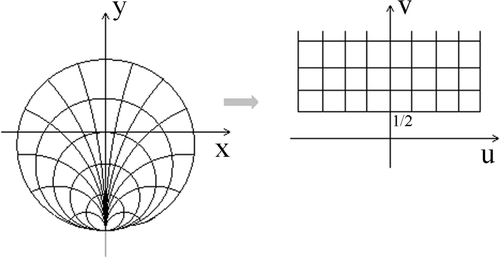
the circular domain Ω is mapped into the semi-plane {ud, vd}, where vd > 1/2 and the boundary ∂Ω is mapped into vd = 1/2.
The transformation (4) is represented in . Equipotential voltages and current lines are defined, respectively, by constant values of ud and vd:
(5)
being the π/2 counterclockwise rotation of
.
In backprojection classical formulation Citation11, the values of voltages measured at the boundary are projected through the equipotentials ud weighted by vd. In these variables the linearized problem is:
(6)
Integrating the first equation in (6) and introducing the boundary condition, the perturbed conductivity δσ relative to the dipole d is:
(7)
The hypothesis δσ ∼ 0 near the dipole d is clearly not verified. An approximate value of δσ is given by the integral:
(8)
Equation (9) shows the first term of equation (8) in function of the counterclockwise tangential derivative ∂/∂T of δud normalized by the same derivative of ud.
(9)
W represents the ratio of the potential variation between the perturbed and homogeneous medium. This value is propagated through the equipotential s which originates in d and contains x, a pixel inside Ω. The weight function φ is a linear function of vd Citation12:
(10)
The uniqueness of the solution is guaranteed only for special cases of continuous boundary conditions Citation13,Citation14. Increasing the number of independent measures by simulating new electrodes approximates the discretized to the continuous problem.
To obtain a discrete version of (8) consider N + 1 positions in the unitary circle given by:
(11)
where
and d0 = dn (the domain is periodic). Integrating by trapezoidal rule, an approximation of B(x) is
(12)
To calculate the discrete values of W in (12), it is necessary to calculate the intersection xf(x, d) between s and ∂Ω. Even if the dipoles are equally spaced in ∂Ω, the x f(x, d) distribution is not homogeneous in the boundary except if x is at the origin (0, 0). Using central differences to calculate
and
based on measurements of voltages in the electrodes, any value of W is calculated by cubic spline interpolation Citation15. This technique can be applied to any patterns of current injection and voltage measurement configuration.
3. Interpolating electrodes and dipoles
Consider N as the total number of electrodes evenly spaced and fixed in ∂Ω. To define a current–voltage configuration we introduce the notation IkVj. The index k, k = 0, 1, 2, 3, identifies the injection pair {Ei1, Ei1+k}. The index j, j = 0, 1, 2, … , 6, identifies the pair of electrodes {Ei2, Ei2+j} where the difference of voltages is measured. The index i1 and i2, varies from 1 to N imposing that Ei2 ∩ {Ei1, Ei1+1, … , Ei1+k} and Ei2+j ∩{Ei1, Ei1+1, … , Ei1+k} are null. The limits of k and j are defined considering two aspects: the number of electrodes present in experimental prototypes and the distance between the electrodes of the drive pair.
If k ≠ j, the total number of independent measurement is given by N(N − 3 − k − j) otherwise by (N/2)(N − 3 − k − j) if k = j because of the reciprocity theorem. Image quality is directly related to the total number of electrodes. From 16 to 128 electrodes, the adjacent–adjacent scheme I1V1 goes from 88 to 7877 independent measurements. Unfortunately, because of hardware limitations, it is not possible to introduce as many electrodes as we need.
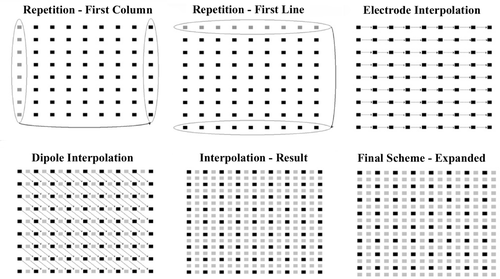
The purpose of this work is to simulate the existence of new electrodes in order to improve the number of independent measurement and to preserve the dipole model even in nonadjacent configurations. The concept is not to restrict to interpolate values of voltages in W. Considering a complete set of measurements the discrete values of W can be represented by a matrix Wk,i. Each row represents the values of voltages related to a specific current–injection pair. Each column represents the successive values of difference of voltages measured in each electrode. Columns and diagonals interpolation represent, respectively, the introduction of new electrodes and new dipoles.
A complete interpolation scheme is shown in . As the algorithm computes all the measurements in function of the drive pair, the interpolation must take this into account. In Wk,i, the interpolation in diagonal must be done in advance to preserve the drive pair reference; after that complementary interpolation is done. A finite difference backprojection algorithm uses the expanded matrix WEXP instead of the original W in which only voltages are interpolated Citation16.
The advantage of this scheme is the improvement of the image quality with the introduction of a significant number of simulated dipoles without any structural modification in backprojection algorithm.
4. Tests: simulated and experimental data
In general, the current configuration I1 is fixed in the prototype. To test the interpolation scheme, for any current–voltage configuration, it is necessary to generate simulated data. A set of absolute boundary voltages is obtained by solving the direct problem, using a finite element method, assuming a known distribution of conductivity and applied currents of 1 mA, normal to the surface. For a fixed k (k = 0, 1, 2, 3), a complete set of voltages is obtained applying currents successively in all pairs of electrodes {Ei, Ei+k}, for i = 1, … , N. These voltages are used to calculate the differences of voltages defined in the configurations Vj, j = 0, 1, … , 6, which will be used in backprojection algorithm.
For each Ik (k = 0, 1, 2, 3), three different test images are reconstructed using the backprojection algorithm, adapted to Vj (j = 0, 1, … , 6) configuration. The images consist of a circular object of radius 0.07 cm positioned inside a circular tank of radius 1 cm at the distances of 0.75, 0.50, and 0.22 cm from the centre. In this case, the distances are relative and nondimensional. The medium conductivity is constant equal to 1 and the object conductivity is 0.002.
Experimental data is obtained only for the I1V1 configuration in a circular tank of radius 15 cm filled with saline solution and an acrylic cylinder of radius 1 cm positioned at 9 cm from the centre of the tank. The comparison between different configurations is made using the maximum value of reconstructed conductivity and the cylinder's centre position.
4.1. Comparing maximal conductivity
represents the maximal conductivity value for IkVj, k = 0, 1, 2, 3 and j = 0, 1, … , 6. Objects 1, 2, 3 represent, respectively, positions 0.75, 0.50, and 0.22 cm from the centre. In order to help the identification of the discrete configurations IkVj, the results are presented as continuous lines. In the y-axis, the values of maximal reconstructed conductivity are represented by σmax. In the x-axis, the voltage values are Vj, j = 0, 1, … , 6. The injection patterns I0, I1, I2, and I3 are represented by solid, dot, dash, and dash-dot lines, respectively.
Figure 3. Maximum values of conductivity for IkVj, k = 0, 1, 2, 3 and j = 0, 1, … , 6, considering three positions of the same object. From the left to the right, Object 1, 2, 3, corresponds to 0.75, 0.5 and 0.22 cm positions, respectively.
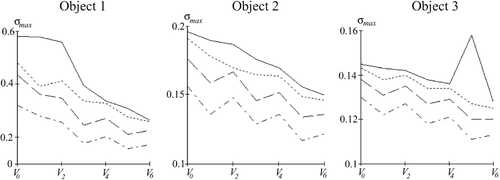
By the characteristics of the problem, the maximum conductivity value is smaller if the object is near the centre of the domain. This is observed for any IkVj combination. As expected, the adjacent current injection I0 gives the greatest values for conductivity independent of the voltage configuration. For objects near the boundary the configurations I0V1, I0V2, and I0V3, give, approximately, the same value for maximal conductivity, suggesting that the hardware configuration can be chosen by the best signal to noise ratio. The maximum value at I0V5 configuration is observed also in other simulations when the object is near the centre. It can be explained by the poor resolution of the reconstruction in central regions.
4.2. The position of the centre of the reconstructed object
Considering the same three positions of the object, for each pair IkVj, k = 0, 1, 2, 3 and j = 0, 1, … , 6, the distance between the centre of the reconstructed object and the centre of Ω is calculated. We adopt the following notation for figures . Dash line indicates the cylinder's centre position in the original image, y-axes the distance between the center of Ω and the reconstructed image, x-axes the voltage Vj, j = 0, 1, … , 6. The injection patterns I0, I1, I2, and I3 are represented by cross (+), dot (•), square (□) and diamond (⋄), respectively.
Figure 4. Reconstructed object relative to the original position located 0.75 cm from the centre of Ω.
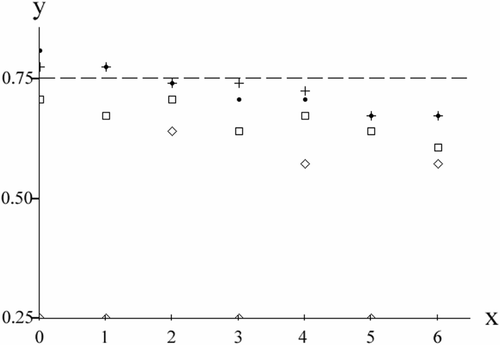
In , the object is positioned 0.75 cm from the centre and the configurations I0V2, I1V2 give the best results followed by I0V1, I1V1. In , the object is positioned 0.50 cm from the centre and I1V3 gives the best result.
Figure 5. Reconstructed object relative to the original position located 0.50 cm from the centre of Ω.
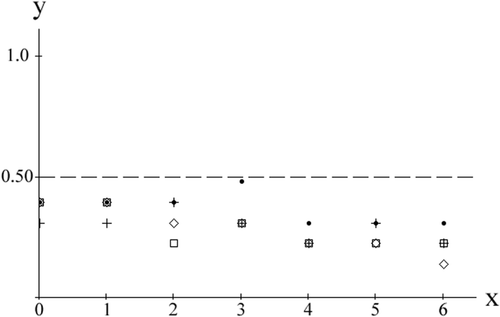
Finally, in the object is positioned 0.22 from the centre and many configurations reconstruct the image near the original position.
Figure 6. Reconstructed object relative to the original position located 0.22 cm from the centre of Ω.
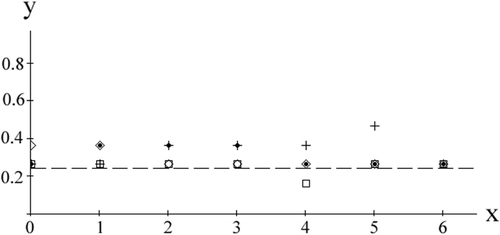
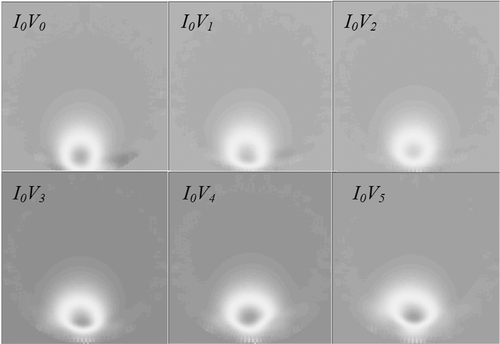
In this last case, as the object is near the central region of the domain, any reconstructed image is diffused independent of the configuration. The same results are observed for at least two different configurations of IkVj. For instance, it is not possible to distinguish between IkV0, for k = 0, 1, 2. The degeneration of the image occurs in two situations, when k became large and violates the dipole model or j≫k.
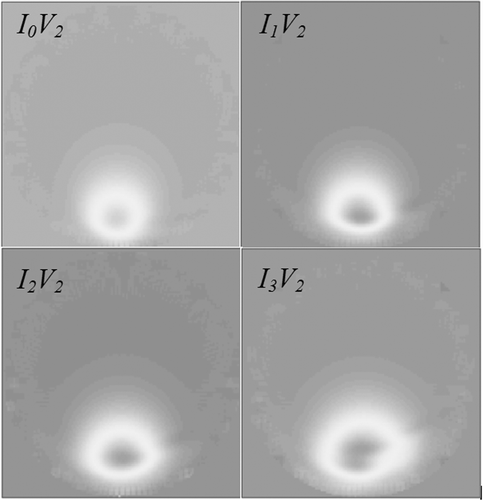
In , the drive pair is fixed in the adjacent configuration and the degeneration is observed for j > 2. shows a sequence IkV2 for k = 0, 1, 2, 3, for the cylinder positioned 0.75 cm from the centre, demonstrating the degeneration when the distance between the injection pair violates the dipole hypothesis.
4.3. Reconstructed images from experimental data
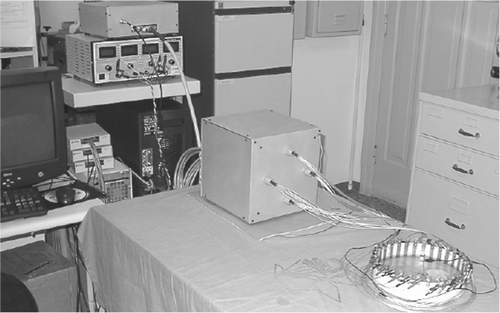
As the current injection pattern goes from adjacent (k = 0) to interleave 3 (k = 3), the dipole hypotheses become critical. On the other hand, the hardware must improve signal-to-noise ratio. Considering these two aspects, a prototype was developed using 30 electrodes and I1V1 current–voltage fixed configuration, which produces a signal-to-noise ratio of the difference of voltages close to 10–4. In this case, the interpolation scheme is applied only for I1V1. shows the prototype and the tank with 30 electrodes connected to it.
Figure 9. Prototype with 30 electrodes developed by Polytechnic School and Medical School of University of São Paulo.
Beginning with N = 30, shows a sequence of the reconstructed image of a cylinder, located at 9 cm from the centre of tank filled with saline solution. The reconstructed image with 30 original electrodes is on the left and interpolation of 60 and 120 electrodes on the middle and right, respectively.
Figure 10. Experimental data reconstruction. Cylinder of radius 1 cm positioned 9 cm from the centre of Ω. From left to right, 30 original, 60 and 120 interpolated electrodes, respectively.

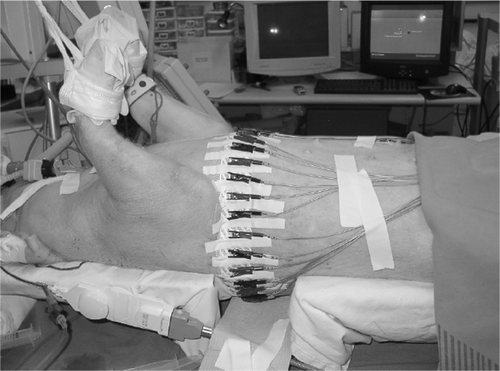
shows the data acquisition of a pig during assisted ventilation. The electrodes are evenly spaced in the surface of a transversal slice of the thorax of the pig.
The sequence in represents six instants of the inspiratory cycle. The upper left image shows the beginning of the respiratory cycle, when the mechanical ventilation is trigged. The right bottom image shows the end of the inspiratory cycle, when both lungs are filled with air.
Figure 12. Sequence of one inspiratory cycle of a pig during assisted ventilation using 120 interpolated electrodes scheme. Upper left and bottom right are, respectively, beginning and end of the inspiratory cycle.
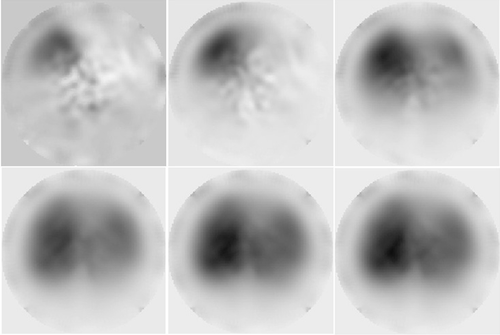
An important remark is that the intermediate images captured the damage in the left lung, which causes the delay during recruitment maneuver. Excluding the first two frames, the heart region is clearly identified in the brightest region inside the left lung.
From acquisition data to reconstructed frame the complete process take about 0.03 s to run using only the 30 original electrodes and 0.12 s when maximal interpolation is used, running in a Pentium IV processor, 2.0 GHz, 512 MB RAM.
5. Conclusions
The image quality obtained by an electrical impedance device is strongly dependent on the number of independent measurements. In this work, this number is increased using an interpolation scheme that simulates the introduction of new electrodes and in consequence new dipoles in the boundary. An important advantage of this technique is the possibility to recover the dipole model hypothesis from various current–voltage hardware configurations. Backprojection algorithm is prepared to handle with many different current–voltage configurations that are usually fixed in hardware.
The introduction of new electrodes and dipoles is tested with simulated and experimental data obtained by a prototype with fixed I1V1 configuration. Using simulated data and this interpolation scheme, qualitative results demonstrate that the adjacent injection pattern that can recover the dipole model is not unique. Comparing the maximal value of conductivity, the adjacent configuration gives the best results for any Vj, j = 0, 1, … , 6. However, configurations as I1V2, I1V1, I1V3, give the reconstructed image location more precisely when compared with the adjacent–adjacent one.
For real-time applications, it is necessary to run 24 frames per second. The 120-electrode interpolation scheme runs three times slower than the 30-electrode one, indicating that improvements in the code must be done to reduce the computational time.
For experimental data, an improvement of the cylinder contour is observed as the number of electrodes goes from the original 30 to the interpolated 60 or 120. The 120-interpolated scheme demonstrated the ability to detect physiological differences between lungs and to identify the heart region, during assisted ventilation.
Acknowledgements
The numerical calculations were performed using computing equipment supported by FAPESP under grant number 2001/05303-4. The authors would like to thank the researchers of Medical School of University of São Paulo, for the access to experimental data.
References
- Salmon, RB, Primiano Jr, FP, Saidel, GM, and Niewoehner, DE, 1981. Human lung pressure-volume relationships: alveolar collapse and airway closure, Journal of Applied Physiology 51 (2) (1981), pp. 353–362.
- Amato, MBP, Barbas, CSV, and Carvalho, CRR, 1998. Protective ventilation for the acute respiratory distress syndrome, New England Journal of Medicine 339 (1998), pp. 196–199.
- Amato, MBP, Barbas, CS, Medeiros, DM, Magaldi, RB, Schettino, GP, Lorenzi-Filho, G, Kairalla, RA, Deheinzetin, D, Munoz, C, Oliveira, R, Takagaki, TY, and Carvalho, CRR, 1998. Effect of a protective-ventilation strategy on mortality in the acute respiratory distress syndrome, New England Journal of Medicine 338 (1998), pp. 347–354.
- Holder, D, 1993. Clinical and Physiological Applications of Electrical Impedance Tomography. London: UCL Press; 1993.
- Campbell, JH, Harris, ND, Zhang, F, Brown, BH, and Morice, AH, 1994. Clinical applications of electrical impedance tomography in the monitoring of changes in intrathoracic fluid volumes, Physiological Measurement 15 (1994), pp. A217–A222.
- Hinz, J, Neumann, P, Dudykevych, T, Anderson, LC, Wrigge, H, Burchardt, H, and Hedenstierna, C, 2003. Regional ventilation by electrical impedance tomography–a comparison with ventilation scintigraphy in pigs, CHEST 124 (2003), pp. 314–422.
- Frerichs, I, Hahn, G, Schiffmann, H, Berger, C, and Hellige, G, 1999. Monitoring regional lung ventilation by functional electrical impedance tomography during assisted ventilation, Annals of the New York Academy of Science 873 (1999), pp. 493–505.
- Borcea, L, 2002. Electrical impedance tomography, Inverse Problems 18 (2002), pp. R99–R136.
- Tang, M, Wang, W, Wheeler, J, McCormick, M, and Dong, X, 2002. The number of electrodes and basis functions in EIT image reconstruction, Physiological Measurement 23 (2002), pp. 129–140.
- Avis, NJ, and Barber, DC, 1994. Image reconstruction using non-adjacent drive configuration, Physiological Measurement 15 (1994), pp. A153–A160.
- Barber, DC, and Brown, BH, 1984. Applied potential tomography, Journal of Physics E–Scientific Instruments 17 (1984), pp. 723–733.
- Santosa, F, and Vogelius, M, 1990. A backprojection algorithm for electrical impedance image, SIAM Journal of Applied Mathematics 50 (1) (1990), pp. 216–243.
- Nachman, AI, 1996. Global uniqueness for a two-dimensional inverse boundary value problem, Annals of Mathematics 143 (1996), pp. 71–96.
- Calderón, A.P, 1980. "On an inverse boundary value problem". In: Seminar on Numerical Analysis and its Applications to Continuum Physics. Rio de Janeiro: Brazilian Mathematical Society; 1980. pp. 65–73.
- Bevilacqua, JS, and Yoshikawa, RM, 2003. "Interpolated data in conductivity domain reconstruction: comparison between Fourier and cubic spline technique". In: Proceedings of the 17th COBEM International Congress of Mechanical Engineering. Brazil: São Paulo; 2003, 10–14 November.
- Yoshikawa, RM, 2005. Images from applied potential tomography. Dissertation–Master's degree. Brazil: Institute of Mathematics and Statistics, University of São Paulo; 2005.
