Abstract
In the present study, a steady-state inverse heat conduction problem is solved by using the conjugate gradient method to estimate the two-dimensional thermal resistance distribution of die-attach materials. The thermal performance of such interface materials is crucial for reliability issues in microelectronics. The spatial distribution of the thermal resistance is obtained from temperature measurements on the upper face of a semiconductor chip. Numerical experiments are performed by simulating infrared thermography measurements. The heat source configuration on the semiconductor chip and the measurement errors are investigated. Finally, the inverse algorithm is improved to decrease the computation time of the identification and to determine the refinement level of the searched distribution.
1. Introduction
Interface materials (adhesives, soft and hard solders, etc.) are used as die-attach layers of power integrated circuits. Thermal properties of these interfaces play an essential role on the temperature of semiconductor junctions and have consequently a strong impact on reliability and cooling performance. The existence of defects (voids, cracks, delaminations) introduces thermal resistances that lead to temperature drops through the interfaces. Thus, interface thermal phenomena are at the origin of a large part of the overheating of the device and may induce the presence of hot spots.
Thermal resistance of die-attach materials is usually represented by one parameter by assuming uniform distribution at the interface. This single parameter has been estimated in numerous thermal characterizations of electronic systems. For instance, Gatto Citation1 measured the thermal resistance of adhesives interfaces used in hybrid power components. Prasher et al. Citation2 investigated the thermal resistance of phase change materials (PCM) in an actual central processing unit (CPU) heat sink installation. But in practice, possible interface defects are not uniformly distributed and their location influences the temperature of the semiconductor chip. The origins of defects are various: voids in solder joints are usually induced during manufacturing whereas cracks and loose corners appear during operation because of thermal and mechanical stresses. There have been several experimental studies on defect detection through die-attach materials, but they generally provide qualitative information about the location of the defects and not the spatial distribution of the thermal resistance. X-ray radiation Citation3 and ultrasonic scanning Citation3 have been employed to test large samples. Infrared thermography has been widely used as a temperature measurement method for non-destructive testing generally not related to an identification process of the thermal resistance distribution Citation4, Citation5. Kurabayashi and Goodson Citation6 measured the thermal resistance distribution of die-attach materials using the scanning photothermal imaging, but several approximations have been made about the thermal model. Concerning the characterization of composites with delaminations, Bendada et al. Citation7 reconstituted a non uniform interface thermal resistance but it concerns a one-dimensional profile. Finally, an identification technique is needed to precisely estimate the spatial distribution of the thermal resistance of die-attach materials in order, for example, to assess the quality of new attachment materials or to provide data that could be imported into Finite-Element simulations of microelectronic devices.
The objective of this article is to develop a suitable inverse methodology to determine the thermal resistance distribution of a die-attach material through a non-destructive experiment. The direct problem is based on a semi-analytical thermal model that solves the 3D heat conduction equation in steady state conditions through a two-block electronic device that supports several heat sources. A spatial distribution of the interface thermal resistance between the two blocks can be considered. The inverse problem consists in minimizing a functional that links the calculated and the measured temperatures at the top of the device. An iterative process based on the conjugate gradient method (CGM) is used for the minimization of this functional. A quite detailed grid of temperatures is assumed to be known thanks to infrared thermography to simulate the temperature measurements. A sensitivity analysis is conducted to show the influence of the heat source configuration on the inverse calculation. The measurement errors are also investigated by using noisy simulated experimental data. At last, some improvements of our inverse method are presented in order to reduce the computation time and to find the refinement level of the searched distribution.
2. Direct problem
2.1. Physical problem
Let us consider the problem of a semiconductor chip (block 1) attached to a heat spreader (block 2) as shown in .
Figure 1. Semiconductor chip attached to a heat spreader.
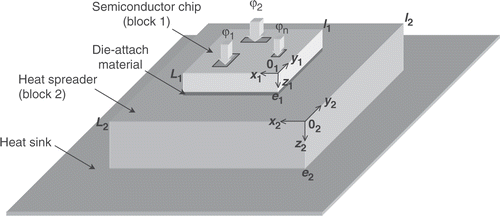
The upper face of the semiconductor chip is submitted to a set of n heat sources due to the heat dissipation of elementary electronic components (transistors, diodes, thyristors, etc.) The whole device is supported by a large heat sink whose temperature T∞ is uniform thanks to a cooling system (radiator, heat pipe, etc.). The boundary condition on the lower face of the heat spreader is defined by a thermal contact resistance Rc that characterizes the contact between the heat spreader and the heat sink (thermal grease, etc.). The interface between the two blocks is typically composed of a die-attach material suitable for the cooling of microelectronic devices: adhesive, soft or hard solder, thermal grease, PCM, composite, etc. This interface is much thinner than the other layers and is usually represented in simulations by an interface thermal resistance denoted by Rint. This approach consists in considering the thickness of the interface as zero and replacing it by a temperature field discontinuity. The interface thermal resistance is not uniformly distributed because of the presence of defects.
2.2 The multi-block decomposition technique
The mathematical formulation of the steady state heat conduction problem corresponding to the physical problem described in section 2.1 is given as follows:
(1)
(2)
(3)
(4)
(5)
(6)
(7)
where Ti is the temperature in the block i, Li, li and ei are respectively the length, width and thickness of the block i, λi is its thermal conductivity, ϕup1 is the prescribed heat flux density distribution related to the electronic component configuration on the upper face of the block 1. The solution of the direct problem is based on a multiblock decomposition technique Citation8. The method is given for a two-block configuration and can be extended to a n-block configuration. The two blocks of different size are considered separately and an iterative process is performed to determine the boundary conditions at the interface between them.
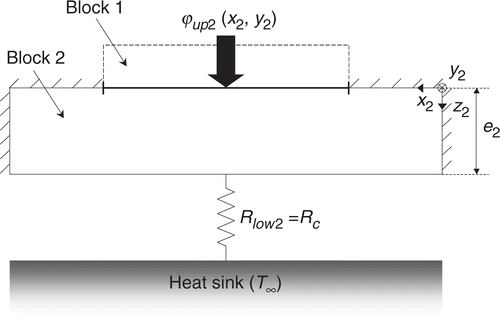
First, let us examine the thermal conditions at the chip boundaries (block 1, ). The heat flux density distribution ϕup1(x1, y1) is prescribed on the upper face (z1 = 0). On the lower face (z1 = e1), a non-uniform third kind condition links the local temperature T1(x1, y1, e1) to the uniform temperature reference T∞ by introducing a distributed parameter, homogeneous to a local thermal resistance in Km2 W−1 and denoted by Rlow1(x1, y1; ϕup1(x1, y1)) Citation8. This parameter represents the local thermal resistance of the elements (interface and block 2) between the lower face of the block 1 and the heat sink. It also directly depends on the shape of the heat flux stimulation ϕup1(x1, y1). Note that the classical assumption of lateral insulated boundaries is used Citation9. The heat spreader boundary conditions are given in . Because of the continuity of the heat flux density, the heat flux distribution ϕlow1(x1, y1) on the lower face of the block 1 is equal along the interface to the heat flux density ϕup2(x2, y2) on the upper face of the block 2. Zones that are not covered by the block 1 are considered insulated (ϕup2(x2, y2) = 0). The lower boundary condition (z2 = e2) is given by a thermal resistance Rlow2 = Rc equal to the thermal contact resistance with the heat sink. Rc is assumed to be known and uniform. Therefore, the modeling equations of the temperature field for each block take similar forms such as (i = 1 or 2):
(8)
(9)
(10)
(11)
(12)
Figure 2. Thermal boundary conditions considered for the block 1 in multiblock decomposition (cross-sectional view).
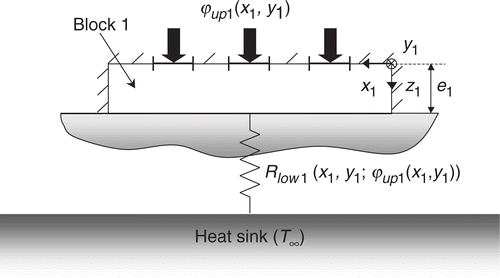
Figure 3. Thermal boundary conditions considered for the block 2 in multi-block decomposition (cross-sectional view).
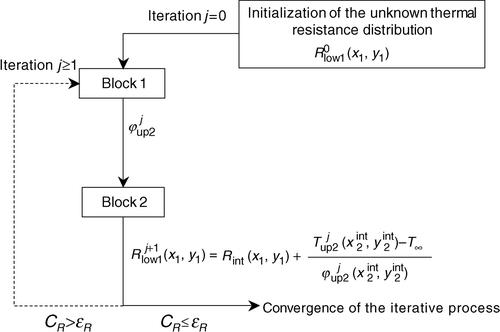
The method to solve the direct problem consists in developing an iterative process that connects thermally the two blocks and determines the unknown boundary conditions at the interface, that is to say Rlow1 for the block 1 and ϕup2 for the block 2.
2.3. One-block solution using the thermal quadrupole method
In this section, equations (11–15) are solved by considering the boundary conditions in equations (14) and (15) as being known. The thermal quadrupole method based on integral transforms is used Citation9. A Fourier space transform is applied to (11–15) to link the temperature-heat flux density spectrum vectors on the upper face of the block to the corresponding vectors at the heat sink (the block suffix i is omitted to simplify expressions):
(13)
where
(14)
and
(15)
with
and
the double Fourier cosine transforms of the temperature T and the heat flux density ϕ:
(16)
(17)
Here, n and m are respectively the n-th and m-th harmonics in the x and y directions. N and M are the corresponding truncation orders. αn and βm are the eigenvalues in the x and y directions:
(18)
A, B, C and D are square diagonal transfer matrices. A is given by:
(19)
with
(20)
B, C and D are calculated the same way with:
(21)
γn,m depends on the eigenvalues αn and βm and is given by:
(22)
I is the identity matrix whose size is the total of harmonics kept ((N + 1)(M + 1) × (N + 1)(M + 1)).
is a convolution matrix with the same size that depends on the thermal resistance distribution Rlow(x,y). The calculation of the analytical coefficients of
requires a discretization of the lower face of the block. This face is typically discretized into a regular grid of 30 × 30 points to achieve accurate results. The details of this calculation are given in Citation9.
This formulation leads to the assembly of a set of equations with two unknowns: the spectrum vector of the temperature on the upper face of the block and the spectrum vector of the heat flux density at the heat sink
. Indeed, the heat flux density distribution on the upper face of the block is known (ϕup) as well as the temperature of the heat sink (T∞). Note that this solution procedure requires to invert a (N + 1)(M + 1) × (N + 1)(M + 1) matrix. Once these two unknown spectra have been computed, the return to the space domain is carried out by using the following inverse expression (for the temperature for example):
(23)
where Nn,m is the norm of the scalar product:
(24)
2.4. Iterative algorithm for the two-block configuration
The iterative algorithm is based on the analysis of the thermal resistance Rlow1 between the lower face of the block 1 and the heat sink Citation8. It shows that Rlow1 at each point of the interface is given by the sum of two terms:
(25)
where
are the axes associated to the block 2 that concern the points at the interface. The interface thermal resistance distribution Rint is known in the direct problem. Equation (28) ensures temperature discontinuity through the interface and connects thermally the two blocks. It is used in an original iterative algorithm to determine the effective distributions Rlow1 and ϕup2.
The process is initialized by setting an initial distribution . Thus, the heat flux density distribution on the lower face of the block 1 is obtained by solving the heat conduction problem for i = 1 thanks to the solution presented in section 2.3. This distribution is prescribed into the upper face of the block 2 (
) because of the continuity of the heat flux density through the interface. Then the heat conduction problem in the block 2 can be solved and leads to the temperature distribution
to compute a second distribution
that can be approximated according to equation (28) by:
(26)
This calculation loop is repeated until the convergence of the distribution
is achieved. The convergence of this iterative procedure is tested by comparing two successive distributions. It is achieved if the following criterion is satisfied:
(27)
where
and
are the number of nodes that discretize respectively the x1 and y1 axes,
is a small-specified number that ensures the convergence (typically 10−3, Citation8). The detailed principle of the iterative process is given in .
Figure 4. Principle of the iterative process for solving the 3D steady-state heat conduction direct problem.
2.5. Validation of the direct problem
The thermal model is validated by simulating a Gallium–Arsenide (GaAs) chip attached to a Copper–Tungsten (CuW) heat spreader and comparing the results with those given by the Finite-Element code Comsol®. The device is described in and . The contact between the block 2 and the heat sink is assumed to be perfect (Rc = 1.10−10 Km2 W−1). The die-attach material is supposed to be an adhesive with a lack of contact in one corner, the corresponding thermal resistance distribution is simulated by a sinusoidal function ().
Figure 5. Heat source configuration on the upper face of the block 1 for the validation of the direct problem.
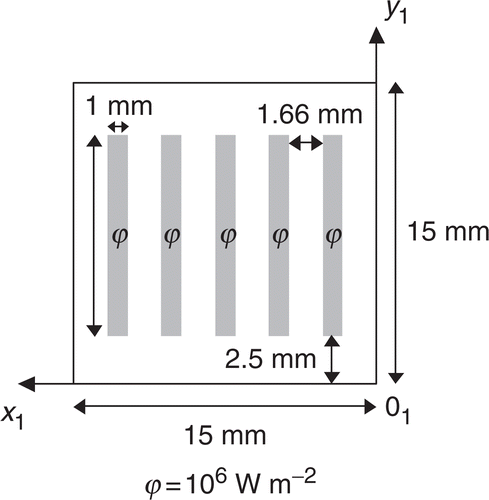
Figure 6. Interface thermal resistance distribution (K m2 W−1): Rint(x1,y1) = 0.5 × sin(x1.y1) − validation of the direct problem.
Table 1. Thermal properties and dimensions of the microelectronic device for the validation of the direct problem
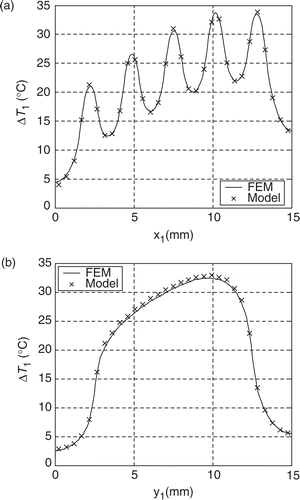
shows temperature profiles (ΔT1 = T1 − T∞) on the upper face of the chip. This solution required 10 iterations of the iterative algorithm with a uniform initialization . Same results are obtained with the Finite Element Method (FEM), as differences do not exceed 0.5°C. One can observe the influence of the non-uniformity of the thermal resistance.
Figure 7. Validation of the direct problem–temperature profiles on the upper face of the block 1: (a) for y1 = 7.5 mm, (b) for x1 = 7.5 mm.
Additionally, this model has been extended to n-block devices and has given quite satisfactory results in terms of precision and time computation Citation8. Contrary to the FEM, this model does not require to mesh the entire device, which is attractive with microelectronic device geometries (small thickness compared to the other dimensions of the block, very different scales between blocks).
3. Inverse problem
3.1. Formulation of the inverse heat conduction problem
The thermal resistance distribution Rint(x1, y1) is regarded as the unknown of the inverse problem. Infrared thermography provides temperature measurements on the upper face of the block 1 to estimate Rint(x1, y1). Heat sources are constituted by thin films distributed on the upper face of the block 1 and heated by an electrical current.
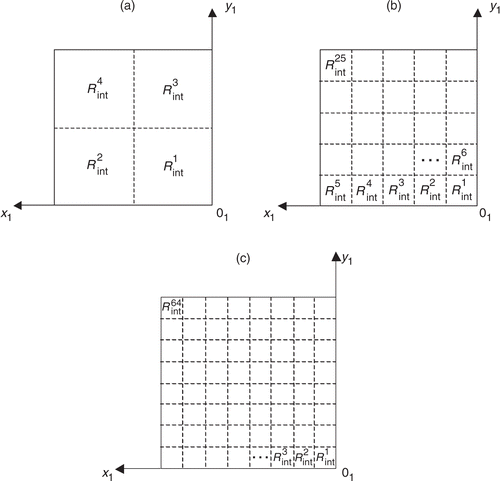
The distribution Rint(x1, y1) is parametrized by a parameter vector with a finite number of components. The interface is discretized in order to write Rint(x1, y1) as a piecewise constant function. So the interface thermal resistance is assumed to be constant by parts on a given number nb = ( − 1) × (
− 1) of zones:
(28)
where
(
) and
(
) are the vectors which discretize the Ox1 and Oy1 axes. Here, we study square interfaces (L1 = l1) and the zones are defined by dividing the interface into nb zones of equal areas. Moreover, one discretization superscript is kept as shown in .
Figure 8. Examples of parametrization of the interface thermal resistance distribution: (a) 4-zone partition, (b) 25-zone partition, (c) 64-zone partition.
Then the objective of the inverse problem is to search a nb-component vector β such as:
(29)
Note that a parameter estimation approach is used here. Contrary to a function estimation approach, it leads to the computation of the sensivity matrix that provides information about the performance of the estimation (sections 4.1 and 4.3).
The inverse analysis aims at determining the unknown vector β from the temperature measurements on the upper face of the block 1 denoted by Yi (i = 1, … , I) where I is the number of measurement points. This problem is formulated in the least-squares sense and consists in finding the optimal solution that minimizes the functional:
(30)
where
is the estimated temperatures vector determined from the solution of the direct problem by using an estimated vector
. The superscript ‘⁁’ denotes the estimated parameters.
3.2. The conjugate gradient method for minimization
An iterative process based on the conjugate gradient method (CGM) is used for the estimation of β to minimize the functional J Citation10. At each iteration k, the previous estimation is corrected according to:
(31)
in order to obtain:
(32)
where ρk is the search step size and wk is the direction of descent.
The vector wk is determined by the conjugate gradient equations:
(33)
(34)
where ∇Jk is the gradient vector of the functional Jk. The components of ∇Jk are given by:
(35)
The gradient vector is calculated by solving the sensitivity equations.
The scalar ρk is the argument of the minimum (argmin) of the one variable function Φ(r):
(36)
where r is a positive scalar. A linearization of this equation leads to an approximation of ρk as follows:
(37)
where
is the gradient matrix of the estimated temperatures and is defined as the sensitivity matrix denoted by Xk. This matrix is obtained by solving the sensitivity problem.
3.3. The sensitivity problem
The gradient vector ∇J is obtained from equation (33) in the following manner:
(38)
Let Δβ be a variation of the interface thermal resistance. The i-th column of X is defined by (i = 1, … , nb):
(39)
The value of Δβ is chosen to set the relative variation of the parameter small enough compared to the estimated distribution. In practice we choose:
(40)
Finally the sensitivity problem is solved by computing nb times the equation (42) and deducing the different components of the gradient vector ∇J with equation (41). Note that when the matrix X is computed at each iteration k, the well-known Gauss–Newton algorithm is also available Citation11, but it requires to invert the matrix XtX. This computation is avoided with the CGM.
3.4. The stopping criterion
The minimization problem of the functional J is necessarily given with a stopping criterion for which we consider that the optimal solution is reached. This stopping criterion is specified as:
(41)
with Jε the discrepancy value. Due to measurement errors, we do not expect Jε to be equal to zero. The discrepancy principle is used as the stopping criterion, i.e. the temperature residuals may be approximated by:
(42)
where σ is the standard deviation of the measurements. This assumption is made by several authors Citation12, Citation13 within the Iterative Regularization Method. Equation (33) gives:
(43)
Then the stopping criterion is given by equation (44) with Jε determined from equation (46).
3.5. Computational procedure
The computational procedure for the solution of this inverse problem may be summarized as follows:
| • | k ← 0: choose an initial vector | ||||
| • | Repeat: | ||||
Step 1
Solve the direct problem given by equations (1–10) to compute with Rint(x1,y1) a piecewise constant function () such as:
.
Step 2
Compute the functional from equation (33) and examine the stopping criterion:
, with Jε given by equation (46). Stop the iterative process if satisfied, continue if not.
Step 3
Solve the sensitivity problem to compute the sensitivity matrix X given by equation (42) and the gradient vector given by equation (41).
Step 4
Compute the direction of descent wk from equations (36) and (37).
Step 5
Compute the step size ρk given by equation (40).
Step 6
Compute the new estimation from equation (34).
Step 7
k ← k + 1: return to Step 1.
4. Results and discussion
The validity of our inverse method in predicting the interface thermal resistance distribution of a die-attach material is investigated. The test cases are performed by considering the device studied for the validation of the direct problem (attachment of a GaAs chip to a CuW heat spreader, section 2.5).
A thin layer constitutes the interface between the two blocks and its thermal resistance is supposed to vary in space. Two types of interface are considered (a and b):
| - | – the interface (a) simulates an adhesive which tends to unstick in one corner due to thermomechanical fatigue, | ||||
| - | – the interface (b) presents several heterogeneities due to the attachment process. | ||||
Figure 9. Exact interface thermal resistance distributions (Km2 W−1) investigated in the numerical experiments.
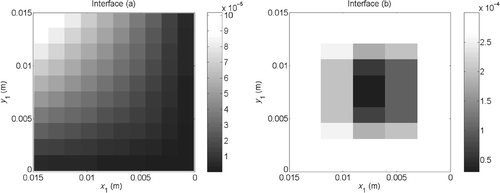
Table 2. Spatial characteristics of the exact interface thermal resistance distributions
Moreover, an infrared camera provides a grid of 20 × 20 temperature measurements points on the upper face of the block 1, which corresponds to the camera resolution on a 15 × 15 mm2 section. These temperature measurements are simulated by taking into account random measurement errors. The simulated experimental data can be expressed as:
(44)
where
is the solution of the direct problem obtained with the exact thermal resistance distribution
, σ is the standard deviation of the measurement errors and ωi is a random number chosen from a normal distribution with zero mean and unitary variance. Note that the solution of the direct problem can be performed whatever the discretization on the upper face of the block 1 thanks to equation (26).
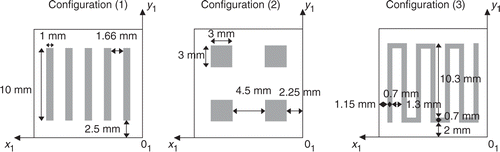
To illustrate the influence of the heat source configuration (HSC) at the top of the block 1, three different configurations are also studied ():
| - | – five long and parallel heat sources (HSC (1)), | ||||
| - | – four square heat sources (HSC (2)), | ||||
| - | – one streamer heat source (HSC (3)). | ||||
Figure 10. Heat source configurations on the upper face of the block 1 investigated in the numerical experiments.
4.1. Sensitivity study
The sensitivity study provides precious information about the performance of the inverse algorithm in terms of convergence rate, accuracy and stability. It consists globally in investigating the sensitivity matrix X defined in section 3.3.
First, a spectral analysis of the matrix XtX is conducted Citation10. This analysis consists in computing the spectrum of XtX in order to calculate the condition number defined as the module ratio between the highest and the lowest eigenvalues. The higher this number is, the more badly conditioned is the inversion of matrix XtX. Let us compute the condition number of XtX for the three HSC by considering a uniform distribution Rint such as . We obtain:
(45)
We deduce that the HSC (3) seems to be the most suitable to achieve satisfactory performance for the inverse algorithm.
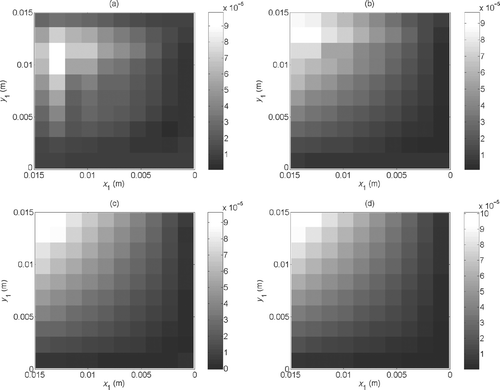
Then the components of the matrix X are plotted. The higher the absolute values of these coefficients are, the higher is the sensitivity of the calculated values of the temperatures η(β) with respect to the parameters β. Here the matrix X is given by nb = 100 vectors of 400 components [equation (42)], that is to say by 100 distributions of 20 × 20 sensitive coefficients. So it is impossible to show all these coefficients. But each distribution can be reduced to a spatial average. For example, let us examine the sensitivity of η(β) to the component n°33 of β for the HSC (1). The sensitivity coefficients distribution obtained for a uniform distribution ) is shown in . An average sensitivity coefficient to the component n°33 is determined by computing the spatial average of the distribution. We obtain here 2863.0 W m−2. We realize this operation for each component of β and for each HSC. Then we are able to plot three average sensitivity coefficient profiles ().
Figure 11. Sensitivity coefficients distribution (Wm−2) of η(β) to the component n°33 of β computed for the HSC (1) and .
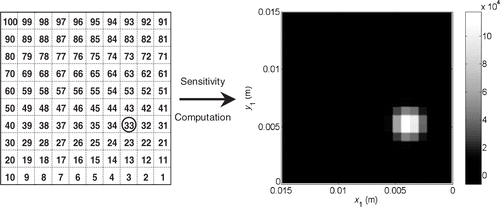
Figure 12. Average sensitivity coefficients profiles computed for the three HSC and .
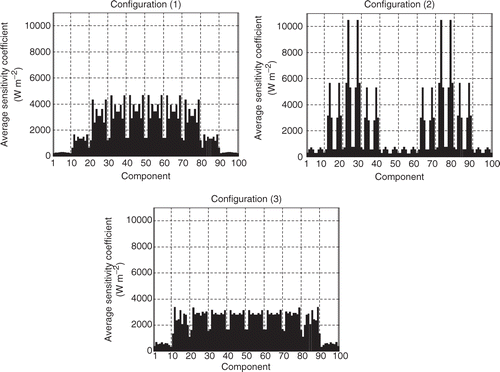
These profiles indicate the zones of the interface where the inverse algorithm may be the most efficient for identification. By referring to the grid in , we observe from a general point of view that the lowest sensitivities are obtained on the sides of the interface, especially on the corners. This is the result of the fact that these zones present the most important average distances to the whole simulated measurement points. The configuration (1) is not sensitive at all when y1 → 0 or y1 → l1, which corresponds to the zones that are not covered by the heat sources (). The configuration (2) leads to high sensitivities on the zones located under the sources but very low elsewhere. At last, the average sensitivity coefficients are not very high for the configuration (3) but the profile is the most homogeneous thanks to the streamer shape of the heat source.
4.2. Test case 1: inversion with no measurement error
The identification of the interface (a) with the HSC (1) is presented by considering the initial guess and no measurement error, i.e, with σ = 0 in equation (47). shows the evolution of the estimated distributions for different iteration numbers. The estimation of a nb-component vector β without noisy data requires at least nb iterations of the conjugate gradient algorithm.
Figure 13. Evolution of the estimated distributions (Km2 W−1) (interface (a), HSC (1), and σ = 0): (a) 5 iterations, (b) 20 iterations, (c) 50 iterations, (d) 100 iterations.
4.3. Test case 2: inversion with measurement errors
Here we consider that the measurement errors for the infrared data are taken as σ = 0.1 K in equation (47), then equation (46) gives 2 K2 for the discrepancy value. We compare the results obtained with the three HSC for the estimations of the interfaces (a) and (b).
The minimizations of the functional in and show that the fastest convergence rate is reached with the HSC (3). We note also that the estimation of the interface (b) requires much more iterations than the interface (a) because of the presence of high discontinuities of interface thermal resistance. We see in and that the components of the estimated vectors in the case of the HSC (3) are quite close to those of the exact vector. Moreover, the slowest convergence rate is obtained for components located on the sides of the interface (see values of β after five iterations). All these results confirm exactly the observations made in the sensitivity study which seems to be suitable to select a HSC that leads to a satisfactory estimation.
Figure 14. Evolution of the functional J for the estimation of the interface (a) with the three HSC, and σ = 0.1 K.
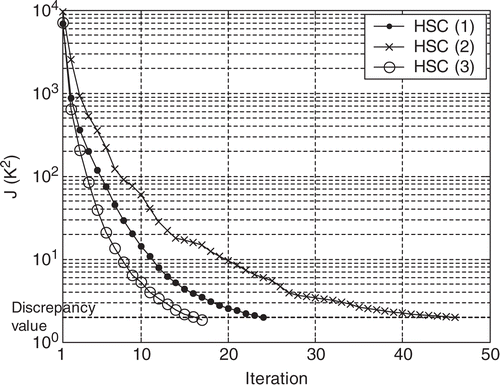
Figure 15. Evolution of the functional J for the estimation of the interface (b) with the three HSC, and σ = 0.1 K.
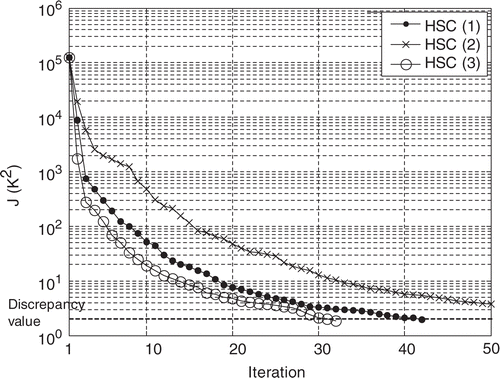
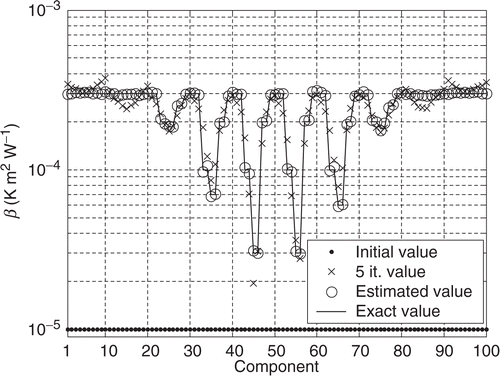
Figure 16. Components of β for the estimation of the interface (a) with the HSC (3) and σ = 0.1 K.
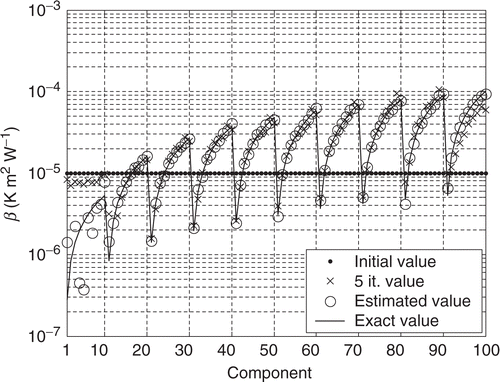
Figure 17. Components of β for the estimation of the interface (b) with the HSC (3) and σ = 0.1 K.
However, the estimated vector presents some difference with respect to the exact one for the first components in the case of the interface (a). This could be explained by studying the influence of the measurement errors. Let us examine the covariance matrix related to the estimation of β Citation14. Its diagonal is composed by the squared standard deviations of the estimated components
(equation 49) and allows to estimate the relative error
on the components of the exact vector βexact due to measurement errors (equation 50):
(46)
(47)
In the case of the interface (a) (), we observe that we obtain a non-reliable estimation (
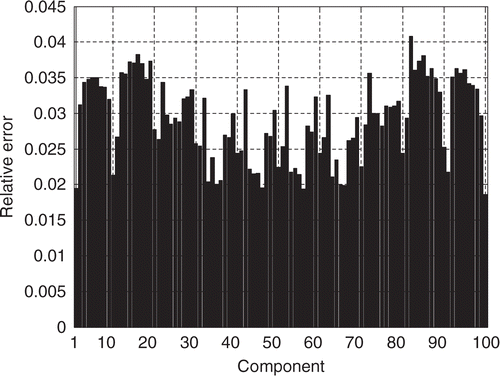
) for the first components of β, that is to say on the zones where the values of the interface thermal resistance are the lowest (x1 and y1 coordinates tend to 0). On the contrary, shows that for the estimation of the interface (b), the influence of the measurement errors is much less important due to higher values of interface thermal resistance.
Figure 18. Relative error due to measurement errors for the estimation of the interface (a) with the HSC (3) and σ = 0.1 K.
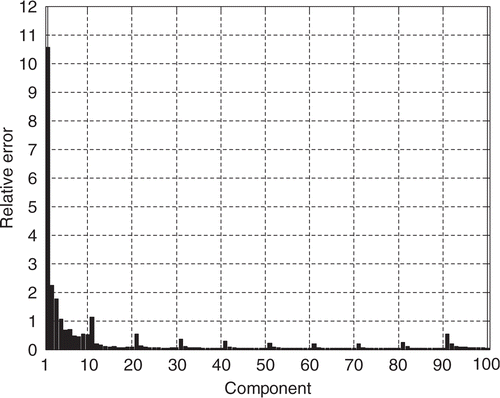
Figure 19. Relative error due to measurement errors for the estimation of the interface (b) with the HSC (3) and σ = 0.1 K.
5. Reduction of the computation time
Previous estimations require quite large computation times because the direct problem is solved nb times to calculate the sensitivity matrix X at each iteration (step 3 of the inverse algorithm). For example, the estimation of the interface (a) with the HSC (1) is reached after 39,534 s, the solution of the direct problem requiring between 15 and 20 s with a 2 GHz-512 Mo PC.
However, we notice that the matrix X can be re-used without change for the next iterations while ensuring the decreasing of the functional J. Then an iteration of the inverse algorithm becomes extremely fast because just one solution of the direct problem is required (step 1). But the convergence rate is lower in this case and we could observe the increasing of the functional and the divergence of the algorithm if the matrix X is kept for too many iterations. To avoid these difficulties, the matrix X must be updated periodically. So an update parameter K is introduced, which means that the sensitivity matrix is updated every K iterations. Also, in the case of an increase of the functional between two successive updates, we must return to the previous iteration and carry out an additional update.
Finally, the steps 2 and 3 of the conjugate gradient algorithm presented in section 3.5 are modified in the following way:
Step 2
Compute the functional from equation (33). Test conditions:
– if | |||||
– if | |||||
Step 3
Test conditions:
– if | |||||
– if | |||||
– if | |||||
This method is used to estimate the interface (a) with the HSC (1). shows the evolution of the functional for different values of K that defines the update period. On one hand, we notice that the decrease of the functional is very slow if no update is carried out (curve K = 1000). On the other hand, the functional decreases until the stopping criterion is satisfied if K = 5, 10, 20 or 30. These inversions require more iterations than the case K = 1 (X is computed at each iteration) but the saving of computation time is significant (). Note that the first updates of X lead to a sharp change of the gradient of the evolution of the functional J that makes possible the convergence (see zoom in on the curve K = 20 around the 20th iteration). The components of the estimated vectors for these curves are not given here but they are very close to those of the since the stopping criterion is satisfied.
Figure 20. Evolution of the functional J for the estimation of the interface (a) with the HSC (1), σ = 0.1 K, and different update parameters K.
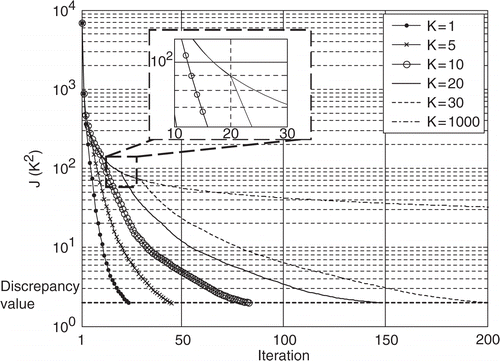
Figure 21. Computation time of the estimation of the interface (a) with the HSC (1), σ = 0.1 K, as a function of the update parameter K.
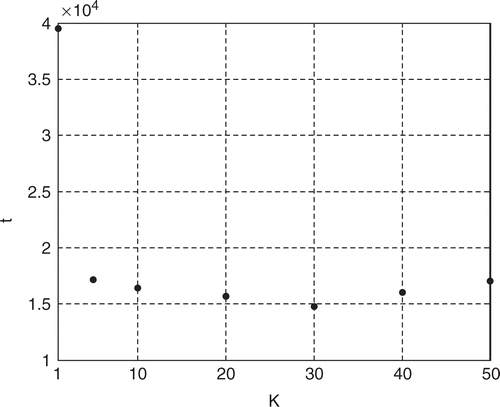
So the periodic update of the sensitivity matrix is a very efficient method to reduce the computation time of the inverse problem and to possibly estimate a vector β with more components. The goal is to find the compromise solution between the saving of computation time and a satisfactory convergence of the functional.
6. Progressive refinement of the interface thermal resistance distribution
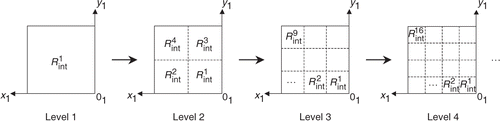
Until now, the number nb of zones of the searched distribution is supposed to be known from the start of the inversion. In this part, no prior information about the parameter nb is available. A progressive refinement method of the interface grid is presented and consists in solving the inverse problem at each refinement level until the convergence of the functional J is achieved Citation15.
Let us consider that an experimental data vector Y is obtained for a given exact distribution and used for the following estimations. The number nb of components of the exact vector βexact is assumed to be unknown before inversion. The progressive refinement method consists in starting the inversion algorithm at the first refinement level (), that is to say by taking into account one zone of constant interface thermal resistance (nb = 1). After minimization of the functional J, a first one-component vector is achieved. This one is used to initialize the inversion algorithm for the second refinement level (nb = 4) that leads to a new four-component vector
. This process of successive refinements is repeated as long as a decrease of the functional is observed.
Figure 22. Refinement levels of the interface grid.
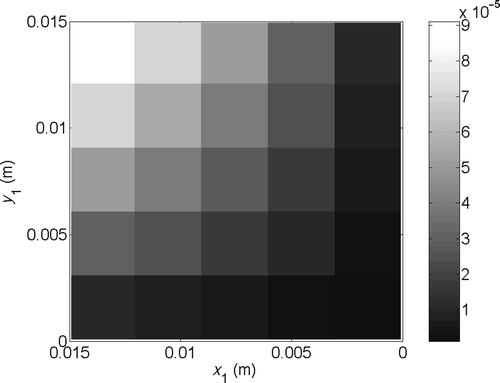
To illustrate this refinement method, let us examine the interface (a) for which 25 zones of constant thermal resistance are taken into account such that the corresponding exact distribution is given in .
Figure 23. Interface thermal resistance distribution (K m2 W−1) searched to illustrate the refinement method.
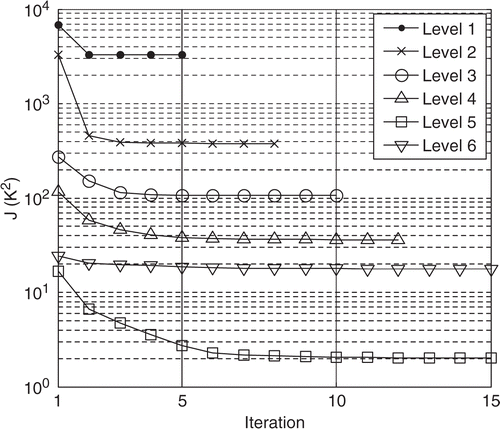
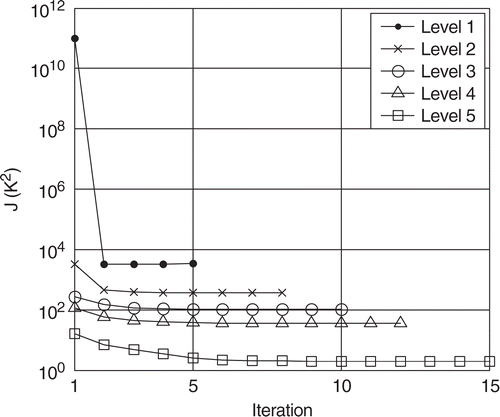
For this identification, the HSC (1) is used with a standard deviation of the measurements σ = 0.1 K. Also, the periodic update of the sensitivity matrix is used with K = 5. The successive estimated distributions for the first six refinement levels are presented in . We can deduce from these figures that the fifth refinement level is sufficient for the identification of . The evolution of the functional for the six levels proves numerically this observation (). Indeed we see on these different curves that the minimum of J is reached for the fifth level. The sixth level induces an increase of the functional due to the spatial shift of the grid between levels 5 and 6.
Figure 24. Estimated distributions (K m2 W−1) for the first six refinement levels with the HSC (1), σ = 0.1 K and .
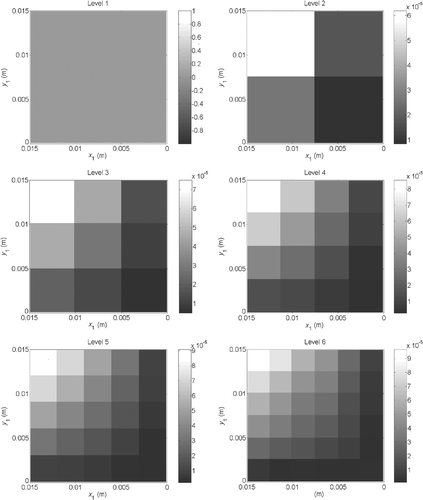
Figure 25. Evolution of the functional J for the first six refinement levels with the HSC (1), σ = 0.1 K and .
Moreover, the refinement method prevents a possible divergence of the algorithm due to a bad initialization of the vector with respect to the exact one
. Let us go back to the previous example with a uniform initialization such as
. The shows that the estimation without refinement for nb = 25 does not permit to estimate
because the minimization of J does not occur, which proves the sensitivity of the algorithm to a bad initialization of the vector β. This sensitivity can be greatly reduced thanks to the successive refinements of the interface. We plot in the evolution of J with the same initialization of β for the first five refinement levels. The minimization of the functional at the first refinement level seems to be almost independent of the initialization of β and permits to optimize the initializations of the next levels, making the convergence of the functional easier.
Figure 26. Evolution of the functional J without refinement of the interface grid with the HSC (1), σ = 0.1 K and .
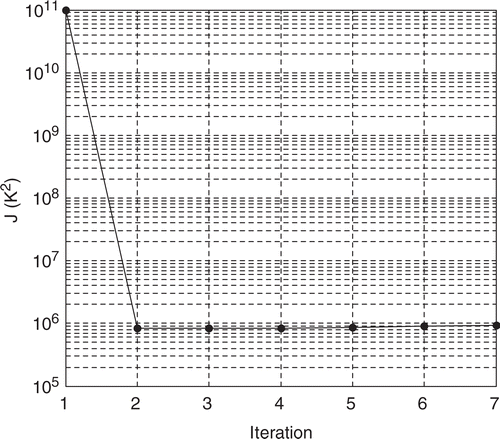
Figure 27. Evolution of the functional J for the first five refinement levels with the HSC (1), σ = 0.1 K and .
7. Conclusions
The CGM has been successfully applied for solving a steady-state inverse heat conduction problem to estimate the 2D thermal resistance distribution of a die-attach material. The applications are of great importance for the interface defect detection in microelectronics. A powerful thermal model has been developed for the direct problem. This model is particularly suitable to solve the 3D heat conduction equation in microelectronic devices. Results of estimations showed that the convergence rate of the inverse algorithm strongly depends on the heat source configuration chosen for the thermal excitation of the device on the upper face of the semiconductor chip. A sensitivity study permitted to select an efficient HSC. A streamer shape heat source is more suitable than discrete heat sources. The influence of the measurement errors was also investigated and did not prevent to achieve quite reliable distributions. The study of the covariance matrix showed that this influence is the most important on the zones where the thermal resistance is very low.
Additionally, the conjugate gradient algorithm was modified by introducing a periodic update of the sensitivity matrix which reduced significantly the computation time of the estimation. At last, we presented a progressive refinement method of the interface grid that provides the exact number of zones of the interface grid and avoids initialization problems. The main drawback of this method is that a given number of zones is added uniformly on the interface plane when going from the current refinement level to the next one. Thus, this approach can lead to over-parametrization of the vector β if only a few local refinements are needed. This could be avoided by estimating both the values of the interface thermal resistance and the shapes of the zones where the thermal resistance is constant Citation16. Moreover, the method could be extended to transient state in order to extract additional parameters such as heat capacity or thermal diffusivity of the chip.
The next step of this study is to validate experimentally this identification method. An experimental procedure based on chemical etching of copper thin films has been developed to form heat sources of every shape on alumine substrates. These heat sources are supplied by an electric current through small electrical wires brazed on the thin films. The first characterizations of interfaces composed of different types of adhesives or adhesive with artificial defects are in progress.
References
- Gatto, V, 2002. Etude des Phénomènes Thermiques dans les Composants Electroniques de Puissance et Systèmes d’Interconnexion Associés en vue de leur Implantation dans l’Environnement d’un Moteur Automobile (in French).. Ecole polytechnique de l’université de Nantes; 2002, PhD thesis.
- Prasher, RS, Simmons, C, and Solbrekken, G, 2000. "Thermal contact resistance of phase change materials and grease type polymeric materials". In: Proceedings of International Mechanical Engineering Congress and Exposition. Orlando, USA. 2000. pp. 461–466.
- Burgess, JF, Carlson, RO, Glasscock, HH, and Neuegebauer, CA, 1984. Solder fatigue problems in power packages, IEEE Transactions on Components, Hybrids, and Manufacturing Technology CHMT-6 (1984), pp. 405–410.
- Sayers, CM, 1984. Detectability of defects by thermal non-destructive testing, British Journal of Non-Destructive Testing 26 (1984), pp. 28–33.
- Ciampolini, L, Ciappa, M, Malberti, P, Regli, P, and Fichtner, W, 1999. Modelling thermal effects of large contiguous voids in solder joints, Microelectronics Journal 30 (1999), pp. 1115–1123.
- Kurabayashi, K, and Goodson, KE, 1998. Precision measurement and mapping of die-attach thermal resistance, IEEE Transactions on Components, Packaging, and Manufacturing Technology, Part A 21 (1998), pp. 506–514.
- Bendada, A, Maillet, D, Batsale, JC, and Degiovanni, A, 1998. Reconstitution of a non uniform interface thermal resistance by inverse conduction, Inverse Problems in Engineering 6 (1998), pp. 79–123.
- Feuillet, V, 2006. Développement d' Outils d'™Analyse Thermique pour la Conception de Composouts Electroniques de Puissance (in French).. Ecole polytechnique de l’université de Nantes; 2006, PhD thesis.
- Maranzana, G, Perry, I, and Maillet, D, 2002. Quasi-analytical simulation of conduction heat transfer through a pyramidal multilayer multiblock by the quadrupole method, Numerical Heat Transfer, Part B 42 (2002), pp. 499–521.
- Jarny, Y, 2003. Woodbury, KA, ed. Inverse Engineering Handbook. Boca Raton: CRC Press; 2003. pp. 103–218.
- Beck, JV, and Arnold, KJ, 1977. Parameter Estimation in Engineering and Science. New York: Wiley; 1977.
- Alifanov, OM, 1994. Inverse Heat Transfer Problems. Berlin: Springer Verlag; 1994.
- Alifanov, OM, Artyukhin, EA, and Rumyantsev, SV, 1995. Extreme Method for Solving Ill-Posed Problems with Applications to Inverse Transfer Problems. New York: Begell House; 1995.
- Jarny, Y, and Maillet, D, 1999. "Problèmes inverses et estimation de grandeurs en thermique (in French)". In: Actes de l’Ecole d’Hiver METTI. France: Font-Romeu; 1999. pp. 1–49.
- Liu, J, 1993. A multiresolution method for distributed parameter estimation, SIAM Journal on Scientific Computing 14 (1993), pp. 389–405.
- Ameur, HB, Chavent, G, and Jaffré, J, 2002. Refinement and coarsening indicators for adaptive parametrization: application to the estimation of hydraulic transmissivities, Inverse Problems 18 (2002), pp. 775–794.