Abstract
We present an inverse procedure for determining the rate constants for the kinetic equations that describe the transesterification reaction used to produce biodiesel from vegetable oils. In this approach, we require a mathematical model and its corresponding computer implementation, an experimental setup for taking experiment data and a numerical optimization procedure are used to determine the rate constants. A continuous laminar flow microreactor concept is considered due the simplicity of the design, the precise controllability of the flow conditions and the accuracy of the corresponding numerical model.
Nomenclature
| TG | = | Triglyceride |
| DG | = | Diglyceride |
| MG | = | Monoglyceride |
| GL | = | Glycerol |
| M | = | Methyl ester |
| MeOH | = | Methanol |
| P | = | Pressure |
| x, y, z | = | Cartesian coordinates |
| μ | = | Dynamic viscosity |
| C | = | Concentration |
| Q | = | Volume flow rate |
| ki | = | Rate constants |
| w | = | Reactor width |
| L | = | Reactor length |
| h | = | Phase height |
| u | = | x component of velocity |
| D | = | Coefficient of diffusion |
| C* | = | Equilibrium concentration |
| C0 | = | Initial concentration |
1. Introduction
Given the recent dramatic increase in petroleum costs, coupled with continued turmoil in many major oil-producing nations, it is clear that development of alternate fuel sources, such as biodiesel, must be accelerated. This fuel, produced from vegetable oils, has received much attention in recent years. The growing interest is easy to understand that biodiesel involves a readily available, renewable energy source and one that is significantly more environmentally friendly than diesel produced from petroleum Citation1. However, in order to realize the full potential of this alternate fuel source, particularly with respect to economic considerations, significant manufacturing gains must be achieved. A detailed understanding of the chemical process and the required transport mechanisms are needed to design efficient reactors required for the low-cost production of biodiesel Citation2.
Design of optimal biodiesel reactors will require the use of a detailed mathematical model that describes the multiphase chemically reacting flow within the reactor. However, before the model can be used for design, certain material parameters must be determined. Often these parameters are determined inversely by adjusting the parameters so that the mathematical model matches some benchmark data, which may come from experimental measurements Citation3.
Current mathematical models for biodiesel production have focused on reaction kinetics without consideration for the complex mass transfer process Citation4, Citation5. However, the immiscible nature of the oil and alcohol reactants lead to a mass transfer limited reaction that requires careful reactor design that promotes mixing. Therefore, a mathematical model and corresponding computational model that includes mass transfer effects is very valuable for designers of continuous flow reactors.
Previous attempts at determining rate constants for this reaction have focused on adjusting the constants until the solution to the kinetic equations match experiment data Citation3. In all cases presented to date in the literature, the experiment data was collected from continuously stirred batch reactors and was assumed to be homogenous in distribution of the reactants. However, the strong immiscibility of the reactants prevents a truly homogenous mixture, thus invalidates the initial assumption. We propose a more accurate approach that considers both mass transfer and the kinetic equations simultaneously.
To insure an accurate simulation of the mass transfer, we propose conducting the experiments in microreactors with simple geometries and steady laminar flow patterns.
Microreactors are microfluidic devices that intensify the chemical reaction are due to the close proximity of the reactants Citation5. They enable complete reactions at low flow velocities by relying on mass transfer by diffusion, as opposed to the traditional turbulent flow mass transfer used in large-scale production.
In our modelling approach, the kinetic rate equations representing the first-order reversible reactions are formulated for six species. These equations are combined with the mass transport equations through source terms. The kinetic rate equations require six rate constants that need to be determined for different temperatures, catalysts and possibly oil feedstocks.
The model, when discretized and combined with a suitable optimization algorithm, can be used to inversely determine the rate constants from experimental measurements.
Again, we focus on continuous flow microreactor systems for experimental measurements due to the simplicity of the geometries, which greatly simplifies the modelling, the simple laminar flow patterns and the precise control of the process conditions.
2. Experimental setup
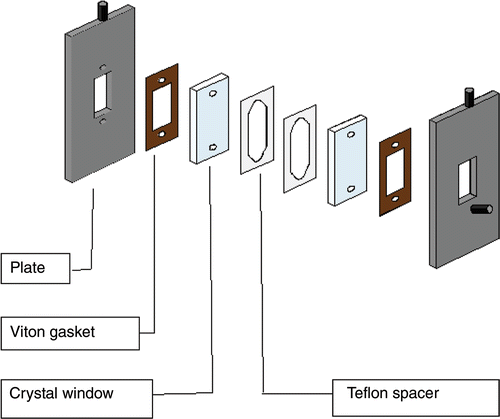
The mathematical and computational model used for the inverse procedure is based closely on the particular conditions of the experiment setup. So, although the experiment is not the focus of this article, a brief overview is necessary to place the simplified modelling approach in the proper context. The experimental setup and data referenced for this work originated at Oregon State University Citation5. In their approach, a simple single channel microreactor was assembled from two crystal plates and two thin Teflon spacers. A diagram is shown in . Teflon spacers were cut so that a 2.3 cm long and 1.05 cm wide reaction channel forms when the parts are assembled. The depth of the reactor channel was controlled by the thickness of the Teflon spacer. In the experiments, spacer thicknesses of 50 and 100 µm were used. This resulted in channel depths of 100 and 200 µm, respectively.
Figure 1. Experimental setup from Citation5.
Methanol (MeOH) and soybean oil (TG) were used for the reactants. Sodium hydroxide (NaOH) was used as a base catalyst for the reaction. The reactants were forced into the microreactor by a syringe pump that was used to precisely control the flow rates, and hence the residence times of the reactants. For all residence times, the TG to MeOH flow rate ratio was 3.4 and the temperature was 25°C. The reactants underwent a transesterification reaction within the confines of the microreactor and were converted to glycerol and methyl esters (biodiesel) that were then directed to a cold trap container. The products were analysed by gas chromatography (GC) to determine their precise concentrations. The products were collected and analysed by GC for a range of residence times for both 100 and 200 µm channel depths. The TG percent conversion was reported as a function of residence time.
3. Mathematical model
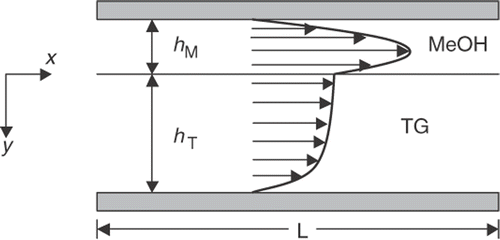
A mathematical model that governs the multiphase chemically reacting flow through the reactor channel is required for this inverse procedure. A number of assumptions will be made to simplify the model so that computational requirements for a single flow analysis can be reduced while maintaining predictive accuracy. Within the reactor channel, we assume a steady, incompressible, fully developed, laminar flow for each of the two immiscible phases. In addition, since the channel width is much larger than the channel depth, we also assume that a 2D flow pattern will adequately describe the slow moving flow. Constant viscosity, density and temperature are also assumed. Under these conditions, we can expect the lower density MeOH phase to flow steadily above the TG phase, as illustrated in . The fully developed velocity profile will be influenced by the relative viscosities and flow rates of each reactant.
Figure 2. Velocity profile for two immiscible reactants.
Within each phase, the velocity and pressure fields must satisfy the Navier–Stokes equations that governs the motion of viscous incompressible flows. Under the aforementioned assumptions, the non-linear system of equations reduces down to a scalar linear differential equation that is valid in each phase Citation6, Citation7.
(1)
Solving this equation in each phase with the boundary conditions
(2)
leads to the analytical solutions
(3)
(4)
where
(5)
The thickness ratio b must be known to determine the velocity profile for the TG and MeOH layers.
The volume flow ratio and the viscosity ratio, a, are known from the experiment conditions and can be used to determine b by solving the following non-linear equation iteratively:
(6)
For the experiment conditions (from Citation5) of volume flow ratio of 3.4 and a viscosity ratio of 106.5, the thickness ratio was found to be 5.43.
The pressure drop, ΔP, depends on the geometry of the reactor channel as well as the flow rates. This quantity is determined analytically and is given by the following equation:
(7)
Once the analytical expressions for the velocity profile are known, the concentrations of each species involved in the reaction are found by solving a system of convection-diffusion-reaction transport equations.
Here, we again make some simplifying assumptions. For example, if the system is at steady state, isothermal conditions, 2-D flow, and that the velocity profile of the reactants, intermediates, and products are the same.
We assume that the binary coefficient of diffusion for TG in MeOH is zero, which is consistent with the immiscible nature of oil and alcohol. However, the MeOH does have a small diffusion coefficient in TG, so we assume that the products and intermediates will form mainly in the TG phase. Therefore, it is reasonable to consider only the transport and reaction in TG phase, if suitable boundary conditions are applied.
The transport-reaction model equations then becomes
(8)
where i represents one of the six species, TG, MeOH, DG, DM, GL and M. Here
is known from the analytical solution given in Equation (3). The boundary conditions for the system of equations are given in .
Table 1. Boundary conditions for transport-reaction equations.
To complete the system of equations, the reaction sources, Ri, needs to be determined as a function of the species concentration, Ci. To determine these, the chemical reactions must be considered.
The overall reaction that converts triglycerides into methyl esters is simply given as
where the oil, methanol and some catalysts react to produce methyl esters and glycerol. However, this general reaction is believed to be composed of three consecutive reactions Citation3. The exact details of the transestrification reaction are still debated and several models exist in the literature Citation4. Here, we consider one of the simpler models that include only the major reactions and lump the effect of the catalyst into the rate constants.
The kinetic equations corresponding to these chemical reactions are readily obtained using the law of mass action. Since each reaction step is reversible, the kinetic model is composed of six ordinary differential equations. The model assumes homogenous reversible reactions that follow second-order kinetics.
(9)
The rate constants, k1 − k6, are the unknown parameters to be determined inversely from the experiment data. Note that constants k1 − k3 represent the strength of the reverse reaction that tends to convert products back into reactants. In actual biodiesel production, higher concentrations of MeOH are used to force the reaction to the product side.
4. Numerical model
The governing Equations (7) and (8) are solved approximately using the finite element method. The geometry of the experiment reactor channel has a very high aspect ratio, so direct discretization leads to highly stretched elements. To over come this, we have non-dimensionalized the equations with different reference lengths in the x and y directions.
The non-dimensional transport-reaction model equations then becomes
(10)
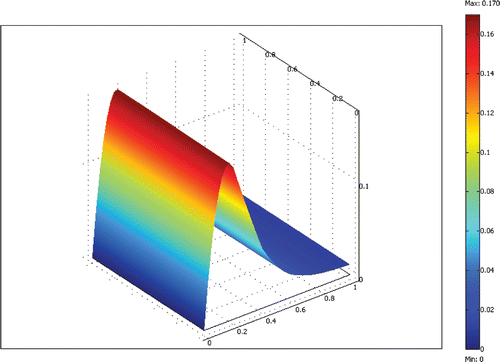
The equations are discretized with the finite element method and solved efficiently using the Newton–Raphson method and a sparse linear equation solver. A non-dimensional grid with unit length on each side was used for all computations. We systematically refined the grid uniformly until the solutions’ changes were small compared to the previous grid. A 20 × 20 grid of bi-quadratic elements (400 elements total) was found to give adequate results with a solution time less than 1 min on a Pentium 4 personal computer. An example result for a 100 µm deep reactor channel with flow rate ratio of 3.4 and a residence time of 10 min is shown in Figures .
Figure 3. Calculated , a non-dimensional mesh.
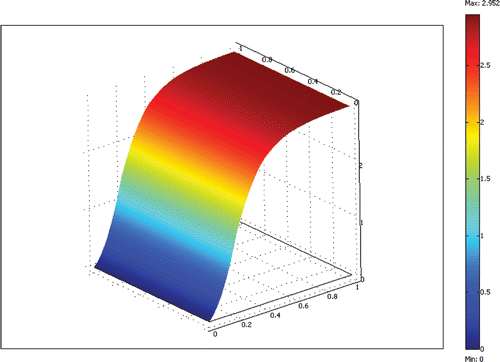
Figure 4. Calculated , a non-dimensional mesh.
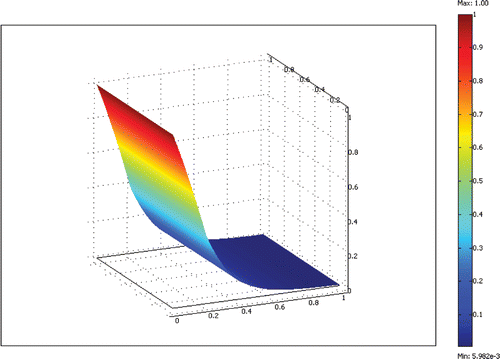
Figure 5. Calculated , a non-dimensional mesh.
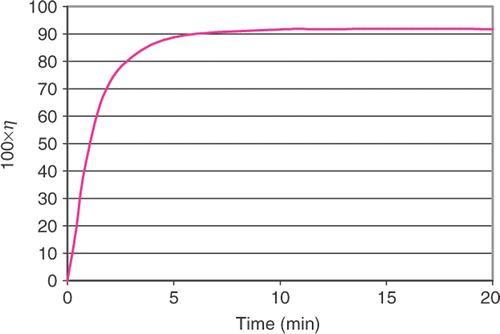
When the model is run for various residence times, the conversion curve is obtained, as shown in . Conversion, η, is defined as
(11)
The curve is graphical illustration of reactor performance and is often determined experimentally.
Figure 6. Calculated conversion curve.
5. Inverse procedure
We use a simple inverse procedure to determine the kinetic rate constants from the data collected by the experimental setup described previously. This straightforward approach uses a numerical optimization algorithm with the mathematical model describing the flow. The optimizer adjusts the constants until the computed conversion curve matches the experimentally measured curve. For this problem, the design variables are the six unknown rate constants, k1 − k6. The object function is define as
(12)
where n is the number of experiment data points. By minimizing this non-linear function, the conversion curve is fitted to the measurement points in the least-squares sense.
In general, this objective is continuous but will not vary monotonically as a function of the design variables. Therefore, optimization algorithms based on local methods, such a gradient-based schemes, run the risk of being trapped in the local optimum closest to the initial guess. To avoid this, we either choose several different starting points or use a global optimization algorithm, which ideally will give a solution independent of the starting solution but is more expensive computationally.
In this work, we minimize the objective function using local and global optimization algorithms. The local optimization algorithm employed is based on sequential quadratic programming (SQP) algorithm Citation8. The gradient evaluations required for this method were determined using finite differencing with a specified step size range. The global optimization approach used is based on the differential evolution (DE) algorithm Citation9, Citation10.
6. Results
As a test case, the experiment results for a 100 µm depth reactor channel were used in the formulation of the objective function. The experiment used soybean oil at 25°C with a volume flow ratio of 3.4. There were six measurement points reported, enough to make the problem determined. For the data points given, the Reynolds number was found to range from 1.1 × 10⁻⁴ to 2.7 × 10⁻⁴, thus validating the assumption of laminar flow in the mathematical model. The finite element model was built to match the geometry and conditions of the experiment.
The finite element model was coupled to the DE and SQP optimizer and run using a single process personal computer.
The DE method was run with a population size of 70, a crossover probability of 1.0, and a stepsize of 0.8.
The design variables were normalized with respect to their upper and lower bounds such that .
The SQP method converged quickly, within six iterations, to a local optimal result for all initial guesses, as show in . However, within the first iteration the DE method was able to find smaller objective function (). The DE method continues for a total 25 generations before reaching the convergence tolerance.
Figure 7. Convergence history for SQP method.
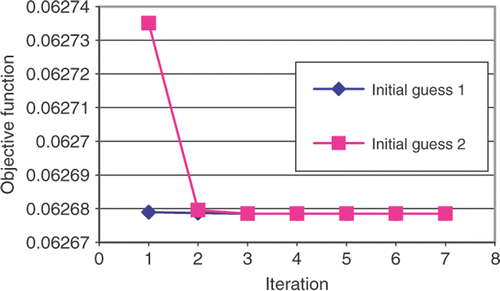
Figure 8. Convergence history for DE method.
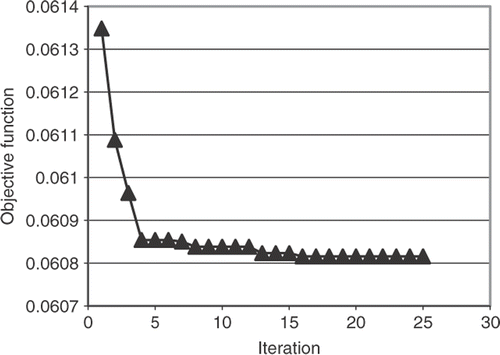
In all cases, the rate constants produced conversion curves that matched well with the experiment data points. The DE method produced constants with the lowest objective function indicating that the SQP method is becoming trapped in a local minimum. This may be due to the multimodal nature of the objective function or perhaps the inaccuracy of the finite difference gradient calculations. Due to the low-computational cost of the finite element analysis, all of the optimization cases could be completed in less than one day on a personal computer.
The computed conversion curve obtained by the DE method is shown in . The curve can be seen to fit the experimental data points well. Numerical values for the rate constants are given in for the DE method. These constants represent the end goal of this process. This same procedure can be repeated to determine the rate constants for other oil feedstocks, catalysts or operating temperatures.
Figure 9. Measurement data and computed conversion using rate constants from DE method.
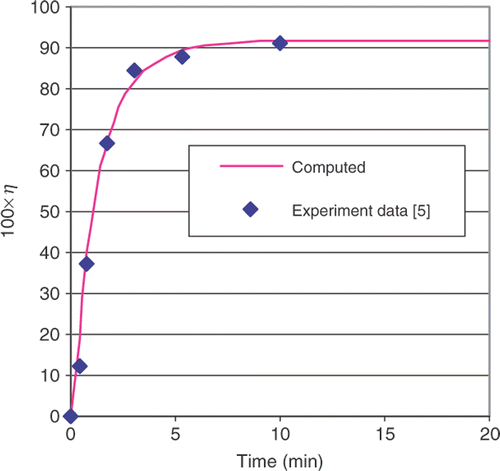
Table 2. Kinetic rate constants for soybean oil at 25°C (m3 mol s−1).
7. Conclusions
We presented an inverse procedure for determining the rate constants for the kinetic equations for the conversion of vegetable oils by transesterification. A mathematical model and its corresponding computer implementation were developed. The model described the geometry and process parameters of a simple microreactor experimental setup. The use of a microreactor allowed for the accurate modelling of the mass transfer between two immiscible phases, something not easily done for traditional batch or continuous flow reactors that use turbulent mixing. The experiment data from a 100 µm reactor was used to determine the rate constants for the conversion of soybean oil to biodiesel at 25°C with NaOH catalyst. The DE method produced the lowest objective function value, though all solutions resulted in adequate curve fits. The proposed procedure could be used in the future to accurately determine rate constants for different catalysts, temperatures and oils.
Acknowledgements
The authors gratefully acknowledge support for this work from Texas Department of Agriculture, Food and Fibers Division, through grant #FF-C-07-03.
References
- Ma, F, and Gerpen, MA, 1999. Biodiesel production: a review, Biores. Technol. 70 (1999), pp. 1–15.
- Canakci, M, and Gerpen, JVan, 2001. Biodiesel production from oils and fats with high free fatty acids, Trans. ASAE 44 (2001), pp. 1429–1436.
- Noureddini, H, and Zhu, D, 1997. Kinetics of transesterification of soybean oil, J. Oil Chem. Soc. 74 (1997), pp. 1457–1463.
- Turner, TL, 2005. "Modeling and simulation of reaction kinetics for biodiesel product". In: MS Thesis. Raleigh, NC: Mechanical Engineering, North Carolina State University; 2005.
- Al-Dhubabian, AA, 2005. "Production of biodiesel from soybean oil in a micro scale reactor". In: MS Thesis. Corvallis, OR: Chemical Engineering, Oregon State University; 2005.
- White, FM, 1991. Viscous Fluid Flow. New York, NY: McGraw-Hill; 1991.
- Bird, RB, Stewart, WE, and Lightfoot, EN, 1960. Transport Phenomena. New York, NY: John Wiley & Sons; 1960.
- Lawrence, CT, and Tits, AL, 2001. A computationally efficient feasible sequential quadratic programming algorithm, SIAM J. Optim. 11 (2001), pp. 1092–1118.
- Storn, R, and Price, K, 1997. Differential evolution – a simple and efficient heuristic for global optimization over continuous spaces, J. Global Optim. 11 (1997), pp. 341–359.
- Price, K, Storn, R, and Lampinen, J, 2005. Differential Evolution – A Practical Approach to Global Optimization. Berlin: Springer; 2005.