Abstract
In this article, a three-dimensional (3-D) numerical solution of the inverse geometry problem for a continuous casting process of an aluminium alloy is presented. In particular, an accurate determination of the interface location between the liquid and solid phases based on temperature measurements at several internal points of the body is discussed. This problem is crucial for the design and control of the casting process. To solve it, an algorithm was proposed that is an extension into 3-D of the solution procedure developed for the two-dimensional (2-D) geometrical inverse problem. Namely, in the solution algorithm, the Bezier splines for the 2-D procedures were replaced with the Bezier surfaces for the 3-D phase change boundary approximation. In the inverse procedure, a sensitivity analysis was used to estimate the location of the Bezier surface control points. While the measured temperatures required to solve the problem always contain measurement errors, a comparison of the numerically measured and retrieved values showed a very high computational accuracy. Consequently, the average percentage error of the control point locations is very satisfactory compared with the reference phase change solution. In addition, the computationally effective method was independent of the maximum error of measurements used for calculations.
1. Introduction
Due to the increasing demand for high-quality materials, continuous casting has become a frequently used technology in many branches of the contemporary foundry industry. This casting method can satisfy many technical requirements, provided that the process is well-designed and controlled. An appropriate design of the casting requires a good understanding of the phenomena involved and a determination of various factors that affect the process. One of the most important factors determining the casting process is the knowledge of the phase change front location, a soft zone that separates the solidified part of the ingot from its liquid part with the soft zone. Therefore, this work aims at creating a procedure to determine the shape and location of the surface that separates the two regions based on several temperature measurements inside the solidified body. This type of task is known as an inverse geometry problem, in which the lost or uncertain information in the mathematical description is the geometry of the problem. In this case, it is the shape of the phase change front.
In the literature, there are a number of works devoted to numerical simulation of the casting technology. In most of them direct problems are discussed. For example, Cherukuri Citation1 developed a one-dimensional (1-D) heat conduction model that included temperature-dependent thermal conductivity for the continuous casting of bars. Conde et al. Citation2 supplemented the enthalpy approach with a mathematical model that included momentum and continuity equations and added an extra source term to the momentum equation to account for the soft zone within the computational domain in the direct problem.
The parametric and boundary inverse problems in metallurgy applications have also been broadly discussed in the literature. Kim et al. Citation3 computed the temperature-dependent thermophysical properties of an anisotropic composite material. Le Bideau et al. Citation4 investigated a 1-D inverse heat conduction problem to estimate the time-variable incident heat flux on the surface of a material based on the temperature measurements at a particular location in this material. Bendada et al. Citation5 determined the thermal contact resistance value on the polymer-mould interface. Recently, Nowak et al. Citation6 investigated the cooling conditions in an aluminium alloy continuous casting problem.
Few works on the most complex inverse geometry problems have been published. Huang Citation7 studied a transient inverse geometry heat conduction problem using the conjugate gradient method and the boundary element method (BEM) to estimate the unknown irregular frost growth. Gaoa and Heb Citation8 proposed a new inverse analysis approach for identifying unknown geometries for multi-region problems using BEM. The inverse geometry problems devoted to continuous casting to date have been defined as two-dimensional (2-D) ones Citation9. The referred work focused on the application of the Bezier splines for the phase change boundary approximation Citation9. A similar approach is discussed in this article, but Bezier surfaces (three-dimensional (3-D) generalization of Bezier splines) are applied instead.
The proposed procedure was tested for an aluminium alloy to prove its usefulness. The geometry configuration was taken from the literature Citation11. The nominal location of the sought phase change front was determined based on the direct problem solution, which is discussed in detail by Nowak et al. Citation6. Because of the unavailability of experimental measurements, these data were numerically simulated, and the temperatures predicted in the direct problem then contained pseudo-random errors with a normal distribution. To simulate the problem as realistically as possible, the temperature sensors were located as in the experimental works of Drezet et al. Citation11.
The mathematical description of the inverse problem in question only considered the solid part and consisted of the heat transfer equation, strongly temperature-dependent material properties and the boundary conditions on all the walls of the ingot. The model also included the spatially local air gap between the mould and crystallizer. As mentioned before, the missing information in the model was the shape and location of the phase change front. Thus, the problem was solved iteratively until the modelled and measured temperatures agreed with the assumed accuracy.
In first iteration, the shape of the phase change front was defined with the assumed design variables. As a result, the problem became the direct one and it could be easily solved (Section 2). In this work, the direct solution was obtained using the Fluent software Citation12. The design variables were updated in the inverse procedure (Section 3) to generate a new shape of Bezier' surfaces (Section 4) using the sensitivity analysis (Section 5). This step of the developed procedure was realized with assistance of the in-house code. The overall computational algorithm is discussed in Section 6, while the detailed discussion of the obtained numerical results is presented in Section 7.
2. Direct formulation
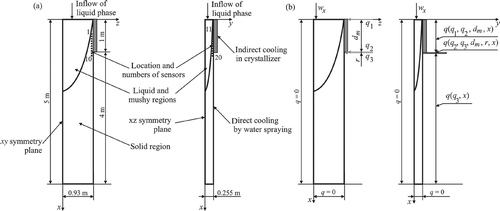
The geometrical model of the computational domain considered in the direct problem varied with each iteration. However, in the first iteration, the ingot was assumed to be of a brick shape with the following dimensions: (x = 4.95 m) × (y = 0.51 m) × (z = 1.86 m). Due to two symmetry planes of the object, only one quarter of it was analysed. Similar to the geometry, the numerical discretization varied with each iteration; however, the number of high-quality elements was in the range between 0.8 and 1.5 million. In general, a very fine mesh was first generated on the phase change surface, and then the volume was packed with a gradually decreasing number of elements towards the casting direction. This strategy was especially important for the last several iterations when the top part of the casted material became very sharp in the vicinity of the cooled surfaces, as shown in .
Figure 1. (a) Scheme of the 3-D domain and (b) boundary condition types for two side views of the continuous casting problem of aluminium alloy.
The direct problem is a part of the phase change problem in which the enthalpy–porosity technique was used. The details of the mathematical model are described in Citation6. In the presented model, only the solid part of the ingot is considered. Therefore, in the inverse analysis of the studied solidification problem, the steady-state energy equation is simplified to a heat conduction equation:
(1)
where k denotes the thermal conductivity and T represents the temperature.
The thermophysical properties of the considered aluminium alloy are strongly dependent on temperature. Because the process is considered at a steady state, only the thermal conductivity is defined using polynomial functions of temperature Citation13.
Drezet et al. Citation11 described the experimental and computational studies of the real-continuous casting process. Therefore, in the direct problem formulation of this study, the known boundary condition types were defined to reflect an actual process. On the top surface (phase change front), a constant temperature equal to the solidus temperature of 838.15 K was used, while on the two side walls of the model geometry, the symmetry boundary condition was prescribed. The production technology of the continuous casting strongly depends on the heat flux distribution along the cooled boundaries of the ingot. Therefore, boundary conditions also included the estimated heat flux profiles defined on the two cooled surfaces of the body. These ingot surfaces are usually additionally cooled by spraying water over the external wall of the crystallizer. Based on the information reported in Citation6,Citation11, it was assumed that the heat flux varied linearly along the mould and exponentially along the water spray.
In this work, the heat flux distribution was defined by functions dependent on three fluxes q1 = 500 W m−2, q2 = 0 W m−2 and q3 = 1830 W m−2, and a variable x (casting was carried along this direction), as illustrated in . Therefore, the heat flux distributions were specified in the following form as functions dependent on variable x:
(2)
where dm is the length of crystallizer and r is the length of the mesh cell. Detailed information on the estimation of the above heat flux implemented in Fluent using User Defined Functions (UDFs) as the boundary condition profiles can be found in Citation6.
During the solidification, a process of contraction occurs in both the soft zone and the solid part of the ingot. The volume rapidly increases with the temperature drop, which strongly affects the cooling conditions. Therefore, to simulate an actual casting process, the thermal contact resistance was considered as well. This can be summarized as follows: for each grid cell, a geometrical volumetric contraction was determined using polynomial temperature-dependent functions. The volumetric contraction was then used to calculate an air gap between the two cooled side walls of the ingot and the internal walls of the crystallizer. As a result, spatially local values of the contraction distribution were obtained. The heat transfer through these air gaps was governed by radiation and natural convection Citation6.
3. Inverse geometry problem
The main goal of the inverse geometry problem solution was to find the phase change front location for which the calculated temperature at sensors was as close as possible to that measured by said sensors. In the presented algorithm, the minimization of this difference was realized by a minimization of the following objective function, with an additional term to improve stability (based on the least squares method):
(3)
where vectors T* and U contain calculated and measured temperatures, respectively, at sensor locations. The quantities estimated in the problem are collected in vector Y, while the superscript T denotes transpose matrices. The symbol W refers to the covariance matrix of measurements, which is a diagonal matrix with values of errors in corresponding locations on the diagonal. Thus, the contribution of more accurately measured data is stronger than those obtained with lower accuracy. Known prior estimates are collected in vector
, while WY represents the covariance matrix of the prior estimates and α is a weighting factor. Therefore, on the diagonal of matrix WY are estimated errors of the values identified. It should also be remembered that the coefficients of matrix WY have to be large enough to catch the minimum (these coefficients tend to infinity if prior estimates are not known).
In this study, the additional term in Equation (3) is multiplied by the weighting factor α = 1 because the convergence problems in the iterative procedure were not observed.
To use the sensitivity analysis, the difference between the expected temperature Ti and temperature , calculated at the same point i but obtained for values
assumed at the beginning of the iteration, can be approximated by a total differential:
(4)
In the above formula, the derivatives of the temperature at point i with respect to the identified values at point j appear. In sensitivity analysis, such derivatives are defined as the sensitivity coefficients . They provide a measure of each identified value and indicate to what extent it should be modified. Taking Equation (4) and the definition of the sensitivity coefficient into account, the vector of temperature at sensors, i.e. vector T can be expressed in the matrix form:
(5)
A minimization of the objective function (Equation (3)) together with Equation (5) leads to some basic transformations to the following system of linear equations:
(6)
The above system is solved with respect to vector Y, which collects the sought variables. The remaining vectors and matrices appearing in Equation (6) contain known (or assumed) values. The method of calculating elements of matrix Z depends on the problem solved and is discussed in the following section.
4. Application of Bezier surface
Preliminary results obtained for the 2-D model Citation9 showed that the Bezier segments sufficiently approximate the phase change front. A similar situation was observed during the first attempt at the 3-D computations Citation10. In general, the inverse geometry problems in heat transfer analyses have not been broadly discussed in the literature. Consequently, it was difficult to apply an alternative phase change front modelling method.
The main advantage of this approach is the relatively small number of the design variables needed for the modelling of the phase change front.
The shape and location of the Bezier surface is defined by 16 control points Vij in accordance with the following formulae:
(7)
In the above definition, B(u, v) represents a point on the Bezier surface, u and v vary in the range [0, 1] and the symbol · means the product of matrices.
Consequently, the number of values affecting the Bezier surface shape is still rather large (16 × 3 values). In reality, some coordinates of control points are defined by additional constraints that result from the physical nature of the problem, which enables determining the location of the front based on a smaller number of design variables. For example, the y- and z-coordinates of the control points located on the ingot outside surfaces and on the symmetry surfaces are known, because the dimensions of the ingot are determined. Moreover, the equality of the x-coordinate of appropriate control points ensures the existence of derivatives on the symmetry surfaces, as shown in .
Figure 2. Bezier surface with control points (the inverse view).
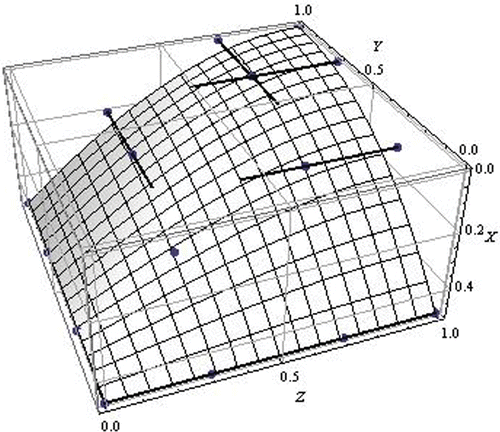
In addition, it was assumed that only the x-coordinate of the Bezier control points is estimated. In fact, those values have the main influence on the Bezier surface shape modelling of the phase change front in continuous casting. Eventually, the location of the phase change front depended on five values Yj that can be described by the following relation:
(8)
The y- and z-coordinates of points on the Bezier surface were calculated analogously to Equation (7) using the known appropriate coordinates of Vij in the matrix occurring in the equation. The parameters u and v lie within the interval [0, 1]. In numerical calculations, these quantities are responsible for the mesh refinement.
The limitation of unknowns and, consequently, the limitation of measurements is always appreciated, mainly because of practical difficulties connected with their acquisition. It should also be remembered that in the inverse problems, the errors of measurements could have an additional influence on the final results.
5. Sensitivity coefficients
The calculations of the sensitivity coefficients are primarily involved in solving a set of the direct problems similar to the thermal one. Each of these problems arises through a differentiation of the main energy equation and the corresponding boundary conditions with respect to a particular design variable Yj.
On the phase change front modelled using the Bezier surface, the temperature is a function dependent on the coordinates of a node and the design variables. On the other hand, a constant temperature Tm is expected along this boundary. Therefore, the boundary condition on the phase change front can be noted by the following equation:
(9)
where x, y, z are coordinates of a node and Yk, k = 1, … , 5 are the estimated quantities. To obtain the sensitivity coefficient, Equation (9) needs to be differentiated with respect to the selected and fixed Yj, i.e.:
(10)
As only the x-coordinate of the selected Bezier control points is estimated, the partial derivatives of y- and z-coordinates with respect to Yj vanish. A similar situation can be observed for the derivative , because the estimated values are mutually independent. Taking into account the sensitivity coefficient definition, Equation (10) is reduced to the equation of the boundary condition on the phase change front:
(11)
The value is the first component of gradient at a node, while
is obtained by a differentiation of Equation (8). The remaining boundary conditions after differentiation are of the same type as in the original thermal problem, but homogeneous.
6. Computational procedure
The first task of the computational iterative procedure was to formulate a mathematical model and to solve the direct heat transfer problem in the solid part of the ingot using Fluent Citation12. In addition, the direct problem was also used to generate simulated temperature measurements and the sensitivity coefficients for the application of the proposed inverse analysis algorithm.
In the first iteration of this algorithm, the phase change front was assumed to be a plane orthogonal to the casting direction. Therefore, the control points had the same values. Based on the control points, a set of points belonging to this surface was generated. Then using the Gambit journal file, a shape of the surface was automatically created using NURBS edges. In the next steps, the geometry of the ingot was in the shape of a rectangular prism, and a mesh was generated.
The next journal file controlled the definition of the direct problem in Fluent using the imported grid. As already mentioned, material properties as a function of temperature, and boundary conditions defined as heat flux profiles were taken from the full phase change model Citation6. After a certain number of iterations, the simulated measurements were generated in the sensor locations for a partly converged solution. In addition, in the inverse procedure, a temperature gradient in the retrieved surface shape was needed. Thus, a 3-D temperature gradient profile was computed in the casting direction.
The next step of the procedure was to determine a set of sensitivity coefficients. The coefficients were computed using the same geometry, numerical mesh and material properties as applied in the direct problem. However, a boundary condition profile on the top surface of this model was defined as a product of a particular decision variable derivative and the temperature gradient in the casting direction (obtained from the direct model). Similarly to the direct problem, the computations were only run for a partial convergence, and the sensitivity coefficients computations were repeated consecutively for all five decision variables.
Once the simulated measurements and the sensitivity coefficients were generated, the in-house inverse software produced a new set of the control points of the Bezier surfaces. The next iteration was then begun and the entire procedure was repeated until the changes in the retrieved shape of the phase change surface became negligible.
To improve the stability of computations in the direct problem, the values of the control point locations obtained in consecutive iterations of the procedure were multiplied by a factor ranging from 0.002 to 0.05. Moreover, the inverse procedure was performed for the partly converged direct solutions in each iterative loop to accelerate the overall algorithm execution. In addition, a 3-D temperature field from the previous iteration was interpolated in the current one and used as a starting temperature distribution. This significantly reduced the computational time.
7. Numerical results
To verify the proposed algorithm for the formulated inverse geometry problem, some numerical tests were performed. In the reported calculations, the measurements were numerically simulated. To do so, random disturbances with a uniform distribution were added to the temperature at sensor points obtained from the relevant direct solution. The maximum measurement errors 0.2%, 0.5% and 1.0% were considered. In addition, the calculations with an ‘error’ equal to 0% were carried out to test the procedure. The level of maximum error of numerically simulated measurements was dictated by the relevant level observed in experimental measurements Citation11. In general, manufacturers provide information on the class of measuring instruments (usually thermocouples), which is unequivocal with the maximum temperature error specification for measurements made by these devices, e.g. less than 1–2%. Because the proposed method was constructed to be technologically convenient for real problems, the stability examination for high error levels was not considered.
The results were assessed based on comparison of the phase change front location and the Bezier control points location. The absolute error of front location (expressed in metres) was calculated as an arithmetic average of the modulus of differences between node locations, i.e., of the expected and retrieved geometry. The relative error should also be understood as an arithmetic average; however, here, it is of quotients
. In both cases, xi is the x-coordinate of a node on the nominal front and
is its equivalent on the front retrieved in the inverse procedure. To make the relative error independent of the coordinate origin location, the difference
is normalized by the length of crystallizer dm (dm = 1 m, as shown in ).
Additionally, the relative error of the Bezier control point locations was calculated. In this case, the location of the control points defining the expected and found Bezier surface was compared. The results obtained from the tests are listed in .
Table 1. Absolute and relative error locations of the phase change front and the Bezier control point for different measurement errors.
It should be stressed that the proposed algorithm, originally built for solving the inverse problem, is constructed to minimize the difference between measurements and the temperature found in the model, while the results presented in assess the compatibility of the retrieved and expected phase change front location. This means that the above results, in fact, do not fully illustrate the algorithm performance.
In all presented tests, the iterative procedure was terminated when the average of the aforementioned difference was less than 0.5 K. In , a comparison between the measured and calculated temperatures at selected (odd) sensor points is shown. These results show that the desirable agreement between calculations and measurements achieved in the iteration procedure. Based on the results presented in , the obtained geometry was accepted as the final front location.
Table 2. Temperature measured and calculated at selected (odd) sensor location.
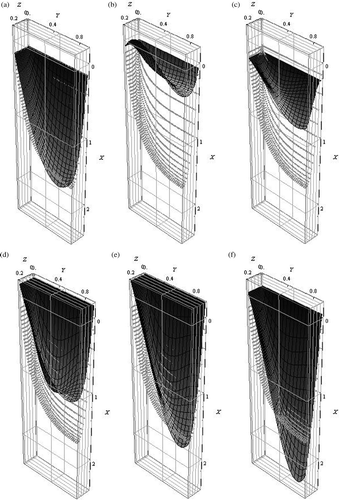
A set of graphs in presents the changes of the front shape after 5, 10, 20, 50 and 100 iterations and after the final one. It can be observed that the retrieved front dynamically varied in the iteration process. Despite the non-physical shape of the Bezier surface obtained in first stage of the iteration procedure, the proposed algorithm was finally able to find the expected location of the retrieved geometry.
Figure 3. Changes of phase change front location for selected iterations (for maximum error 1.0%).
8. Conclusions
This article discusses an identification procedure of the phase change front location in continuous casting. The problem was formulated as a 3-D inverse geometry problem of a heat transfer process. The proposed procedure, based on the sensitivity analysis, has been used for the solidification problem of an aluminium alloy. To limit the number of identified values, the phase change front was modelled using a Bezier surface. This allowed us to substantially decrease the number of estimated values. The results presented in this article show that the extension of the inverse geometry algorithms into a 3-D case is possible. The discussed algorithm was successfully applied for the analysed problem, taking the actual profiles of boundary conditions, strongly temperature-dependent material properties and an air gap into consideration in the mathematical model. Therefore, the method presented in this article appears to be useful for problems with experimental measurements and ultimately in industrial applications.
References
- Cherukuri, HP, and Johnson, RE, 2001. Modelling vertical continuous casting with temperature-dependent material properties, Int. J. Mech. Sci. 43 (2001), pp. 1243–1257.
- Conde, R, Parra, MT, Castro, F, Villafruella, JM, Rodriguez, MA, and Mendez, C, 2004. Numerical model for two-phase solidification problem in a pipe, Appl. Therm. Eng. 24 (2004), pp. 2501–2509.
- Kim, SK, Jung, BS, Kim, HJ, and Lee, WI, 2003. Inverse estimation of thermophysical properties for anisotropic composite, Exp. Therm. Fluid Sci. 27 (2003), pp. 697–704.
- Le Bideau, P, Ploteau, JP, and Glouannec, P, 2009. Heat flux estimation in an infrared experimental furnace using an inverse method, Appl. Therm. Eng. 27 (2009), pp. 2463–2472.
- Bendada, A, Derdouri, A, Lamontagne, M, and Simard, Y, 2004. Analysis of thermal contact resistance between polymer and mold in injection molding, Appl. Therm. Eng. 24 (2004), pp. 2029–2040.
- Nowak, I, Smolka, J, and Nowak, AJ, 2010. An effective 3-D inverse procedure to retrieve cooling conditions in an aluminium alloy continuous casting problem, Appl. Therm. Eng. 30 (10) (2010), pp. 1140–1151.
- Huang, CH, , An inverse geometry problem in estimating frost growth on an evaporating tube, Heat Mass Transfer 38 (2002), pp. 615–623.
- Gaoa, X-W, and Heb, M-C, 2005. A new inverse analysis approach for multi-region heat conduction BEM using complex-variable-differentiation method, Eng. Anal. Bound. Elem. 29 (2005), pp. 788–795.
- Nowak, I, Nowak, AJ, and Wrobel, LC, 2002. Identification of phase change fronts by Bezier spline and BEM, Int. J. Therm. Sci. 41 (2002), pp. 492–499.
- Nowak, I, and Nowak, AJ, , 2D and 3D inverse boundary and inverse geometry BEM solution in continuous casting, Proceedings of the 5th International Conference on Inverse Problems in Engineering: Theory and Practice, Cambridge, 11–15th July 2005, Leeds University Press, Leeds, UK, 2005.
- Drezet, JM, Rappaz, M, Grun, GU, and Gremaud, M, 2000. Determination of thermophysical properties and boundary conditions of direct chill-cast aluminium alloys using inverse methods, Metall. Mater. Trans. A 31 (2000), pp. 1627–1634.
- FLUENT 6.3 User's Guide, Fluent, Inc., Lebanon, NH, 2003.
- Guoa, Z, Saunders, N, Miodownik, AP, and Schille, J-P, 2005. Modelling of materials properties and behaviour critical to casting simulation, Mater. Sci. Eng. A 413 (2005), pp. 465–469.