Abstract
Damage detection using the discrete wavelet transformation (DWT) of temperature field recorded on the surface of a plate structure is discussed. Defects in the form of voids and inclusions of various magnitude are considered. Computer-simulated experiments including the ones accounting for white noise and real thermal experiments are applied. Transient heat transfer problems are analysed. The efficiency of DWT in damage detection is studied by way of a number of examples. Haar, Daubechies 4, 6 and 8 wavelets in 1D and 2D DWT are used. The usefulness of the Lipschitz exponent evaluated with the use of DWT is discussed. The issue of denoising the thermal response signals using the soft threshold shrinkage procedure is also taken up.
1. Introduction
Monitoring of structures and defect identification allow for the increasing safety and serviceability of structures. Therefore this issue has attracted much attention in the last three decades. Different methods of structure identification and damage detection have been proposed in the literature. Damage detection and the assessment of structural safety belong to a wider class of inverse problems. Reviews of methods of inverse analysis are presented in Citation1,Citation2.
In the majority of methods of nondestructive damage identification, the experimentally measured response of a real structure is compared with a computer-simulated response of a model structure. Various difference measures of these responses have been proposed. The parameters of a model structure are determined by the method of minimizing the distance measure with respect to model parameters. In this method also the parameters describing damage can be evaluated. The basic difficulties faced in this approach are: small sensitivity of global structural response measures to localized defect and inaccuracy of computer modelling of a structure, in particular the actual boundary conditions. To overcome the first one, special methods of tuning the damaged structure by the introduction of additional control parameters have been proposed in Citation3. In mechanical experiments it can be executed by the introduction of an additional support and/or attachment of an additional concentrated mass. In thermal experiments additional heat sources can be introduced to the experiment.
There is also an alternative approach, where the damage can be discovered without comparison to a model structure. This is a great advantage. It can be achieved by the application of artificial neural networks (ANN) or employing special signal processing techniques, for example the wavelet transformation (WT). WT is able to extract information on the local defect from global structural response signals. This approach is used in this article. The potential of WT in structural identification is strongly underlined in Citation1. Note that for damage detection WT can be combined with ANN and/or with a classical method using model structures.
In the majority of the papers the structure is excited by static or dynamic load. Then the strain concentration or deflection/reflection of waves indicates the position of a supposed defect Citation4. Another response signal used in damage detection is a temperature field measured on a surface of a structural element. The most common way of acquiring this information is infrared thermography. Among several other advantageous characteristics of this technique, the following are worth mentioning: no contact with the specimen, fast inspection rate and a large area of inspection. Two types of thermography are distinguished, namely passive and active. Contrary to the passive technique, the active thermography requires an exterior thermal excitation to induce the variation of the temperature field in the tested specimen. The method consists of thermal action on the structure and analysis of local variations in the temperature field during heating or cooling. An introduction to non-destructive testing (NDT) by active thermography is presented in Citation5. In Citation6 flash is used to initiate heat flux in composite elements of the aircraft. The defects are identified by the application of the contrast temperature method during cooling. Defect identification in thin layers of the coatings and the structure is discussed in Citation7. Carlomagno and Meola Citation8 present a comparison of advantages and disadvantages of the active thermography techniques (pulse, lock-in or modulated and pulse phase) and give practical hints concerning the choice of the method.
To magnify and make a local disturbance visible in the temperature field recorded by an infrared camera, various methods of signal processing are used. The most popular ones are Fast Fourier Transformation (FFT) and WT. This article presents the application of WT, the tool which allows the simultaneous signal analysis in two domains usually referred to as time and frequency domains. Hence, WT processes non-stationary signals more accurately than FFT. The mathematical background of wavelet analysis is presented in Citation9,Citation10. The application of discrete wavelet transformation (DWT) to the damage detection using spatial signals is presented in Citation11,Citation12. Efficiency of Continuous WT (CWT) in the detection of open cracks in beams is studied in Citation13.
The combination of the thermography and WT in the problem of defects detection is used in Citation14,Citation15. In the above-cited papers, it has been demonstrated that the WT is a tool which efficiently discovers and locates in time or space the local disturbances in structural response signals and hence is useful in damage detection. However, the problem of the identification of the characteristic features of the defect still remains an open question. The extent of a concentrated damage can be assessed by the magnitude of the local disturbance of a structural response signal. The local regularity of a function can be described by Hölder or Lipschitz conditions. Therefore, Hölder constants or Lipschitz exponent can be used for the evaluation of the irregularity of structural response signals. The mathematical background of the singularity analysis of a signal applying jointly Lipschitz exponent and CWT is presented in Citation16. The assessment of the defect extent by the application of WT and Lipschitz exponent to vibration modes of a beam is discussed in Citation17. The authors use Mexican hat CWT with two vanishing moments for the estimation of Lipschitz exponent. They also discuss the application of DWT Daubechies 2, 4 and 6 to damage detection. A similar response signal, namely a fundamental vibration mode of a beam, is analysed in Citation12, where two Hölder parameters are used for the assessment of crack extent. In the above-cited papers the damage is modelled as a stiffness reduction or an elastic spring. The displacement function has discontinuity of the second or even the first derivative. This allows us to observe precisely how the CWT with regularity conditions of a signal work. The relation between Lipschitz or Hölder parameters and the extent of damage have been demonstrated. It has also been noticed that the addition of noise to the response signal has reduced the efficiency of the method remarkably.
This article discusses the issue further. Keeping in mind that the Hölder and Lipschitz conditions refer to the regularity of a function in a point of time or space domain, we will study whether WT combined with Lipschitz exponent works in the case of a thermal response function, which does not exhibit a strict singularity, but rather a disturbance smeared over a small region. In the first part of this article the mathematical background of the DWT and Lipschitz exponent is presented. Then, we will examine the efficiency of damage detection using DWT. Next, the application of Lipschitz exponent computed by DWT will be discussed. In the major part of our study, computer-simulated thermal experiments will be used. This makes it possible to draw conclusions related to both perfect response signals and signals contaminated with a noise. The temperature fields measured with an infrared camera in real experiments will be analysed, too. In the discussed examples the defects are assumed similarly as in Citation18 in the form of voids or inclusions of the material with reduced thermal conductivity. In real structures voids can appear in cast materials or due to cracking.
2. Problem formulation
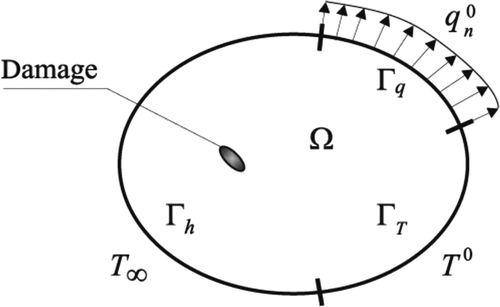
Let us consider a solid body with the volume Ω and the boundary Γ. Assume that the material is thermally isotropic. We will simulate non-stationary heat transfer problems with natural convection. Assume that the governing equations have the form
(1)
Here q, f, c, ρ and λ denote heat flux vector, heat generated per unit volume, specific heat, material density and material conductivity matrix, respectively. The dot above a symbol denotes time derivative, T is temperature field and h is a convection (film) coefficient. On the boundary portions ΓT, Γq, Γh, the Dirichlet, Neumann and Henkel boundary conditions can be specified:
(2)
The illustration of boundary conditions is presented in . In our analysis Neumann boundary conditions specifying heat flux are not used.
Figure 1. Model of thermally-loaded structure with boundary conditions.
All examples analysed in this article refer to metal plates of constant thickness made of steel or aluminium. Depending on the thermal excitation, two types of heat flux appear, namely parallel or perpendicular to the middle surface. However, it is always one surface of the plate, where the temperature field is registered and analysed. All details are given in the next sections. In computer-simulated experiments, FEM within Abaqus system is used. The eight-nodes DC3D8 solid finite elements with linear shape functions are employed.
In the numerical simulations the defects have rectangular shapes in order to precisely model them with cubic finite elements. In real experiments the defect in the specimen has the cylindrical shape.
3. Discrete wavelet transform and Lipschitz exponent
The wavelet transform of a function f(x) is defined as a set of coefficients (wavelet coefficients) dj,k:
(3)
where the term
denotes the complex conjugate to the wavelet family ψj,k. The family is generated from the mother wavelet according to the expression
(4)
The integers j and k are called dilation (scale) and translation (position) parameters, respectively. The scale parameter corresponds to respective part (level) of function decomposition (j = 0, 1, … , J − 1), where J is the maximum level of the transform. The parameter k = 0, … , 2j − 1 indicates the position of a wavelet. One-dimensional discrete signal fJ (number of discrete data is equal to 2J) can be decomposed into the wavelet series
(5)
where φ(x) is the scaling (father) function corresponding to the appropriate mother wavelet. The mother and father functions take part in the decomposition and synthesis of the signal. A simple and very efficient Mallat algorithm is used for the decomposition. The scheme of the algorithm is presented in . According to the scheme, the decomposition of any 1D signal can be presented as
(6)
or
(7)
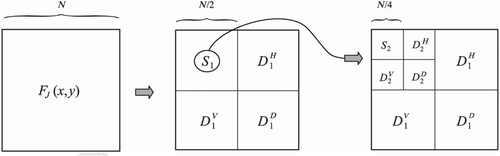
where m = J − j indicates the level of the detail Dm. The term D1 represents the most detailed part of the signal fJ(x), whereas the details DJ and DJ−1 unravel general character of the signal. The part SJ is the smooth part. A 2D DWT of the 2D signal FJ(x, y) is very similar to the 1D algorithm. The function FJ(x, y) (number of discrete data is equal to 22J) is decomposed into 3J + 1 functions:
(8)
The functions SJ,
,
and
are called the smooth image, vertical, horizontal and diagonal images, respectively. Similarly as in the case of 1D DWT, the integer m indicates the level of signal component. The illustration of the 2D signal decomposition is presented in .
Figure 2. The schema of the Mallat algorithm of signal decomposition.
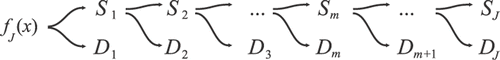
Figure 3. The schema of the 2D wavelet signal decomposition.
In order to locally assess the differentiability of the function, the Lipschitz condition is used. A function f(x) is Lipschitz α ≥ 0 at the point x = ν if there exists a constant A > 0 and a polynomial pν(x) of order p such that
(9)
The term ϵν(x) contains all discontinuities of the function f(x) at the point x = ν. The Lipschitz exponent (LE) α is a measure of function differentiability at the point x = ν. If a function is not differentiable, then 0 < α < 1. If the function has the first derivative continuous, the exponent α is equal to 2. When the Lipschitz exponent is used to wavelet transform, then vanishing moments of mother wavelet play an important role. A wavelet ψ(x) has n vanishing moments if it satisfies the condition
(10)
If the wavelet function has a sufficient number of vanishing moments so that n ≥ α, then a wavelet transform indicates a singular part of a function because of:
(11)
The Lipschitz exponent is calculated using the following inequality Citation12,Citation17:
(12)
which can be transformed to the more convenient form
(13)
The exponent α is estimated by plotting the appropriate values in a logarithmic scale.
4. Numerical studies
4.1. Example 1: Transverse heat flux
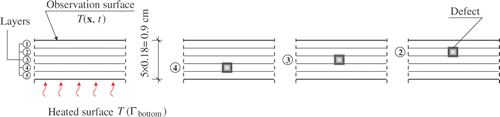
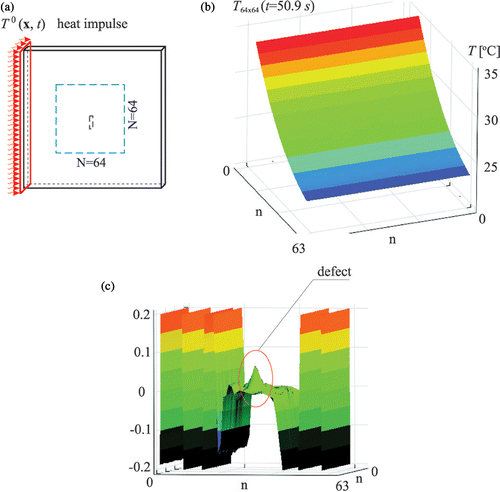
Let us consider a steel plate () with dimensions 126 × 62 × 6 mm and the following material parameters: density ρ = 7859 kg m−3, thermal conductivity λ = 50 W (m K)−1 and specific heat capacity c = 450 J (kg K)−1. The plate is heated on the bottom face and the temperature field is recorded on the upper one. Convection coefficient for all surfaces except the bottom one is h = 8.21 W (m2 K)−1. The initial temperature is 20○C. The Dirichlet boundary condition on the bottom face has the form that the temperature is uniformly distributed in the surface and variable in time, as shown in . Hence, the transient heat transfer problem will be analysed. Assume that the defect has the form of an inclusion of a material with reduced thermal conductivity by 5%. Let it have the dimensions 1.8 × 2 × 6 mm and be hidden inside the plate. presents various depth positions of the defect. The numerical model of the plate consists of five layers, each 1.8 mm thick. The finite elements DC3D8 2 × 2 × 1.8 mm are used in the analysis.
Figure 4. Transverse heat flux problem: (a) the model of the steel plate and (b) Dirichlet boundary condition on the bottom surface of the plate.
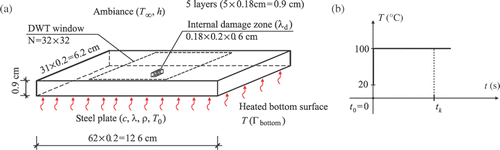
Figure 5. Various depth positions of the defect in the structure.
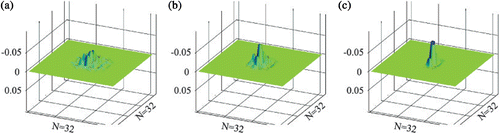
The temperature field of the upper surface is recorded at discrete points in the grid 32 × 32. This 2D temperature field is subjected to the 2D DWT with the aim to find local disturbances in the temperature field indicating the position of the defect. The results of the analysis using Haar wavelet are presented in . This figure demonstrates that the detection and localization of the defect is relatively easy, even when one uses the simplest Haar wavelet. Defects are more visible in the transform, when they are localized closer to the surface which is observed. This example has also been solved for the temperature fields contaminated by white noise. It must be underlined that the efficiency of damage detection is very sensitive to the level of white noise. Therefore, in real experiments a high-precision infrared camera should be used. Note that in the above example the reduction of the thermal conductivity within the defect is very small. Inclusion of material with radically reduced thermal conductivity would make the detection even more efficient.
Figure 6. Graphs of the 2D DWT of temperature field using Haar function, details D1: (a) defect in the layer 4, time = 1.83 s, (b) defect in the layer 3, time = 0.98 s, (c) defect in the layer 2, time = 0.58 s.
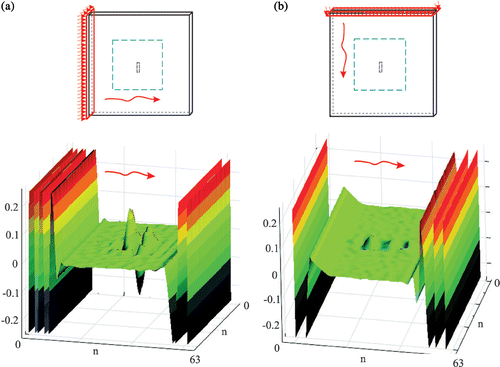
4.2. Example 2: In-plane heat flux
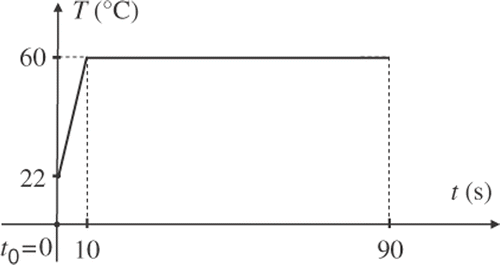
We will again consider the transient heat transfer problem in a steel plate illustrated in . The dimensions of the plate are 101.6 × 101.6 × 4 mm. The same material parameters as in Example 1 are assumed. The void has elongated shape. The example presents two different computer-simulated experiments. In the first one, referred to as plate A (), the heat flux direction is perpendicular to the longitudinal axis of the void. In the latter one, referred to as plate B (), the heat flux is collinear with the void axis. The aim of this example is to study how the efficiency of damage detection depends on the direction of heat flux in the experiment. The heat flow was induced by prescribing the temperature (Dirichlet condition) on one side of the plate. The condition as a function of time is presented in . The initial temperature of the whole structure was 22○C. The numerical model consists of eight layers, each 0.5 mm thick. The eight-nodes DC3D8 solid finite elements with the dimensions 0.8 × 0.8 × 0.5 mm are used. The defect is modelled as a longitudinal void located on the surface opposite to the one where the temperature was registered. The void has the dimensions 2.4 × 9.6 mm and a variable depth from 0.5 to 3.5 mm.
Figure 7. The model of the steel plate: (a) plate A, heat flux perpendicular, (b) plate B, heat flux parallel to the void main axis.
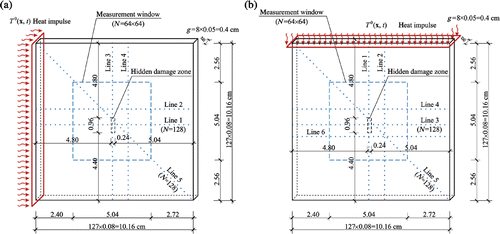
Figure 8. The function of temperature condition.
Two types of transformation will be used: the 1D DWT of the temperature recorded in the finite element nodes along the lines 1–6 depicted in and the 2D DWT of the data recorded in the 64 × 64 nodes of the measured window.
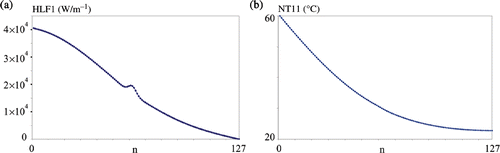
To illustrate the problem of defect identification, the horizontal component of heat flux and the temperature along the line 1 in the plate A for the hole depth 1.0 mm are presented in . The values were registered at the time instant 50.9 s from the beginning of the process. In the problem, the film (convection) coefficient was equal to 7.0 W (m2 K)−1 on all faces except the left one, where the temperature condition was prescribed. It is worth noticing that the graph of heat flux HFL1 indicates the position of the defect, whereas the temperature distribution NT11 (which is measurable in the real experiment) does not.
Figure 9. Transient problem with convection for plate A, depth of the defect 1.0 mm: (a) the horizontal component HFL1 of heat flux, (b) the temperature NT11 distribution along the line 1 at the time instant 50.9 s.
4.2.1. Defect detection using 1D DWT
In both cases of heat flux direction (plates A and B) the temperature signal is recorded in 128 discrete nodes along the lines 1–6, for various hole depths.
The selected results of the transforms for the plate A are presented in . It was easy to predict that the most visible disturbance in the transform would be in the case of the signal along the horizontal line 1 and diagonal line 5. Using the wavelets Daubeschies D8 and D6 the defect is noticeable in the case of the hole depth 1.0 mm, whereas wavelets D4 and D2 are useful only when the depth is 2.0 mm or greater. What is interesting is the comparison of the components of the transform.
Figure 10. The graph of 1D DWT, plate A, line 1: (a) hole depth gd = 1.0 mm, wavelet D8, detail D3, (b) gd = 1.0 mm, wavelet D6, detail D2, (c) gd = 2.0 mm, wavelet D4, detail D1, (d) gd = 2.0 mm, wavelet D2, detail D2.
Usage of the data recorded along the line 2 is absolutely not effective in the process of defect detection. The results along the vertical lines 3 and 4 exhibit small disturbances in the transform for a relatively large defect of 2.5 mm (). It means that practically the localization of the defect is possible only if we analyse the distribution of the temperature along the main direction of heat flux and when the hole is orientated perpendicularly to the heat flux.
Figure 11. The graph of 1D DWT, plate A, hole depth gd = 2.5 mm: (a) line 3, wavelet D6, detail D3, (b) line 4, wavelet D4, detail D3.
In plate B, when the direction of heat flux in the experiment is collinear with the main axis of the defect, the localization of the defect is very difficult. Our simulations showed that in this case the disturbances exhibited by WT are usually small and not precisely concentrated in the place of defect. This result was expected and yet it is valuable, because similar difficulty can be faced when the flux direction is collinear with the main axis of the crack.
4.2.2. Defect detection using 2D DWT
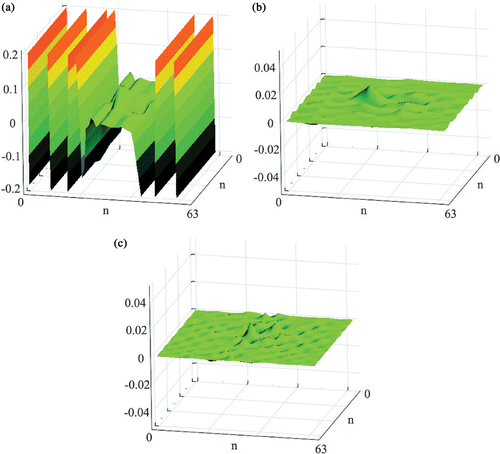
The region of the temperature field which was processed is depicted in . The measurement windows contain 64 × 64 = 4096 records. It means that the maximum level (and number of details) of multiresolution decomposition of the 2D signal equals 6. All results are presented at the time instant 50.9 s.
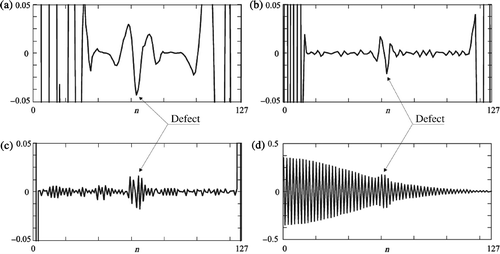
presents the temperature field for the plate A with the defect depth 1.0 mm and corresponding wavelet transform, detail D3 using wavelet D6. Please note that, similarly as in , the defect is almost invisible in the temperature graph. On the contrary, the complete detail of wavelet transform shows a distinct peak in the place of defect. As a complete detail, we understand the sum of horizontal, vertical and diagonal details at a certain level.
Figure 12. Transient heat transfer problem for the plate A with the defect depth 1.0 mm: (a) scheme of the problem, (b) temperature distribution in the measurement window, (c) 2D DWT, wavelet D6, detail (complete) D3.
The 2D DWT provides information on the whole 2D signal, therefore it enables the localization of all signal disturbances in only one analysis. Next, precise signal processing can be continued using 1D transform and Lipschitz exponent. Let us remember that 2D wavelet transform consists of three components, namely horizontal, vertical and diagonal. Each component at each level expresses different features of the signal. Three components of the complete detail D3 shown in are presented in . In the horizontal component large boundary disturbances appear. This effect can be attributed to a large difference between the temperatures on the left and right edges of the measurement window. At the same time, in the middle part of the window, in the place of the defect, the highest peak is observed, comparing all other components. The methods of minimization of boundary disturbances and issues of the detection of several defects and assessment of defect orientation are discussed in Citation19.
Figure 13. The plate A with the defect depth 1.0 mm, 2D DWT, wavelet D6, components of detail D3: (a) horizontal (direction perpendicular to the defect), (b) vertical D
, (c) diagonal D
.
In the plate B, contrary to the plate A, the heat flux is collinear with the main axis of the defect. A lower efficiency of defect detection than in the plate A can be expected. presents solutions equivalent to those presented for plate A in , namely the temperature field and 2D DWT, wavelet D6, complete detail D3. The temperature disturbances are practically invisible. Even in the case of a very large defect, the signal disturbances are very small and appear mainly on the opposite sides of the defect. It makes proper identification very difficult. presents all components of the detail D3. Analysis of the components leads to similar conclusions as in the case of plate A, but this time the defect localization seems to be much more difficult.
Figure 14. Transient heat transfer problem for the plate B with the defect depth 1.0 mm: (a) scheme of the problem, (b) temperature distribution in the measurement window, (c) 2D DWT, wavelet D6, detail (complete) D3.
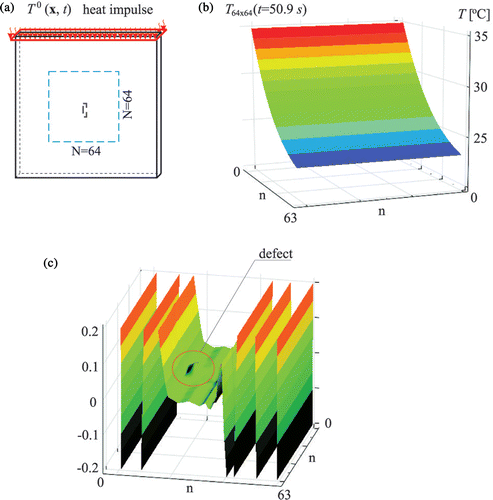
Figure 15. The plate B with the defect depth 1.0 mm, 2D DWT, wavelet D6, components of detail D3: (a) horizontal D (parallel to the defect), (b) vertical D
, (c) diagonal D
.
To compare defect identification in plates A and B, wavelet transforms of respective temperature fields (depth of the defect 3.0 mm) are presented in . Both graphs show 2D DWT, wavelet Daubechies 6, complete detail D2. Figure 16 (a) and (b) proves that in both cases A and B damage localization is possible. However, it is more difficult in case B, when the heat flux direction is parallel to the main axis of the defect. One interesting thing is that in both cases the form of the disturbances in the transform gives us suggestions about the orientation and extent of the defect. The magnitude of the local disturbances may be useful in the assessment of the defect intensity, but in fact this issue must be studied further.
Figure 16. The graphs of detail D2 = D + D
+ D
, wavelet D6, defect depth 3.0 mm: (a) plate A, (b) plate B.
4.2.3. Lipschitz exponent
In order to evaluate the local disturbance in the analysed temperature signal and in this way to assess the magnitude of the defect, Lipschitz condition will be used. To evaluate the usefulness of the Lipschitz exponent α, as a measure of defect intensity, the 1D signals (temperatures recorded along a line) will be analysed for various orientations and depths of a defect. The influence of the employed wavelet type and addition of white noise representing measurement errors will be considered, too. The Lipschitz exponent was estimated for plate A, lines 1, 2 and 5, and for plate B, lines 1, 5 and 6 (). In every case, the temperatures in N = 128 discrete points along the respective line are recorded and processed using wavelet transform. Because of the number of points, the maximum level of the transform is 7 (27 = 128). Local extremes of the transform |W f(xd = ν|) are found and Lipschitz exponent is assessed using Equation (13) and the relation between log2|Wf(xd = ν)| and level of the transform j. In the linear approximation of the relation, linear Tchebychev polynomial is used.
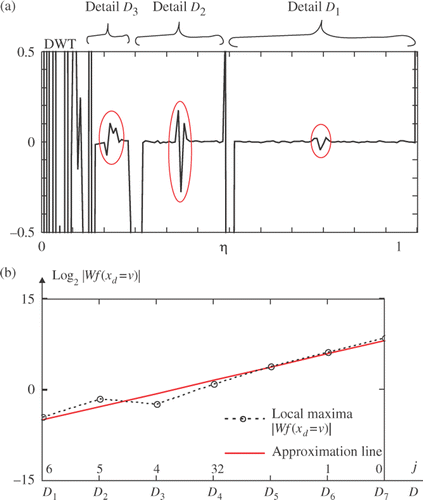
presents local extremes of the DWT and shows the line approximating the value of Lipschitz exponent in the case of plate A, depth of the defect 2.5 mm and temperature at the time instant 50.9 s recorded along line 1. Wavelet Daubechies 6 is used.
Figure 17. The plate A, defect 2.5 mm, line 1, time 50.9 s, wavelet D6: (a) local extremes of DWT, (b) log2|Wf(xd = ν)| values versus the level of the transform j, approximation line.
In the case of plate A, the values of Lipschitz exponent evaluated for various depth of the defect, using wavelets Daubeschies 6 and Daubeschies 8 are presented in and , respectively.
Table 1. Values of Lipschitz exponent α with respect to defect depth gd, plate A, lines 1, 2, 5, wavelet Daubechies 6.
Table 2. Values of Lipschitz exponent α with respect to defect depth gd, plate A, lines 1, 2, 5, wavelet Daubechies 8.
It may be noticed that for both D6 and D8 wavelets, there is a close relation between the depth of the defect and the value of the exponent α. A nearly linear relation in the case of line 1 is presented in . With the increase of the defect depth, the exponent, which is a measure of signal continuity, decreases. The exponent along lines 1 and 5, for both analysing wavelets, takes similar values between 1.5 and 3.0. The case of line 2 indicates that along this line local disturbances of the temperature are not sensitive to the defect depth. To illustrate the obtained values α, it should be said that the value α = 1 would appear if a signal is C0 class. In the case of no damage (first column) the exponent reaches the value 3.0 and it corresponds to the state, when the function and its two derivatives are continuous (class of the function C2).
Figure 18. The relation between the Lipschitz exponent α and the depth of the defect gd, plate A, line 1.
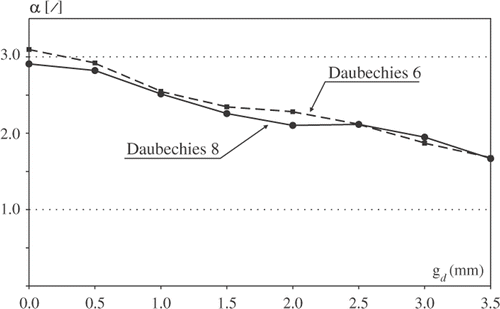
Please note that the choice of D6 and D8 wavelets is not accidental. Wavelet Daubechies 6 has three vanishing moments and, therefore, the Lipschitz exponent can reach 3, whereas Daubechies 8 has four vanishing moments and hence maximum α is 4. The results in the tables indicate that the temperature functions along line 1 and 5 are maximum class C2. With Daubechies 6 the exponent reaches the value 3.0, however a higher order wavelet, e.g. D8 or higher, should be used to confirm that it is the maximum level of continuity of this function.
The same approach is used in the case of plate B and respective results are presented in and and . In the case of the plate B, the proper estimation of the exponent α is more difficult. It is because the extrema are less visible in the transform (). Nevertheless, the exponent similarly as in the case of A, reaches the value 3.0 for a plate without damage and is about 1.6 when the defect depth is equal to 3.5 mm.
Figure 19. The plate B, defect 2.5 mm, line 1, time 50.9 s, wavelet D6: (a) local extremes of DWT, (b) log2|Wf(xd = ν|) values versus the level of the transform j, approximation line.
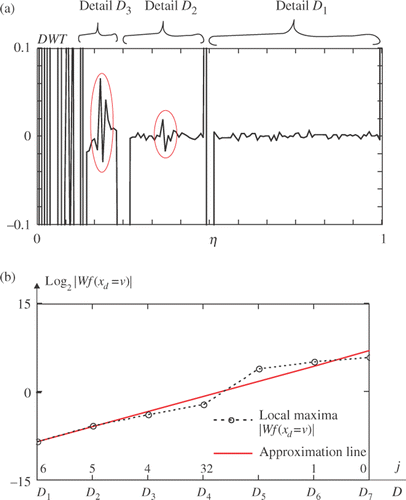
Table 3. Values of Lipschitz exponent α with respect to defect depth gd, plate B, lines 1 and 5, wavelet Daubechies 6.
Table 4. Values of Lipschitz exponent α with respect to defect depth gd, plate B, lines 1 and 5, wavelet Daubechies 8.
4.2.4. White noise
In a real experiment, measurement errors cannot be avoided. To study how measurement errors decrease the efficiency of damage detection, the white noise was added to the temperature field computed with FEM. A random number generator from uniformly distributed errors was used. Its default range of errors ±0.5 was scaled back so that the errors were generated from the assumed range (○C). Effectiveness of damage detection for various values of
was studied. In real experiments the range of errors depends first of all on the precision of the infrared camera. Three levels of DWT with their local extrema for various white noise ranges are presented in .
Figure 20. The plate A, defect 2.5 mm, line 1, time instant 50.9 s, wavelet D6, all levels of DWT of temperature signal: (a) range of error ±0.05○C, (b) ±0.08○C, (c) ±0.10○C.
The values of the Lipschitz exponent assessed for various levels of white noise are presented in . The values in the table are comparable with the results presented in . Please note that in the case of a large defect, the exponent increases if the noise increases. An opposite relation was observed in the case of a small defect, as the exponent decreases if the noise increases.
Table 5. Values of Lipschitz exponent α with respect to defect depth gd, plate A, line 1, wavelet Daubechies 6, signal with the white noise ±0.05○C, ±0.08○C and ±0.10○C.
4.2.5. Denoising of temperature response signals using DWT
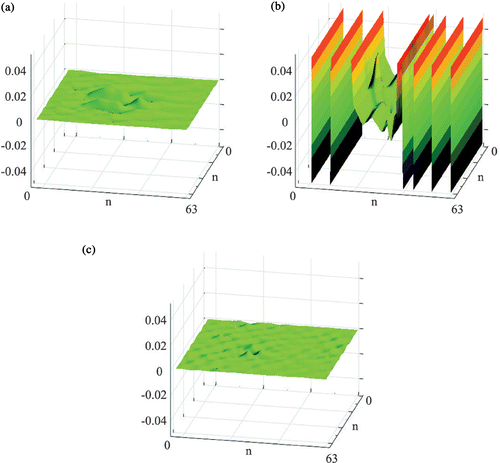
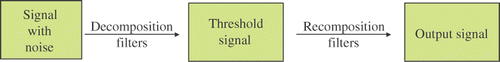
In this section we will process different structural response signals of a damaged structure, namely: ideal signals obtained from a computer simulated experiment using FEM, signals contaminated with white noise and the latter ones subjected to denoising process. In this way, we will study the usefulness of denoising in defect detection. The wavelet shrinkage technique will be used to denoise a signal. The procedure consists of three steps, as shown in . In the first step the signal with noise is decomposed using DWT and its representation expressed by transform coefficients is computed. The second, the denoising step, is crucial because the signal is subjected to appropriate filtration (threshold elimination) and coefficients which do not fulfill respective threshold condition are removed. Various methods of filtration are known. They can be divided into two groups: hard and soft threshold elimination. In the former one, wavelet coefficients whose absolute value is lower than the threshold are removed. In the soft one, identical elimination of small coefficients takes place, but, simultaneously, the remaining coefficients are reduced by the threshold. Soft method allows us to avoid discontinuities appearing in the application of hard threshold. Therefore, in this article soft elimination is used. In the third step the inverse DWT is applied and a de-noised signal is obtained. It is expected that this signal contains all essential features of the original one. The threshold value should be chosen high enough to make denoising effective, however too high a threshold removes essential features of a signal. In all professional programs for wavelet analysis the threshold is set automatically. In this article this value was introduced in two ways: automatically using median function and optimized manually.
Figure 21. The scheme of the wavelet shrinkage procedure.
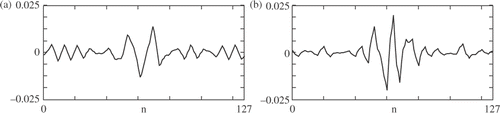
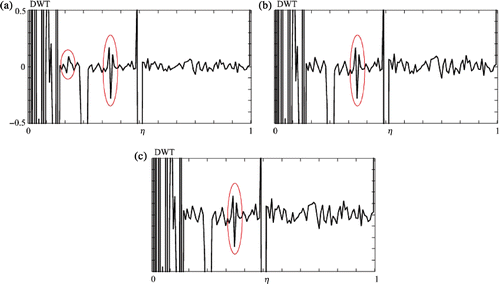
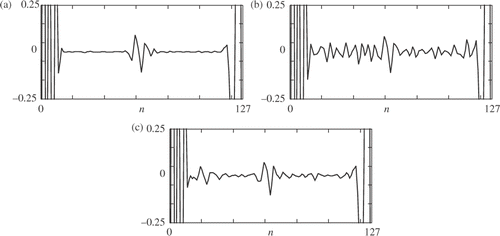
Application of the wavelet shrinkage procedure is demonstrated in . Here presents DWT, wavelet D6, detail D2 of the ideal temperature field, plate A, line 1, time instant 50.9 s, depth of the defect 2.5 mm. shows the same detail, but referred to the former temperature signal contaminated with white noise ±0.10○C. It can be observed that this level of noise induced high oscillations and the defect localization is no more possible. shows the DWT, detail D2 of the signal obtained by denoising of the contaminated signal. In the denoising procedure wavelet D8 was used. Again, the localization of the defect became possible.
Figure 22. Application of wavelet shrinkage procedure. The plate A, defect 2.5 mm, line 1, time 50.9 s, wavelet D6, detail D2: (a) DWT of original signal without noise, (b) DWT of signal with white noise ±0.10○C, (c) DWT D6 of signal after threshold elimination using D8.
Application of the wavelet shrinkage procedure needs a properly chosen type of wavelet. It does not need to be the same type, as will be next used to the wavelet analysis of the denoised signal. In the example presented below, the DWT D8 proved to be most efficient in the wavelet shrinkage.
The values of the Lipschitz exponent calculated for the signal after denoising procedure are presented in .
Table 6. Values of Lipschitz exponent α with respect to defect depth gd, plate A, line 1, wavelet Daubechies 6, signal with the white noise ±0.05○C, ±0.08○C and ±0.10○C subjected to wavelet shrinkage procedure.
5. Experimental studies
5.1. Test E1
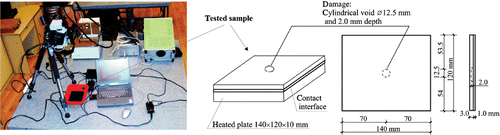
A defect localization procedure in the case of transverse heat flux was verified by the method of the experiment with the steel specimen 140 × 120 × 4 mm. The specimen was compounded of two plates connected by a special glue which conducted heat very well. The plate with the thickness of 3.0 mm had a cylindrical void with the diameter 12.5 mm and the depth 2.0 mm. The second plate was 1 mm thick. These steel elements were glued in such a way that the void was hidden inside the structure with the distance 1.0 mm to both surfaces. The upper surface, which was assigned to measurement of temperature field, was sprayed with a black matt paint to obtain uniform thermal emission. In the experiment a horizontal base plate, made of steel, with dimensions 140 × 120 × 10 mm, warmed up to 100○C served as a heat source for the tested specimen with the hidden void. The last one was laid on the base plate, with the interface of good thermal conductivity. This interface was made by gluing a very thin layer to the upper surface of the base plate. Thus, the Dirichlet boundary condition, similar to the one shown in , was experimentally modelled. The test ran in the following way. The base plate was heated in boiling water and then put into a horizontal position. Immediately, the tested specimen was pressed against the base plate. The thin soft plate, soaked with the water interface ensured good heat conduction from the base plate to the upper one. In this way the transverse heat flux was induced in the tested specimen with the void. The set-up for active thermography and geometry of the specimen are presented in . The contact interface is marked there. The temperature field was recorded on the upper surface of the specimen with the frequency 5 Hz. The experiment lasted for 85.9 s, hence 430 thermograms were recorded.
Figure 23. Set-up of the experimental equipment and geometry of the tested specimen with hidden void.
The recording of the temperature field was realized using a long-wave infrared camera FLIR SC2000 with non-cooling detector 320 × 240 pixels. To process thermograms, the software ThermaCAM Explorer99 and ThermaCAM Reporter were used. The parameters of the set-up are: thermal sensitivity 0.1○C at 30○C, recording time of IR Camera 25 images per second (25 Hz) and nominal accuracy 0.2○C.
The thermogram for the time instant t = 0.5 s and the spatial distribution of the temperature are presented in .
Figure 24. The thermogram recorded for the time instant t = 0.5 s and spatial distribution of the temperature.
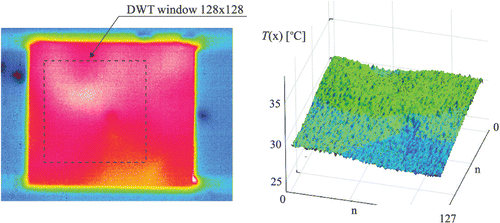
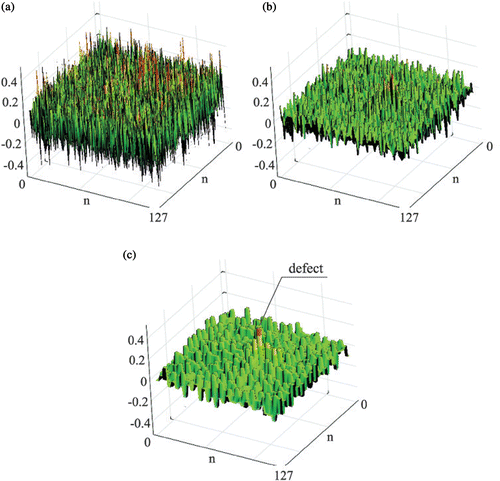
The experimental temperature field (measured window 128 × 128 nodes) was subjected to thorough decomposition and analysis using various wavelets. It occurred that the best results of defect detection were achieved using the simplest, orthogonal and symmetric Haar wavelet. shows decomposition of the signal, details D1, D2 and D3 for the time instant t = 0.5 s. The defect is properly localized by the detail D2, but is best visible in the detail D3. It should be emphasized that similar results were achieved for other time instants; however, disturbance of the transform decrease with time.
Figure 25. 2D DWT of the temperature field using Haar wavelet for the time instant t = 0.5 s: (a) detail D1, (b) detail D2, (c) detail D3.
5.2. Test E2
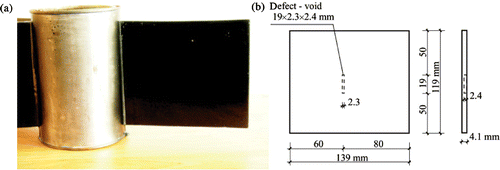
The aluminium plate 139.4 × 119.0 × 4.1 mm with the longitudinal void 2.3 × 19 mm and depth 2.4 mm was subjected to thermal excitation. The heat flux was induced by using a small steel container with boiling water. The plate was solidly attached to the container along the shorter edge by a special glue which conducted heat very well. The void was localized in the plate on its surface opposite to the one, which was observed during the test. The plate was sprayed with the black matt paint. The specimen with the water container is presented in . The experiment lasted for 90 s.
Figure 26. The specimen with the water container: (a) a front view, (b) scheme of the plate with the void.
The thermograms presented in illustrate sequentially transient heat transfer problem. Heat propagation started non-uniformly from the lower corner of the aluminium plate because filling the container with boiling water lasted for about 1 s. The process of propagation stabilized within 30 s ().
Figure 27. The recorded thermograms: (a) t = 3 s, (b) t = 10 s, (c) t = 22 s, (d) t = 32 s.
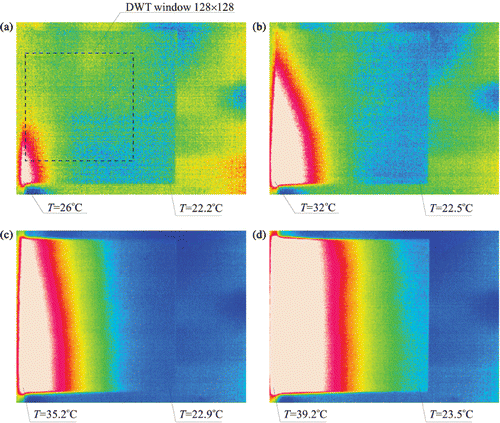
The thermograms themselves do not give a clear indication that the defect exists in the plate even though very small temperature refraction in the vicinity of the void can be discerned. They need DWT analysis.
5.2.1. Analysis of thermograms using 2D DWT
The temperature fields recorded in the experiment by the infrared camera were next subjected to the 2D decomposition with the window 128 × 128 nodes presented in . Numerous temperature fields corresponding to various time instants from 7 to 62 s were processed using 2D DWT. A number of wavelet types were tested and different complete or separated components of details were analyzed. An example result of the DWT analysis is presented in .
Figure 28. Analysis of the temperature field T128×128 of the plate with the void, time instant t = 30 s: (a) the temperature distribution within the measured window, (b) 2D DWT of the signal using Haar wavelets, component D, (c) signal denoised using Daubechies 8 wavelet.
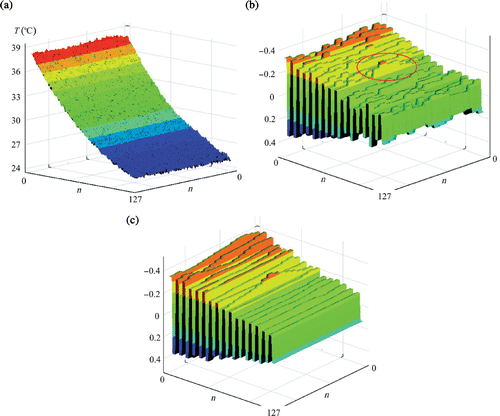
In line with our expectations based on numerous studies, thermograms recorded for later time instants are more useful in the defect identification. Disturbances in the transform came out after 23 s. presents the transform, component D in 30 s, where and when the disturbances caused by the defect are most pronounced. Nevertheless, they are not very intensive. Rather unexpectedly, the only wavelet which turned out to be useful was the Haar wavelet.
5.2.2. Signal denoising
In order to make the defect detection more effective, the recorded temperature fields were subjected to noise reduction process. The same wavelet shrinkage procedure as in Section 4.2.5 was applied, namely the soft threshold elimination using Daubeschies 8 wavelet. As a result, the ‘smooth’ signal was obtained. The transform of the denoised signal in the case of analysing the Haar wavelet and detail D is presented in . Denoising improved the damage detection.
It is worth mentioning that in both cases the details D1 and D2 do not exhibit local high disturbances in the vicinity of the defect. Moreover, only the vertical component of detail D3 is useful in the void detection. This component corresponds to the direction perpendicular to the defect orientation. The result of the transform analysis is similar to the numerical example.
6. Concluding remarks
The efficiency of DWT in damage identification based on the transient heat conduction experiments was studied by way of a number of examples. All examples referred to plate structures. Steel and aluminium plates with defects in the form of voids and inclusions were considered. The thermal response fields were recorded on a surface of the plate. These thermal response signals were stored in discrete forms and analysed using various types of orthogonal wavelets, namely Haar, Daubechies 4, 6 and 8. The efficiency of the method was studied based on three classes of temperature fields: (1) obtained from numerically simulated experiments using FEM, (2) from similar experiments but with the addition of white noise and (3) from real experiments. The available improvement of the efficiency of damage detection by denoising temperature fields of classes 2 and 3 was studied. The usefulness of Lipschitz exponent evaluated with the use of DWT and applied to temperature response signals was discussed, too.
The examples demonstrated that DWT applied to thermal response signals of a defected structure is useful in damage detection. Even though the steady state heat transfer experiments combined with DWT analysis allow the damage detection as shown in Citation15, this article confirms that experiments with transient heat transfer are more efficient. However, in the latter case, proper time instant of recording the temperature field plays a crucial role. The best results are the time instants when the front of the thermal wave has just passed the place of damage. Since it is not known in advance, one needs to record and analyse thermal images at various time instants. In the majority of examples it was observed that 1D DWT gives better information on damage than 2D DWT, provided that the former one was applied to temperature recorded along a line passing through the damage or running in the vicinity of damage. Therefore, what can be recommended is the application of 2D DWT with the aim of finding if damage exists and to recognize its position, and then the extraction of the appropriate 1D signal from the 2D image and the application of 1D DWT for finer analyses. The authors have experienced from the solution of the examples presented in this article and from many others that it is not sufficient to state which type of discrete wavelet is the best one. Higher order wavelets with a greater number of vanishing moments are able to capture higher order singularities, but they have greater supports which require more measurement points and they provide bigger disturbances at the boundary of the window. Therefore, the choice of the best type of wavelet is problem dependent. In fact, as observed in Citation12, the choice between wavelets of different orders is a compromising solution. A practical recommendation can be to start the DWT analyses with relatively simple wavelets and continue it with higher order ones. In the discussed class of problems, the best one most often proved to be Daubechies 8 wavelet.
The examples presented in this article demonstrate that there is an evident relation between the value of the Lipschitz exponent and the magnitude of damage. Hence, there are good prospects for using it in the evaluation of damage parameters. At the present state of knowledge it cannot be done in a straightforward way. It must still be subject to further studies. However, one optimistic observation from the presented examples is that the Lipschitz exponent can be evaluated with the use of DWT applied to thermal response signals even when they are contaminated with white noise of limited intensity. Denoising thermal response signals with the use of soft threshold wavelet shrinkage procedure improves the effectiveness of defect identification and estimation of Lipschitz exponent.
The efficiency of damage detection depended on its parameters. The examples confirmed that this is what follows from the theory of heat flow. Greater disturbance in thermal response signal and hence better efficiency of damage detection was observed for defects of greater magnitude, when located near the surface where temperature was measured, when defect's longitudinal axis was perpendicular to heat flux direction, for steel specimens having lower thermal conductivity than aluminium.
The examples of damage detection based on real experiments of transient heat transfer and measurements of temperature fields with the infrared digital camera showed a good qualitative agreement with the examples based on numerically simulated experiments. The quantitative comparison was not possible because of insufficient precision of the IR camera, used in the experiments. Taking into account the increasing precision of new developed high-resolution IR cameras, it can be expected that the method presented in this article can be applied in practice in the near future.
Acknowledgements
Financial supports by Ministry of Science and Higher Education under grant No. N506 396835 (Z. Pozorski, A. Garstecki) and Poznan University of Technology grant DS 11-037/2009 (K. Ziopaja) are kindly acknowledged.
References
- Alvin, KF, Robertson, AN, Reich, GW, and Park, KC, 2003. Structural system identification: From reality to models, Comput. Struct. 81 (2003), pp. 1149–1176.
- Stavroulakis, GE, Bolzon, G, Waszczyszyn, Z, and Ziemiański, L, 2003. "Inverse analysis". In: Karihaloo, B, Ritchie, RO, and Milne, I, eds. Comprehensive Structural Integrity. Vol. 3. Oxford: Elsevier Science; 2003. pp. 51–90.
- Dems, K, and Mróz, Z, 2001. Identification of damage in beam and plate structures using parameter dependent frequency changes, Eng. Comp. 18 (1–2) (2001), pp. 96–120.
- Ziemiański, L, 1984. Positive bases in numerical optimization, Comput. Optim. Appl. 21 (1984), pp. 169–175.
- Maldague, X, 2002. Introduction to NDT by active infrared thermography, Materials Eval. 9 (2002), pp. 1060–1073.
- Avdelidis, NP, Hawtin, BC, and Almond, DP, 2003. Transient thermography in the assessment of defects of aircraft composites, NDT&E Int. 36 (2003), pp. 433–439.
- Wu, D, and Busse, G, 1998. Lock-in thermography for nondestructive evaluation of materials, Rev. Gn. Therm. 37 (1998), pp. 693–703.
- Carlomagno, GM, and Meola, C, 2002. Comparison between thermographic techniques for frescoes NDT, NDT&E Int. 35 (2002), pp. 559–565.
- Chui, CK, 1992. An Introduction to Wavelets. San Diego: Academic Press, Inc.; 1992.
- Newland, DE, 1993. Random Vibrations, Spectral and Wavelet Analysis, . New York: Longman, Harlow and John Wiley; 1993.
- Wang, Q, and Deng, X, 1999. Damage detection with spatial wavelets, Solid Struct. 36 (1999), pp. 3443–3468.
- Douka, E, Loutridis, S, and Trochidis, A, 2003. Crack identification in beams using wavelet analysis, Solid Struct. 40 (2003), pp. 3557–3569.
- Gentile, A, and Messina, A, 2003. On the continuous wavelet transform applied to discrete vibrational data for detecting open cracks in damaged beams, Solid Struct. 40 (2003), pp. 295–315.
- Galmiche, F, Vallerand, S, and Maldaque, X, , Pulsed phased thermography with the wavelet transform, Am. Inst. Phys. 19A (2000), pp. 609–615.
- Ziopaja, K, Pozorski, Z, and Garstecki, A, 2006. Application of discrete wavelet transformation in damage detection, Comp. Assisted Mech. Eng. Sci. 13 (2006), pp. 39–51.
- Gentile, A, and Messina, A, 1992. Singularity detection and processing with wavelets, IEEE Trans. Infor. Theory 38 (2) (1992), pp. 617–643.
- Hong, J-C, Kim, YY, Lee, HC, and Lee, YW, 2002. Damage detection using the Lipschitz exponent estimated by the wavelet transform: Applications to vibration modes of a beam, Solid Struct. 39 (2002), pp. 1803–1816.
- Dems, K, and Mróz, Z, 2006. Application of thermographic fields in identification of structural properties and defects, Comp. Assisted Mech. Eng. Sci. 13 (2006), pp. 3–19.
- Pozorski, Z, and Ziopaja, K, 2004. Damage identification by wavelet transformation of data measured in thermal processes, Proc. Appl. Math. Mech. 4 (2004), pp. 410–411.