Abstract
A non-intrusive inverse heat transfer procedure for predicting the time-varying thickness of the phase change ledge on the inside surface of the walls of a high-temperature metallurgical reactor is presented. A Kalman filter, based on a state-space representation of the reactor, is coupled with a recursive least-square estimator in order to estimate online the position of the phase front. The data are collected by a heat flux sensor located inside or outside of the reactor wall. The inverse method, used here as a virtual sensor, is coupled to a classic proportional–integral controller in order to control the ledge thickness by regulating the air cooling applied on the outside surface of the reactor wall. The virtual sensor and the control strategy are thoroughly tested for typical phase change conditions that prevail inside industrial facilities. Results show that a virtual sensor that relies on a heat flux sensor embedded inside the reactor wall provides more accurate and stable information, but at a price of a more complicated installation. In that case, it is shown that the discrepancy between the exact and the estimated ledge thicknesses remains smaller than 3% at all times, and that the control strategy ensures a null steady-state tracking error, a maximum tracking error less than 10%, no overshoot and no significant time lag.
Nomenclature
| A | = | FDM matrix |
| = | state-space matrix | |
| = | state-space matrix | |
| = | state-space matrix | |
| = | specific heat (J kg−1 K−1) | |
| = | time step (s) | |
| = | space step (m) | |
| = | width of the PCM layer (m) | |
| = | tracking error (m) | |
| = | liquid fraction | |
| = | optimal Kalman gain | |
| = | RLSE correction factor | |
| = | heat transfer coefficient (W m−2 K−1) | |
| = | identity matrix | |
| = | thermal conductivity (W m−1 K−1) or sampling instant | |
| = | a priori estimate | |
| = | a posteriori estimate | |
| = | controller proportional gain | |
| = | width of the brick wall (m) | |
| = | maximum value | |
| = | RLSE sensitivity matrix | |
| = | initial RLSE sensitivity matrix | |
| = | total number of input/output data | |
| = | heat flux (W m−2) | |
| = | input heat flux imposed at the boundary x = L + D (W m−2) | |
| = | estimated input heat flux (W m−2) | |
| = | initial estimated input heat flux (W m−2) | |
| = | heat flux measurements (W m−2) | |
| = | covariance matrix of the estimated state | |
| = | initial covariance matrix of the estimated state | |
| = | covariance matrix of the estimated heat flux | |
| = | initial covariance matrix of the estimated heat flux | |
| = | covariance matrix of the process noise | |
| = | ledge thickness set point (m) | |
| = | covariance matrix of the measurement noise | |
| = | ledge thickness (m) | |
| = | estimated ledge thickness (m) | |
| = | residual covariance | |
| = | time (s) | |
| = | temperature (K) | |
| = | integral time constant (s) | |
| = | input signal vector | |
| = | estimated input signal vector | |
| = | measurement noise (W m−2) | |
| = | PEM algorithm cost function | |
| = | process noise | |
| = | RLSE sensitivity matrix | |
| = | state vector or space direction | |
| = | estimated state vector | |
| = | initial estimated state vector | |
| = | measurement vector (W m−2, m) | |
| = | measurement residual (W m−2) | |
| = | predicted output of the state-space model (W m−2, m) |
| = | parameter related to RRMSE | |
| = | parameter related to RRMSE | |
| = | volumetric enthalpy change (J m−3) | |
| = | difference between the outputs of the FDM and the state-space model | |
| = | RLSE forgetting factor | |
| = | heat of fusion (J kg−1) | |
| = | density (kg m−3) | |
| = | process noise standard deviation (W m−2, m) | |
| = | measurement noise standard deviation (W m−2) |
| = | initial or constant | |
| = | ambient | |
| = | brick wall | |
| = | liquidus | |
| = | liquid (PCM) | |
| = | solidus | |
| = | solid (PCM) |
| = | transposed matrix |
1. Introduction
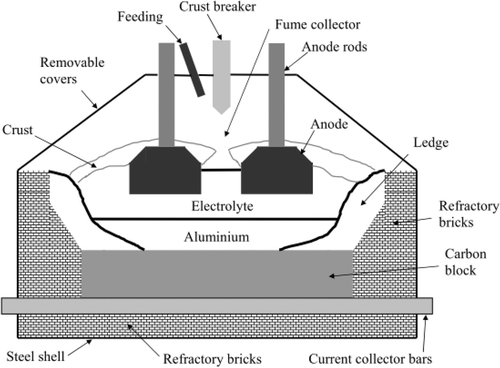
An interesting melting/solidification phenomenon that arises in high-temperature metallurgical reactors such as electric arc furnaces Citation1, blast furnaces Citation2 and aluminium electrolysis cells Citation3 is the formation of solid layers, sometimes called ledges or banks, on the inside surface of the reactor (). This ledge is formed as the molten material comes into contact with the cooled surface of the wall and solidifies. The presence of the ledge is highly desirable. It serves as a protective barrier against the corrosive molten material, thereby maintaining the integrity of the cell and prolonging its active life Citation4,Citation5. On the other hand, too thick a ledge is detrimental to the reactor as the active cell volume is reduced, and in the case of electrolysis cells, horizontal currents may be generated thereby disturbing the magneto-hydrodynamics stability of the cell and, as a result, decreasing the current efficiency Citation5,Citation6. Maintaining a ledge of optimal size at all times is therefore crucial for the safe and profitable operation of the metallurgical reactor.
Figure 1. Cross view of a typical high-temperature metallurgical reactor; an aluminium electrolysis cell with molten material (electrolyte) and protective ledge.
Unfortunately, due to the hostile conditions that prevail inside the reactor, probing the time-varying thickness and shape of the ledge with sensors submerged into the molten electrolyte is a very difficult task, not to say impractical. The standard method for measuring the thickness of the ledge is to probe it manually Citation7. This method is time consuming and requires qualified personnel to perform the task. Also, the measurements are usually taken days apart and they require the opening of the cell which results in significant heat losses to the surroundings and the release of undesirable chemicals into the atmosphere Citation8.
The alternative is to attempt to predict the ledge profile with inverse heat transfer methods that rely on thermal measurements taken from sensors located in the reactor walls. This non-intrusive method can be seen as a virtual sensor, or soft sensor, defined as the combination of an estimation algorithm with measurements that allows to estimate on-line ‘hard to measure’ process variables Citation9.
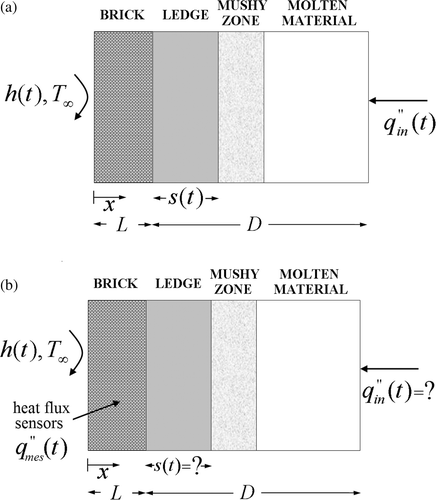
The prediction of banks or ledges on reactor walls with inverse heat transfer methods has been the subject of few investigations in the past Citation1,Citation10–14. shows such an inverse one-dimensional (1-D) problem where the ledge is represented by the solid phase of the phase change material (PCM). In the direct problem (), the time-varying heat flux at the right boundary is known. In the inverse problem (), the time-varying heat flux
at the right boundary is unknown. It can be estimated, however, with an inverse method that uses heat flux sensors
located inside or on the external surface of the brick wall. With the estimated heat flux
, the ledge thickness
can therefore be evaluated.
Figure 2. Schematic of a 1-D phase change problem inside a high-temperature metallurgical reactor. (a) Direct problem: and
are known;
,
and
are predicted with the finite difference numerical model. (b) Inverse problem:
is unknown. It is determined from heat fluxes measurements
taken inside or outside the brick wall. With this information, the ledge thickness
is estimated.
Most of the proposed inverse calculation strategies rely on the conjugate gradient method with an adjoint equation. These strategies are referred as the Alifanov's iterative regularization method. In spite of its success, this method is CPU time consuming, because in most cases, it uses complex direct models composed of finite differences or finite elements. As the simulation time and the number of nodes grow, the conjugate gradient method with an adjoint equation become computationally inefficient Citation15,Citation16. Other inverse strategies employ the virtual area method. In spite of the fact that the least-square algorithm is CPU time efficient, this method is applied to problems for which heat conduction is the sole thermal process, i.e. there is no phase change. Also, this inverse technique is only employed with a temperature sensor (not a heat flux sensor) and the simulations are conducted in steady-state. In the iron smelting industry, inverse methods have also been applied in order to estimate the lining erosion inside blast furnaces. Such methods include Alifanov's iterative regularization method Citation17–19 and the Fourier series combined with an elastic membrane concept Citation20. Even if these inverse techniques are formulated for two-dimensional (2-D) heat transfer, the main drawback is that they are also limited to the steady-state regime, which is not interesting for online inverse predictions or for control applications. Finally, the vast majority of inverse methods rely on temperature measurements Citation15,Citation16,Citation21,Citation22 due to the fact that it is one of the easiest measured physical quantities in thermal sciences. However, this study focuses on heat flux measurements only. As reported in references Citation23,Citation24, using heat flux measurements in the inverse calculation enables to recover the unknown variables much more efficiently. This can be explained by the fact that a heat flux corresponds to a vector (modulus, direction), hence providing a richer information than the temperature which is only a scalar quantity (modulus) Citation24.
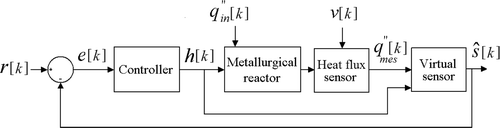
Moreover, in an industrial context, the interest (and the challenge) is to control at all times the thickness of the ledge. A classic feedback loop used for control process is shown in Citation25. The measurement given by a sensor is first subtracted to the desired set point. From this error, the controller calculates the control action needed for the process that will ensure the desired set point even if the process is subjected to disturbances.
Figure 3. Classic feedback loop Citation25.
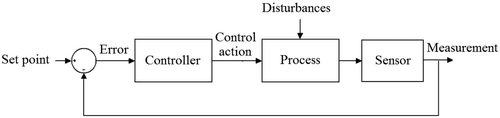
This feedback loop implies that the measurement from a sensor is available. In the case of metallurgical reactors, it means that a ledge thickness sensor exists. This is obviously not the case since the hostile conditions that prevail inside the molten bath forbid it. Moreover, manual measurement of the ledge thickness is not only impractical but also barely useful as the frequency of the data collection is bound to remain insufficient.
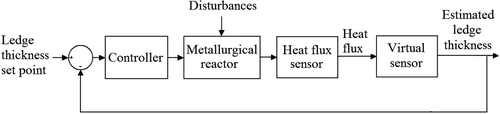
The objective of this study is to combine a virtual sensor, which provides an estimation of the ledge thickness from heat flux measurements, to a control strategy that will ensure the desired ledge thickness even when the process is subjected to disturbances ().
Figure 4. The control of the ledge thickness in high-temperature metallurgical reactors using a virtual sensor.
This article is organized as follows. First, a finite difference model (FDM) is developed for predicting the nonlinear melting/solidification process inside the reactor. Second, a state-space model of the reactor, more computationally efficient than the FDM, is presented. Third, the inverse method (the virtual sensor), combining a Kalman filter, a recursive least-square estimator (RLSE) and the state-space model, is shown. The virtual sensor enables to estimate the ledge thickness from heat flux measurements taken inside or outside of the reactor walls. And finally, the control strategy, a classic proportional–integral (PI) controller, is coupled with the virtual sensor in order to control the ledge thickness inside the metallurgical reactor. The control strategy is thoroughly tested for typical operating conditions that prevail inside an industrial facility.
2. FDM of the metallurgical reactor
The 1-D phase change problem under investigation is depicted in ). A time-varying ledge of thickness , which corresponds to the solidification front location, is built against the inner surface of a brick wall of thickness
. The outer surface of the brick wall, i.e. the left boundary condition, is cooled by forced convection heat transfer with an impinging air jet. The air temperature remains constant and equal to
. The time-varying heat transfer coefficient
is found using an empirical correlation that employs the non-dimensional Reynolds and Nusselt numbers of the flow Citation26. The heat transfer coefficient
may easily be controlled by varying the air mass flow rate of the impinging jet. For the present cooling system, the heat transfer coefficient ranges from 60 to 120 W m−2 K−1 Citation26. A time-varying heat flux
, which represents the heat load supplied to the reactor, is imposed on the right boundary condition at
. The heat load may be affected by different operating conditions: ore feeding, current shutdown and anode replacement Citation1,Citation6,Citation27. These operations can be thought as thermal disturbances to the smelting process. They can be correlated to the variation of the input heat flux
from energy balances Citation6.
The mathematical model for the phase change problem rests on the following assumptions:
| • | The FDM represents faithfully the thermal behaviour of a real high-temperature metallurgical reactor Citation1,Citation3,Citation4. | ||||
| • | The temperature gradients across the wall (x direction) are much larger than the ones in the vertical direction so that a 1-D analysis can be applied Citation1,Citation3,Citation4. | ||||
| • | As a result, a single portion of the metallurgical reactor is examined (at the metal/bath interface where the ledge thickness is minimal). | ||||
| • | The phase change problem is non-isothermal. It is characterized by a mushy zone between the solidus temperature | ||||
| • | The 1-D cooling of the reactor external wall by an impinging jet corresponds to forced convection heat transfer only. The cooling process is thermally decoupled from the phase change problem inside the reactor. Therefore, the ambient temperature | ||||
| • | The thermal contact resistance between the brick wall and the ledge is neglected. | ||||
| • | The thermal properties of the PCM are temperature independent; they may, however, be different for the liquid and the solid phases. | ||||
| • | The heat transfer across the liquid layer of the PCM is conduction dominated. The effect of the flow circulation in the liquid layer could, however, be accounted for in the diffusion model by means of an effective thermal conductivity. The reader is referred to references Citation1,Citation28 for further details on this matter. | ||||
With the foregoing assumptions, the governing heat diffusion equation for the wall and the PCM may be stated as:
(1)
The boundary conditions are given as follows:
(2)
(3)
and the initial condition is
(4)
The second term on the right-hand side of Equation (1) accounts for the solid/liquid phase change. Of course, this term vanishes inside the brick wall. The enthalpy change is defined as
. The liquid fraction
varies linearly between the solidus temperature
and the liquidus temperature
in the following manner:
(5)
Equations (1–5) were discretized using second-order finite differences in space and first-order differences in time with an implicit scheme. The resulting set of algebraic equations of the form is then solved using a tri-diagonal matrix algorithm. For each time step, the liquid fraction
in Equation (1) is determined according to the enthalpy method, an iterative procedure developed by Voller and Swaminathan Citation29. Thus, with the known heating
and cooling h(t) boundary conditions, the FDM provides the evolution of the temperature field
, the heat flux distribution
and the ledge thickness
.
The above FDM was thoroughly tested and validated using analytical solutions and results available in the open literature. Further details concerning the validation of the numerical model are reported in reference Citation23.
The physical properties of the brick wall and of the PCM for a typical high-temperature metallurgical reactor are provided in Citation3,Citation30. From these references, the thickness of the brick wall was fixed at = 0.1 m and the width of the PCM layer (solid, mushy and liquid) was set equal to
= 0.1 m (). The outside temperature was kept constant at
= 300 K. As for the time step
and the mesh size
, they were set to 100 s and 0.5 × 10⁻³ m respectively, which enables to obtain a good compromise between numerical accuracy and CPU time requirement. Moreover, the mesh size was chosen so as to yield the required resolution for the predicted ledge thickness and smoothen the thermal conductivity jump inside the control volumes that undergo phase change.
Table 1. Physical properties of the brick wall and of the PCM for a typical high-temperature metallurgical reactor 3,30.
3. State-space identification of the reactor
With the above mesh size, the resulting size of the matrix A is 400 × 400 which can become a problem due to the fact that it needs to be inversed for calculating the temperature vector T. This problem is accentuated for multidimensional problem (2-D, 3-D) which brings the question: is there a different way to model the thermal behaviour of the reactor with a simpler and faster model?
In the last decades, the popularity of model reduction techniques have increased significantly in various fields such as heat transfer, fluid mechanics, solid mechanics and process control. The main objective of these methods is to extract, from knowledge of the physical process (simulations or experimental data), a low-dimensional system (reduced model) that has nearly the same response characteristics as the process under study. The idea behind model reduction is the need, in many instances, for a simplified model that captures the main features of the original complex model. The simplified model, much more computationally efficient, may then be used in place of the original complex model, either for simulations or for control applications Citation31. A variety of different model reduction techniques exist, such as the modal identification method Citation32, the Litz methods Citation33, proper orthogonal decomposition Citation34, artificial neural networks Citation35 and state-space models Citation16,Citation21,Citation22. Since the inverse method used in this study is composed of a Kalman filter and a RLSE (Section 4), state-space models were a more convenient choice for building the reduced model.
The state-space identification consists in casting the predictions of the FDM, the exact values, into the following linear discrete state-space form:
(6)
(7)
Where
is the measurement vector. It contains the information extracted from the FDM, that is the heat flux measurement
and the ledge thickness
.
is the state vector. Due to the fact that canonical form of the state-space model is used, the state vector
is equal to the measurement vector
.
is the input vector which is equivalent to the boundary conditions (Equations (2) and (3)). Finally, the state-space matrices are defined by the symbols
,
and
, respectively, and
corresponds to the sampling instant.
Given the input vector and the corresponding measurement vector
, the objective of the state-space identification is to compute the matrices
,
and
that minimize the cost function
defined as:
(8)
where
is the difference between the measurement vector
(extracted from the FDM) and the predicted output of the state-space model
and
the total number of sampling instants. In order to compute the matrices
,
and
, the state-space identification algorithm relies on the iterative prediction-error minimization (PEM) method reported in reference Citation36.
To characterize the accuracy of the state-space identification, the relative root-mean-square error (RRMSE) is adopted:
(9)
where
corresponds to the measurement vector
and
is equal to the predicted output of the state-space model
.
The usefulness of the present state-space identification procedure is exemplified for the two following cases: (1) using a heat flux sensor located at the brick/ledge interface, i.e. and (2) using a heat flux sensor at the external surface of the brick wall, i.e.
. The input vector
corresponds to typical values for the heat load inside high-temperature reactors Citation37 and the heat transfer coefficient for forced convection in air Citation26 (). The corresponding predictions of the state-space models are compared in and where the identified state-space matrices are presented in . For the first case, it is seen that the agreement between the predictions of the state-space model and those of the FDM is excellent, i.e. the RRMSE values remain lower than 3% for the heat flux and ledge thickness predictions. As for the second case, even if the RRMSE takes somewhat larger values, especially for the heat flux prediction, the agreement between the predictions of the state-space model and those of the FDM remains reliable (RRMSE < 5%).
Figure 5. Input heat flux and heat transfer coefficient
, i.e. the input vector u, used for computing the FDM predictions and the state-space model outputs.
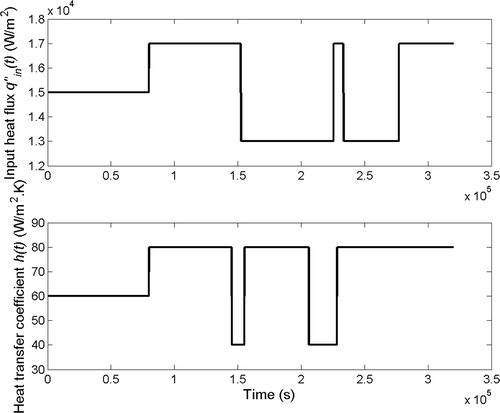
Figure 6. Predictions of the FDM versus that of the state-space models when using the heat flux sensor : (a) heat flux at the brick/ledge interface and (b) ledge thickness.
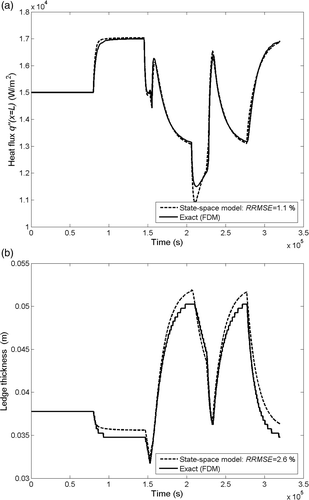
Figure 7. Predictions of the FDM versus that of the state-space models when using the heat flux sensor : (a) heat flux at the external surface of the brick wall and (b) ledge thickness.
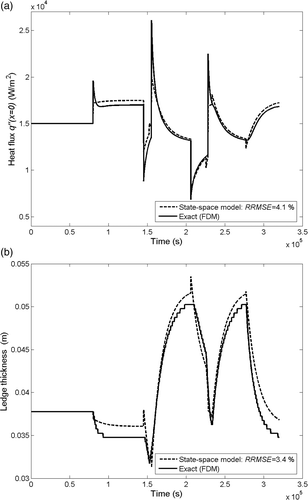
Table 2. Identified state-space matrices.
Table 3. Parameters for the inverse method 23.
4. Inverse method for estimating the ledge thickness
In the inverse problem, the heat flux on the right boundary is unknown (). It may be estimated however with an inverse method which employs a heat flux sensor embedded into the brick wall or placed on its outside surface. Once the heat flux
has been estimated based on these measurements
, the solidification front location, or ledge thickness,
, is determined from the state-space model of Section 3. A schematic of the overall inverse methodology based on the Kalman filter, RLSE and state-space model is provided in .
Figure 8. The inverse method; a Kalman filter coupled with a RLSE and a state-space model. It acts as a virtual sensor for estimating the ledge thickness.
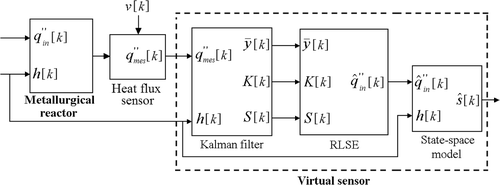
The inverse method is thus equivalent to a virtual sensor Citation9 allowing on-line measurements of heat fluxes . The virtual sensor relies on an estimation algorithm (Kalman filter, RLSE, state-space model) so as to provide on-line estimates of the non-measurable ledge thickness
.
In spite of the fact that various estimation methods are available for implementing computationally efficient inverse calculations, such as the function specification method Citation38,Citation39, the filter coefficient method Citation38,40], the Kalman filters with augmented state Citation21,Citation22, the Kalman filters with RLSE Citation41,Citation42, the partial least-square regression methods Citation43,Citation44 or the adaptive iterative filters Citation45,Citation46, this study will focus on the procedure already reported in reference Citation23: a Kalman filter coupled with a RLSE and a state-space model (). The main features of the proposed linear method are as follows: (1) the algorithm is simple; (2) it handles complex inverse phase change processes; (3) it does not rely on a statistical database; and (4) the inverse methodology can be carried out indiscriminately with temperature and/or heat flux sensors. The proposed inverse method may be divided into four steps.
The first step is concerned with the thermal behaviour of the reactor. Bear in mind that it is assumed that the FDM represents faithfully the thermal behaviour of a real high- temperature metallurgical reactor Citation1,Citation3,Citation4. While the industrial process is running, the PCM inside the reactor may undergo melting/solidification cycles due to the time-varying heating and cooling conditions, i.e. and
. This will in turn generate data for the heat flux sensor
located inside or outside the brick wall. These data contain noise
which is considered as a zero mean Gaussian white noise with covariance
defined as the covariance matrix of the measurement noise (Equation (10)).
(10)
The second step consists in using a Kalman filter which is a set of mathematical equations that provide an efficient recursive mean to estimate the state of a process (the phase change process) Citation47. The Kalman filter estimates a process using a form of feedback control: the filter estimates the process state at some time and then obtains feedback in the form of noisy measurement. Referring to , the Kalman filter estimates the process state of the reactor with the sensor measurement . It also uses simultaneously only one of the input signals, i.e. the heat transfer coefficient
. In order to estimate correctly the process state, the Kalman filter proceeds through two steps: (1) the time update step (prediction) followed by (2) the measurement update step (correction) Citation48.
The time update equations project the current state estimate and the error covariance matrix estimate
forward in time in order to obtain the a priori estimate for the next time step, i.e.
and
(Equations (11) and (12)).
(11)
(12)
The covariance matrices and
characterize the accuracy of the computed state estimate
and
, respectively.
is the covariance matrix of the process noise
which accounts for the disturbances to the metallurgical reactor dynamics. The process noise
is assumed once again to be zero mean Gaussian white noise with covariance
defined as the covariance matrix of the process noise (Equation 13).
(13)
The feedback is then performed by the measurement update equations that incorporate a new measurement into the a priori estimates
and
in order to obtain an improved a posteriori estimate
and
(Equations (14) and (15)). Due to the fact that only the measurement of heat flux
is available in the measurement vector
(Equation (7)), the matrix
will be used with the current algorithm.
(14)
(15)
where
is the identity matrix and
the optimal Kalman gain (Equation (16)) that minimizes the a posteriori error covariance
.
(16)
One important result of this process, , corresponds to the measurement residual which reflects the discrepancy between the predicted measurement
and the actual measurement
. Finally,
stands for the residual covariance which is the covariance matrix of the measurement residual
.
In the third step of the inverse method, the RLSE is applied to the present heat transfer problem. The RLSE is a well-known recursive technique used in the field of adaptive signal processing. The reader is referred to reference Citation49 for a full discussion on this technique. The RLSE estimates the unknown heat flux using the information generated from the Kalman filter, that is the measurement residual
, the optimal Kalman gain
and the residual covariance
. The full RLSE algorithm applied to heat transfer is reported in references Citation41,Citation42. The overall results can be stated in terms of the following set of five equations:
(17)
(18)
(19)
(20)
(21)
where
corresponds to the estimated heat flux,
the covariance error of the estimated heat flux,
a correction gain and
and
the sensitivity matrices. The magnitude of the forgetting factor
ranges from 0 to 1. It is employed to prevent
to shrink to zero, thereby maintaining the RLSE updating ability when the time-varying heat fluxes need to be estimated. This is a consequence of the RLSE algorithm where older data are gradually discarded in favour of more recent measurements. As reported in reference Citation49, measurements older than
samples are forgotten. The magnitude of
is usually chosen so as to ensure good tracking ability without the loss of accuracy.
In the fourth and last step of the inverse method, the solidification front location is calculated with the state-space model of Section 3 (Equations (6) and (7)) and with the estimated heat flux given by the RLSE, that is,
(22)
(23)
where
is a new input vector and
the estimated ledge thickness.
The above inverse heat transfer procedure was thoroughly tested for estimating the time-varying input heat flux on the right boundary and therefore for predicting the time-varying thickness of the ledge inside a reactor. For this reason, numerical simulations were carried out using once again typical operating conditions that prevail in such facilities () Citation26,Citation37. Moreover, the main parameters for the Kalman filter and of the RLSE are provided in . The selection of these parameters is documented in reference Citation23.
Table 4. Proportional gain  and integral time constant values.
One can note that forgetting factor is also larger when the heat flux sensor
is employed. The purpose of the forgetting factor is to reach a compromise between stability and accuracy of the inverse prediction. Due to the fact that the heat flux sensor
is farther away from the ledge compared to
, the damping and lagging effect caused by heat conduction diffusive nature are more significant in that case Citation38. Therefore, the inverse solution is more sensible to the measurement noise, and in order to achieve the desired compromise on stability and accuracy, the value of the forgetting factor
needs to be increased.
The corresponding time-varying exact (FDM) and estimated (inverse method) ledge thicknesses are compared in and . In the first case, a heat flux sensor at the brick/wall interface is used with the inverse method, i.e. , and in the second case, the inverse method employs a heat flux sensor at the external surface of the brick wall, i.e.
. To characterize the accuracy of the inverse method, the RRMSE (Equation 9) is used once again;
corresponds to the exact ledge thickness
and
the estimated ledge thickness
.
Figure 9. Predicted (inverse method) and exact (FDM) ledge thickness using a heat flux sensor at the brick/ledge interface, i.e. .
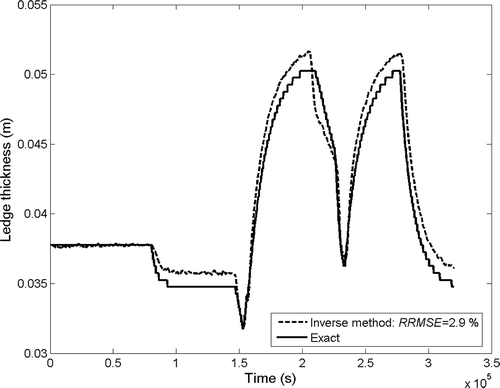
Figure 10. Predicted (inverse method) and exact (FDM) ledge thickness using a heat flux sensor at the external surface of the brick wall, i.e. .
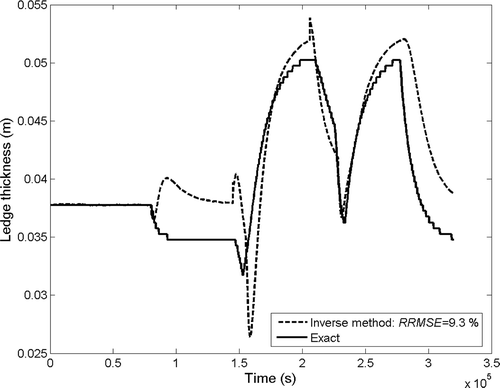
shows that the discrepancy between the exact and the estimated ledge thicknesses remains smaller than 3% and gives a maximum error of 4 × 10⁻³ m. The main drawback is that the heat flux sensor needs to be embedded into the brick wall, and thus its installation will be more cumbersome. However, even if it is simpler to install a heat flux sensor at the external surface of the brick wall, by looking at , one can note that the inverse method is less accurate; the RRMSE value is three times larger (9.3%) and the maximum error is now 10 × 10−3 m. also shows that the time lag between the exact (FDM) and estimated (inverse) is higher using this heat flux sensor. This can be explained by the fact that the magnitude of the forgetting factor is increased in order to maintain the stability of the inverse solution.
5. Control of the ledge thickness using the virtual sensor
As presented earlier, no ledge thickness sensor is available for high-temperature metallurgical reactors because of the hostile conditions that prevail inside the reactor, and the use of the standard manual method for measuring the ledge thickness is not conceivable for control application because the measurement frequency is too low. Therefore, in order to control the ledge thickness inside metallurgical reactors, the virtual sensor described in Section 4 is merged to the following control strategy (). As before, it is assumed that the thermal behaviour of the reactor may be described by the FDM of Section 2 Citation1,Citation3,Citation4.
Figure 11. Control of the ledge thickness in metallurgical reactors using a virtual sensor.
From the heat flux measurements contaminated with noise
, the virtual sensor estimates the ledge thickness
. Using this prediction, the tracking error
, defined as the difference between the set point
(desired ledge thickness) and the actual ledge thickness
, can be computed. Its value is then fed to the controller which adjusts the cooling (the heat transfer coefficient
) of the reactor wall in order to minimize the tracking error
when subjected to unknown external disturbances
.
The control strategy used in this study rests on a standard PI controller. Incidentally, more than 90% of the controllers employed in the process industry are PI–PID controllers Citation50,Citation51. It is noted that more complex control strategies such as the internal model control Citation52, the model predictive control Citation53, the artificial neural networks Citation54 and the optimal control Citation55 are available for controlling different thermal processes. But the simplicity and the availability of PI controllers as well as their easiness of implementation make them a more attractive choice. Moreover, electrolysis cells are usually cooled by natural convection Citation56, that is without any controlled forced convection cooling devices and the implementation of a simple PI is considered to be a bold new application for the smelting industry.
The implementation of the control strategy is done in discrete time where a sampling time dt = 100 s is employed. The choice of this sampling time is a compromise between stability and accuracy Citation57. For a PI controller, the control action, defined as the cooling () of the reactor wall, is computed in the following manner (Equation (24)) Citation25.
(24)
where
is the proportional gain and
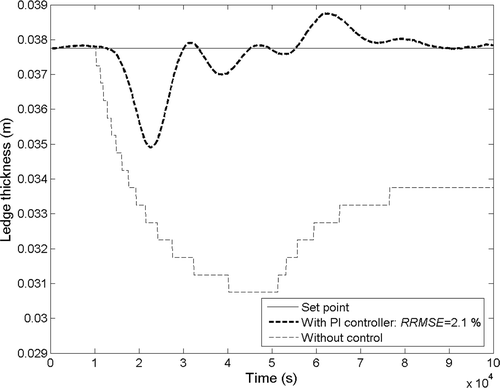
the integral time constant. Based on common guidelines typically used to manually tune a PI–PID controller for open-loop stable systems Citation58, the proportional gain Kp and the integral time constant Ti were determined in order to obtain a maximum tracking error of 3 × 10⁻³ m, a null steady-state tracking error and no overshoots (). These specifications are required in order to minimize the ledge thickness variation, thus ensuring a continuous protective barrier against the corrosive molten material Citation4–6.
The control scenario of the metallurgical reactor is the following. The initial operating conditions, i.e. the input heat flux and the heat transfer coefficient
, are set at constant values of 15,000 W m−2 and 60 W m−2 K−1, respectively Citation26,Citation37. These values imply an initial ledge thickness
of 3.78 × 10⁻² m. At time t = 1 × 10⁴ s, the ledge is suddenly upset with an input heat flux of 17,000 W m−2 until time t = 3 × 10⁴ s where it lowers to 16,000 W m−2 up to the end of the simulation. The sudden change in the heat load by the square wave signal can be related to different operating conditions that act as thermal disturbances of the smelting process Citation1,Citation6,Citation27. Finally, the ledge thickness set point
is kept at its initial value of 3.78 × 10⁻² m.
The control of the ledge thickness by combining a PI controller with a virtual sensor is depicted in and . Once again, the comparison of using a heat flux sensor at the brick/ledge interface and at the external surface of the brick wall is done. In the first case, it is shown that the controller provides a maximum tracking error of only 2.8 × 10⁻³ m compared to 8 × 10⁻³ m for the case without control. Moreover, no overshoots are present and a null steady-state tracking error is ensured. The corresponding RRMSE value is equal to 1.6% where corresponds to the ledge thickness set point
and
the estimated ledge thickness
(Equation (9)).
Figure 12. Control of the ledge thickness by combining a PI controller with a virtual sensor using a heat flux sensor at the brick/ledge interface .
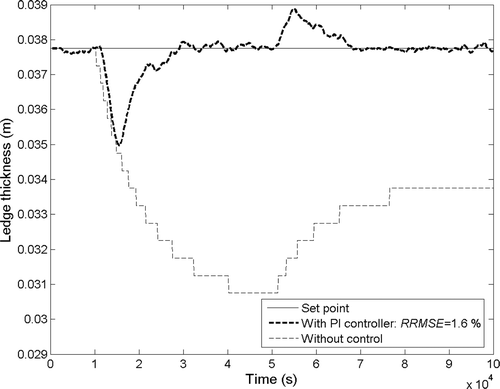
Figure 13. Control of the ledge thickness by combining a PI controller with a virtual sensor using a heat flux sensor at the external surface of the brick wall .
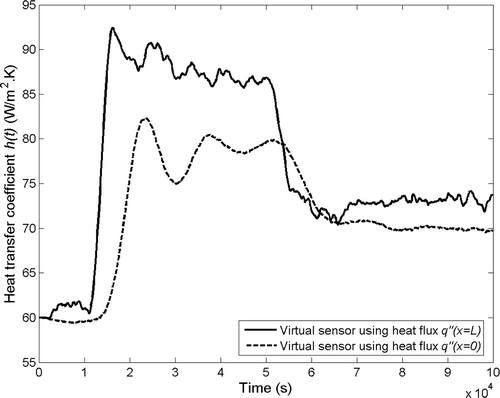
In the second case, the tracking error is equivalent with a value of 2.85 × 10⁻³ m. However, one can note the significant difference in the time lag which is caused by the larger forgetting factor (). As stated earlier, because the heat flux measurements are farther away from the ledge, the accuracy of the inverse solution needs to be decreased (larger time lag) in order to stabilize it (less oscillation). also shows that the controller response is less aggressive than that in the previous case, that is the set point is attained less rapidly and with a more oscillatory response. This can also be observed in in which the controller output signal, i.e. the heat transfer coefficient h, is depicted. This behaviour can be explained by looking at the proportional gain Kp and integral time constant Ti values from . These PI settings were chosen in order to ensure the stability of the control loop even if the virtual sensor using this heat flux sensor provides a larger time lag Citation59.
Figure 14. The PI controller output signal, i.e. the heat transfer coefficient h, when the virtual sensor uses heat flux (a) and (b)
.
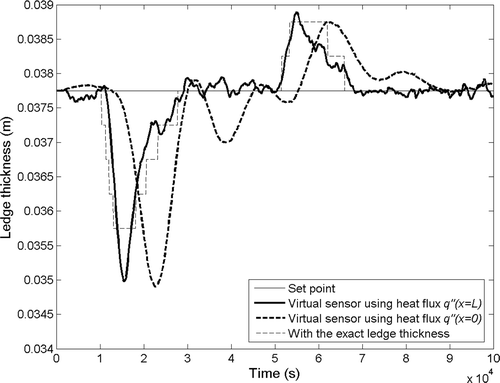
Finally, the control response of the two cases presented above are compared with a PI controller (Kp = 20,000, Ti = 10,000 s) that employs the exact ledge thickness, which is the ledge thickness provided by the FDM of Section 2 (). This is shown for comparison purposes only. shows once again the time lag difference between the two virtual sensors. One can note also that using the exact ledge thickness provided by the FDM, the results are equivalent to the case employing the virtual sensor with heat flux sensor . However, in the latter case, the measurements are non-intrusive, i.e. they are not taken inside the metallurgical reactor.
Figure 15. Control of the ledge thickness using a PI controller combined to a virtual sensor with heat flux (a) , (b)
and (c) the exact ledge thickness provided by the FDM.
6. Concluding remarks
A non-intrusive inverse heat transfer procedure for predicting the time-varying thickness of the phase change ledge on the inside surface of the walls of high-temperature metallurgical reactors was presented. A Kalman filter, based on a state-space representation of the reactor, was coupled with a RLSE in order to estimate on-line the position of the phase front. The data were collected by a heat flux sensor embedded into the reactor wall or placed on the outside surface of the wall. The inverse method, used here as a virtual sensor, was then combined to a traditional PI controller in order to control the ledge thickness, by regulating the air cooling applied on the outside surface of the reactor wall. The virtual sensor and the control strategy were thoroughly tested for typical phase change conditions that prevail inside industrial facilities. Results have shown that using a virtual sensor that employs a heat flux sensor inside the reactor wall provided more accuracy and stability in the inverse calculation and in the control application, but at the cost of a more complicated installation. In that case, it was shown that the discrepancy between the exact and the estimated ledge thicknesses remained smaller than 3% at all times, and that the control strategy ensured a null steady-state tracking error, a maximum tracking error less than 10%, no overshoot and no significant time lag.
Acknowledgements
The authors are very grateful to the Fonds québécois de la recherche sur la nature et les technologies (FQRNT), to the Centre québécois de recherche et de développement de l’aluminium (CQRDA) and to the Natural Sciences and Engineering Council of Canada (NSERC) for their financial support.
References
- Tadrari, O, and Lacroix, M, 2006. Prediction of protective banks in high temperature smelting furnaces by inverse heat transfer, Int. J. Heat Mass Transfer 49 (13–14) (2006), pp. 2180–2189.
- Groth, RJ, and Zhao, Y, , Determining protective layer thickness of blast furnaces, US Patent No. 5961214, 1995.
- Wei, CC, Chen, JJJ, Welch, BJ, and Voller, VR, 1997. Modelling of dynamic ledge heat transfer. Proceedings of the Minerals. Orlando, FL: Metals & Materials Society (TMS), TMS; 1997. pp. 309–316.
- Taylor, MP, Welch, BJ, and O'sullivan, MJ, 1983. Sidewall ledge dynamics in cells used for electrowinning aluminium. Proceedings of the Eleventh Australian Conference on Chemical Engineering, Brisbane, QLD, 4–7 September, Institution of Chemical Engineers. Sydney: NSW; 1983. pp. 493–500.
- Peacey, JG, and Medlin, GW, 1979. Cell sidewall studies at Noranda aluminium. Metals & Materials Society (TMS), Milwaukee, WI, 16–20 September, TMS, Warrendale, PA: Proceedings of the Minerals; 1979. pp. 475–491.
- Grjotheim, K, and Kvande, H, 1993. Introduction to Aluminium Electrolysis. Dusseldorf: Aluminium-Verlag GmbH; 1993. pp. 147–160.
- Torklep, K, and Nordbo, T, 1994. Some applications of the Elkem position probe. Proceedings of the Minerals. San Francisco, CA, Warrendale, PA: Metals & Materials Society (TMS); 1994. pp. 449–456.
- Bonnardel, O, and Homsi, P, 1999. Pechiney semi-continuous & automatic measurement device (CMD), a new tool for automatic measurements. Proceedings of the Minerals. San Diego, CA, Warrendale, PA: Metals & Materials Society (TMS); 1999. pp. 303–309.
- Gonzaga, JCB, Meleiro, LAC, Kiang, C, and Maciel Filho, R, 2009. ANN-based soft-sensor for real-time process monitoring and control of an industrial polymerization process, Comput. Chem. Eng. 33 (1) (2009), pp. 43–49.
- Chen, CK, and Su, CR, 2008. Inverse estimation for temperatures of outer surface and geometry of inner surface of furnace with two layer walls, Energy Convers. Manage. 49 (2) (2008), pp. 301–310.
- Lan, CH, Cheng, CH, and Wu, CY, 2001. Shape design for heat conduction problems using curvilinear grid generation, conjugate gradient, and redistribution methods, Numer. Heat Transfer, Part A 39 (5) (2001), pp. 487–510.
- Huang, CH, and Chao, BH, 1997. An inverse geometry problem in identifying irregular boundary configurations, Int. J. Heat Mass Transfer 40 (9) (1997), pp. 2045–2053.
- Su, CR, and Chen, CK, 2007. Geometry estimation of the furnace inner wall by an inverse approach, Int. J. Heat Mass Transfer 50 (19–20) (2007), pp. 3767–3773.
- Marois, M-A, Désilets, M, and Lacroix, M, 2011. Prediction of a 2D solidification front in high temperature furnaces by an inverse analysis, Numer. Heat Transfer, Part A 59 (3) (2011), pp. 151–166.
- Beck, JV, Blackwell, B, and Haji-Sheikh, A, 1996. Comparison of some inverse heat conduction methods using experimental data, Int. J. Heat Mass Transfer 39 (17) (1996), pp. 3649–3657.
- Jang, HY, Tuan, PC, Chen, TC, and Chen, TS, 2006. Input estimation method combined with the finite-element scheme to solve IHCP hollow-cylinder inverse heat conduction problems, Numer. Heat Transfer, Part A 50 (2006), pp. 263–280.
- Torrkulla, J, and Saxén, H, 2000. Model of the state of the blast furnace hearth, ISIJ Int. 40 (5) (2000), pp. 438–447.
- Gonzalez, M, and Goldschmit, MB, 2006. Inverse geometry heat transfer problem based on a radial basis functions geometry representation, Int. J. Numer. Methods Eng. 65 (2006), pp. 1243–1268.
- Brännbacka, J, and Saxén, H, 2008. Model for fast computation of blast furnace hearth erosion and buildup profiles, Ind. Eng. Chem. Res. 47 (20) (2008), pp. 7793–7801.
- Baker, DP, Dulikravich, GS, Dennis, BH, and Martin, TJ, 2010. Inverse determination of eroded smelter wall thickness variation using an elastic membrane concept, ASME J. Heat Transfer 132 (5) (2010), pp. 052101–1–052101-8.
- Scarpa, F, and Milano, G, 1995. Kalman smoothing technique applied to the inverse heat conduction problem, Numer. Heat Transfer, Part B 28 (1) (1995), pp. 79–96.
- Daouas, N, and Radhouani, MS, 2004. A new approach of the Kalman filter using future temperature measurements for nonlinear inverse heat conduction problems, Numer. Heat Transfer, Part B 45 (6) (2004), pp. 565–585.
- LeBreux, M, Désilets, M, and Lacroix, M, 2010. Fast inverse prediction of phase change banks in high temperature furnaces with a Kalman filter coupled with a recursive least-square estimator, Int. J. Heat Mass Transfer 53 (23–24) (2010), pp. 5250–5260.
- Samaï, M, and Loulou, T, 2009. A comparative study of heat flux and temperature based objective functional to solve inverse heat conduction problems, Numer. Heat Transfer, Part B 56 (1) (2009), pp. 75–104.
- De Larminat, P, 1993. Automatique: Commande des Systèmes Linéaires. Paris: Hermès; 1993. pp. 49–58.
- Incropera, FP, and DeWitt, DP, 2002. Fundamentals of Heat and Mass Transfer. New York, NY: John Wiley & Sons; 2002. pp. 428–434.
- Tabsh, I, Dupuis, M, and Gomes, A, 1996. Process simulation of aluminium reduction cells. Proceedings of the Minerals.. Anaheim, CA, Warrendale, PA: Metals & Materials Society (TMS); 1996. pp. 451–457.
- Vidalain, G, Gosselin, L, and Lacroix, M, 2009. An enhanced thermal conduction model for the prediction of convection dominated solid–liquid phase change, Int. J. Heat Mass Transfer 52 (7–8) (2009), pp. 1753–1760.
- Voller, VR, and Swaminathan, CR, 1991. General source-based method for solidification phase change, Numer. Heat Transfer, Part B 19 (1991), pp. 175–189.
- Taylor, MP, , The influence of process dynamics on the heat balance and cell operation in the electrowinning of aluminium, Ph.D thesis, University of Auckland, 1984.
- Balima, O, Favennec, Y, and Petit, D, 2007. Model reduction for heat conduction with radiative boundary conditions using the modal identification method, Numer. Heat Transfer, Part B 52 (2007), pp. 107–130.
- Petit, D, Hachette, R, and Veyret, D, 1997. A modal identification method to reduce a high order model: application to heat conduction modelling, Int. J. Model. Simul. 17 (1997), pp. 242–250.
- Litz, L, 1981. Order reduction of linear state space models via optimal approximation of the nondominant modes, Large Scale Syst. 12 (1981), pp. 171–184.
- Glavaski, S, Marsden, JE, and Murray, RM, 1998. Model reduction, centering, and the Karhunen-Loeve expansion. Proceedings of the 37th IEEE Decision and Control Conference. Tampa Bay, FL, Piscataway, NJ: IEEE; 1998. pp. 2071–2076.
- Krejsa, J, Woodbury, KA, Ratliff, JD, and Raudensky, M, 1999. Assesment of strategies and potential for neural networks in the inverse heat conduction problem, Inverse Prob. Eng. 7 (3) (1999), pp. 197–213.
- Ljung, L, 1999. System Identification: Theory for the Users. Upper Saddle River, NJ: Prentice Hall; 1999. pp. 197–234.
- Bruggemann, JN, 1998. Pot heat balance fundamentals. Queenstown, New Zealand: Proceedings of the Sixth Australasian Aluminium Smelter Technology Conference and Workshops; 1998. pp. 167–189.
- Beck, JV, Blackwell, B, and St Clair, CR, 1985. Inverse Heat Conduction: Ill-Posed Problems. New York: Wiley-Interscience; 1985.
- Beck, JV, 1970. Nonlinear estimation applied to the nonlinear inverse heat conduction problem, Int. J. Heat Mass Transfer 13 (4) (1970), pp. 703–716.
- Beck, JV, 2008. Filter solutions for the nonlinear inverse heat conduction problem, Inverse Prob. Sci. Eng. 16 (1) (2008), pp. 3–20.
- Tuan, PC, Ji, CC, Fong, LW, and Huang, WT, 1996. An input estimation approach to on-line two-dimensional inverse heat conduction problems, Numer. Heat Transfer, Part B 29 (3) (1996), pp. 345–363.
- Chen, TC, and Hsu, SJ, 2007. Input estimation method in the use of electronic device temperature prediction and heat flux inverse estimation, Numer. Heat Transfer, Part A 52 (9) (2007), pp. 795–815.
- Facco, P, Doplicher, F, Bezzo, F, and Barolo, M, 2009. Moving average PLS soft sensor for online product quality estimation in an industrial batch polymerization process, J. Process Control 19 (3) (2009), pp. 520–529.
- Sharmin, R, Sundararaj, U, Shah, S, Vande Griend, L, and Sun, YJ, 2006. Inferential sensors for estimation of polymer quality parameters: industrial application of a PLS-based soft sensor for a LDPE plant, Chem. Eng. Sci. 61 (19) (2006), pp. 6372–6384.
- Matsevity, YM, Moultanovsky, AV, and Timchenko, V, 1992. Modelling of thermal processes and identification of local heat transfer parameters with the help of an adaptive iterative filter, High Temp. 30 (1) (1992), pp. 71–78.
- Matsevity, YM, Moultanovsky, AV, and Timchenko, V, 1992. Modelling of thermal processes and identification of local heat transfer parameters with the help of an adaptive iterative filter, High Temp. 30 (1) (1992), pp. 71–78.
- Kalman, RE, 1960. A new approach to linear filtering and prediction problems, ASME J. Basic Eng. 82 (1960), pp. 35–45.
- Welch, G, and Bishops, G, 2006. An introduction to the Kalman filter. TR 95-041. Department of Computer Science, University of North Carolina; 2006. pp. 1–16.
- Haykin, S, 1995. Adaptive Filter Theory. Englewood Cliffs, NJ: Prentice Hall; 1995. pp. 562–587.
- Aström, KJ, and Hägglund, T, 1995. PID Controllers: Theory, Design and Tuning. Research Triangle Park, NC: Instrument Society of America; 1995. pp. 59–197.
- Takatsu, H, Itoh, T, and Araki, M, 1998. Future needs for the control theory in industries report and topics of the control technology survey in Japanese industry, J. Process Control 8 (5–6) (1998), pp. 369–374.
- Morari, M, and Zafiriou, E, 1989. Robust Process Control. Englewood Cliffs, NJ: Prentice Hall; 1989.
- Camacho, EF, and Bordons, C, 1995. Model Predictive Control in the Process Industry. Berlin: Springer; 1995.
- Haykin, S, 1994. Neural Networks: A Comprehensive Foundation. New York: Macmillan College; 1994.
- Zhou, K, Doyle, JC, and Glover, K, 1996. Robust and Optimal Control. Upper Saddle River, NJ: Prentice Hall; 1996.
- Liu, X, Beeler, R, Hornack, T, Burg, J, and Czekaj, S, , Electrolysis cells for the production of metals from melts comprising sidewall temperature control systems, WO Patent No. 014042, 2008.
- LeBreux, M, Désilets, M, and Lacroix, M, 2011. Inverse prediction and control of the bank thickness in high temperature metallurgical reactors. Proceedings of the Sensors. San Diego, CA, Warrendale, PA: Sampling, and Simulation for Process Control - Held During the TMS 2011 Annual Meeting and Exhibition, TMS; 2011. pp. 95–102.
- Zhong, QC, 2006. Robust Control of Time-Delay Systems. London: Springer-Verlag; 2006. pp. 17–22.
- Normey-Rico, JE, and Camacho, EF, 2007. Control of Dead-time Processes. London: Springer-Verlag; 2007. pp. 45–48.