Abstract
An outline of a Structure Health Monitoring (SHM) system is given. A non-destructive technique of elastic wave propagation was used in the presented approach. For the analysis of time signals recorded by piezoelectric transducers, signal processing algorithm has been developed and artificial neural networks have been used. As a consequence, two levels of the damage identification problem have been realized: novelty detection and damage assessment. The systems accuracy and reliability have been verified during laboratory tests of strip specimens made of various materials. It has been proved that the system can be used for the analysis of simple as well as complex signals. Moreover, the system can operate online as an automatic SHM system.
Introduction
Structural integrity assessment, early fault detection and prediction of structures performance are now possible through the development of Structural Health Monitoring (SHM) systems. Reliability of structures depends primarily on the sensitivity and accuracy of the diagnostic system used, however, an important feature of the developed SHM systems is their ability to perform automatic analysis of signals, significantly reducing the human factor. For this reason, in this paper, SHM system has been proposed, whose tasks are early fault detection and classification of the current state of the structure.
In discussions on non-destructive tests in recent years, much attention has been paid to atechnique that uses the phenomenon of elastic wave propagation. This is because the elastic waves are sensitive to different types of discontinuities they can propagate over long distances (even through inaccessible places) waves can be induced within different frequency ranges and generation and receiving of elastic waves are possible thanks to technology of piezoelectric transducers [Citation1], laser vibrometers [Citation2, Citation3], etc. Therefore, to design an SHM system (based on the propagation of elastic waves signals) and to test its reliability, a set of laboratory experiments were carried out. With respect to previously published results of experiments (conducted on an aluminium band) [Citation4, Citation5], the recorded signals appear much more complex since their explicit visual, quantitative and qualitative assessment is not possible in this case.
Due to the complexity of the analysed signals and large amount of data, the possibility of using soft computing methods [Citation6] have been studied. In conjunction with the approach presented in the previously published papers [Citation4, Citation7] the proposed SHM system consists of two stages: (1) detection of novelties/damage and (2) prediction of damage parameters (e.g. type, location, extent). At the first level, two approaches were analysed in this paper: the use of Auto-associative Neural Networks (ANNs) [Citation6] and Support Vector Machines (SVM). In both these cases, the classical approach was compared with an identical task using neural networks organized in the form of a Binary Decision Tree (BDT) [Citation8]. At the second level, standard Neural Network (NN) can be applied to the prediction task [Citation6]. This allows estimation of damage parameters with fairly good precision. In the case studied, it was the width and height of a cut simulating the occurrence of damage. In this manner, NNs can solve the inverse problem defined here as well as perform automatic analysis of the elastic waves and accelerate the process of structures diagnosis. Both the results of damage identification and implementation details of soft computing methods for the proposed SHM system are discussed in the paper.
Problem formulation
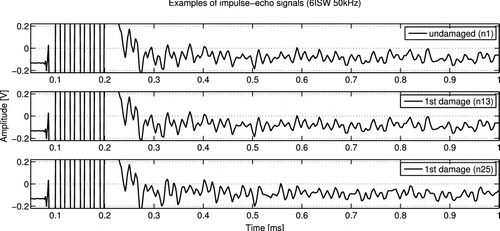
Let us consider a steel strip (808x32x2 mm) where in selected cross-sectionals damages were introduced by notching the specimen across the width for 20 mm from the outer edge to the opposite one. Two piezoelectric transducers served as actuators and sensors of elastic waves. The time signals measured at the actuator position for selected extents of damage are shown in Figure . Unfortunately, the disturbances introduced by damage are visually undetectable, so all three graphs in Figure appear identical. In addition, the majority of the procedures described in the literature refer to the analysis of much simpler signals [Citation2, Citation3].
Fig. 1 Selected time signals recorded in the investigated steel strip (6 impulse sine wave 50 kHz).
As the measured signals appeared quite complex, advanced signal processing techniques were used for data cleansing and computing parameters for further analysis. At this stage, wavelet denoising, data filtering, Fourier transformation and Principal Component Analysis (PCA) were studied. Next, the damage database was defined and it was used for training the designed diagnosis system to detect damage and evaluate its extent. It is worth mentioning that a huge computational effort was made to improve the training procedure with particular attention paid to various definitions of the input vectors, tuning the architecture of the NNs, parameter adjustment and repetitions of the learning algorithm, etc. The main objective was to decrease damage identification error and improve the generalization ability of the system.
Application of soft computing methods to damage identification
Novelty detection and pattern recognition
Damage identification can be found as a hierarchical structure of increasingly precise stages, viz. damage detection, its localization, assessment, etc. [Citation9]. The first stage uses methods that provide qualitative indication that damage may be present in the structure. It can be accomplished without prior knowledge of how the system behaves when damaged. These methods are referred to as novelty detection [Citation9, Citation10]. For the purpose of solving this task, the application of ANNs was discussed in this paper. Next-stage methods provide information about the probable position of the damage and estimate its type or extent. Here, the idea of pattern recognition may be used, although it typically requires large amounts of data whose acquisition requires a huge effort in both computational and experimental investigation. However, in the approach described here, SVM classifiers and standard NNs were trained to recognize the patterns obtained from a slightly damaged laboratory specimen.
Two-level SHM algorithm
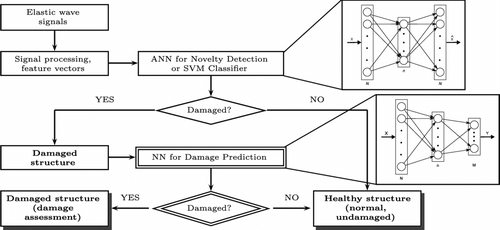
To combine these tasks into an integrated diagnosis system, a two-level SHM algorithm was designed which signals the presence of damage and can predict its extent (damage height and width). A simple scheme of the system functioning is shown in Figure . First, with respect to elastic wave signals measured at each control point, signal processing techniques have to be applied. At this stage, environmental and measurement noise is removed and signal parameters suitable for damage identification are computed (e.g. amplitudes, spectral density and correlation factor). Alternatively, in this paper, a statistical algorithm that utilizes PCA [Citation11] was used in order to reduce signals dimension. Then, the first identification level is performed by the NN trained for novelty detection. When the signal comes from an undamaged structure nothing will happen. When the signal differs from normal condition, the system will indicate the presence of damage. Then, the second identification level can be conducted using the NN trained for damage prediction. The resulting output vector will evaluate the extent of the damage or will declare a false alarm.
Fig. 2 Scheme of two-level SHM system designed to detect and to assess the damage.
The proposed approach of structure tests was studied for several laboratory models made of various materials [Citation4, Citation12]. In general, these tests may be divided into two categories, where reflections from existing obstacles (e.g. damage areas, model limits) are well separable, and those which are quite complex or even non-separable. Analysis of the first group of signals is normally quite transparent, while in case of short models, equipment limitations, low frequency excitations, noise existence and environmental conditions, it becomes a very hard problem. Nevertheless, the applied algorithm was able to detect even incipient damages and predict their size for all studied specimens.
Dimensionality reduction
Since the elastic waves signals measured in time domain are composed of thousands of samples, both a feature extraction and dimensionality reduction become a very important issue. From the point of view of NNs training, it is a crucial point to define feature vectors suitable for robust SHM system.
The goal of PCA applied was to reduce the dimensionality of an input space that consists of signals measured in time domain. PCA allows computation of linear transformation(1) that maps data from a high dimensional space
to a lower dimensional space
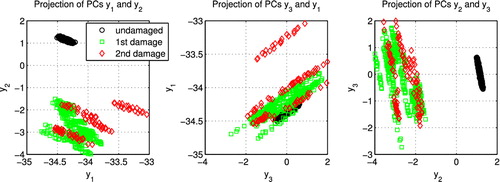
of principal components, without much loss of information. Examples of projections of the input data in two-dimensional space of the first three principal components are shown in Figure . It can be noticed that on the first and third plots, the patterns related to undamaged structure conditions are well separated among other damage scenarios.
In general, once eigenvectors are found from the covariance matrix W, the next step is to order them by eigenvalue, highest to lowest. This gives the components in order of significance and we can decide to ignore the components of lesser significance. Accumulative sum of generalized eigenvalues shown in Figure provides information about the amount of energy contained in vectors of first principal components.
Fig. 3 Projection of dataset to the first three principal components ,
and
.
Once we have chosen the components (eigenvectors) that we wish to keep in our data and formed a feature vector, we may simply reconstruct the data-set using the following formula:(2) where the covariance matrix
and
. Obviously, in order to preserve as much information as possible, the reconstruction error
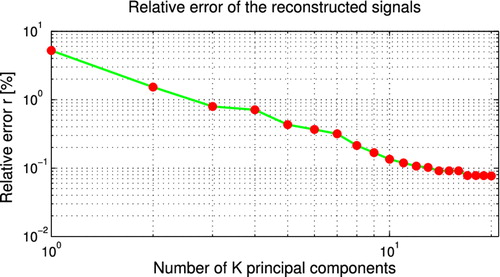
should be minimized. It can be found, for example, in Figure that the relative error of the signals reconstructed is less than
when the number
of principal components starts from 5. In this way, elastic waves signals could be compressed in this approach from the length of 2501 sample points to only several principal components. Selection of the number of principal components required for a proper NN training is a subject of investigations discussed in one of the next parts of the paper.
Fig. 4 Cumulative sum of principal components.
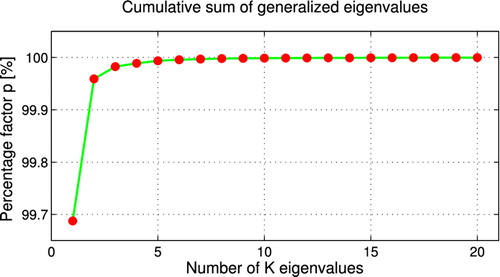
Fig. 5 Relative error of the reconstructed signal based on the number of first K principal components.
Damage detection and prediction
Beyond the sensor level and signal processing, the next two stages of SHM system involve identification of structure state and prediction of damage parameters. Soft computing methods and computed signal parameters (feature vectors) were used to solve this problem.
First, ANNs were studied for the purpose of novelty detection. In case such trained ANN is fed with the inputs obtained from a damage state of the system, the novelty index(3) which is defined as the Euclidean distance between the target input vectors
and the output vectors
of the NN, will increase [Citation10]. If the learning was successful, the index will be
for data obtained from the undamaged state. However, if data are obtained from the damaged system, the novelty index will indicate an abnormal condition providing a value strongly different from zero. In this task the ANNs were trained with the input vectors
and the output vector
defined as follows:
(4) where
are the principal components computed from the measured signal. It is worth mentioning that learning is carried out in this case only on the basis of patterns of aspecific class, for example, with the condition without damage (however, this class may also include cases of disturbances related to the changing environmental conditions).
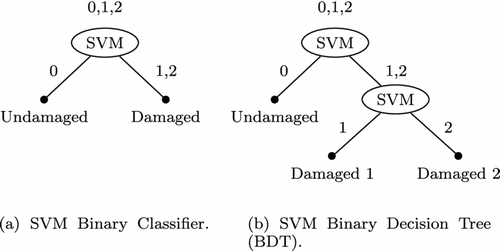
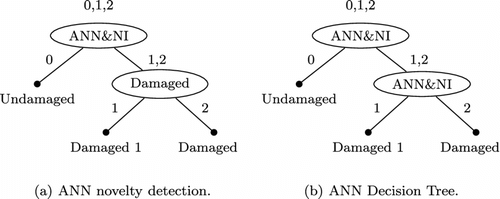
The second studied alternative solution utilizes SVM BDT [Citation5, Citation8]. The example investigated consists of three labels related to specimens condition (undamaged, damaged 1, damaged 2) and for each one instance, classes were assigned: 0, 1, 2. Then, the classes were organized in clusters since there are two outputs only at each level of BDT. The idea of binary classifier and BDT are shown in Figure . At the first stage of BDT, a structure can be classified as undamaged (0) or damaged (1, 2). Next, the damage patterns (1, 2) can be split into those related to the specimen with one damage (1) and two damages (2). In this task, the SVM NN was also trained using the computed principal components while at each level the respective input and out vectors were defined as:
Fig. 6 Scheme of SVMs used for the patterns classification.
Although, in general, the novelty detection provides a two-level classification (damaged, undamaged), it can be considered also as a multilevel classification indicating e.g. damage type, severity or number of damages. Obviously, the improved classification accuracy involves the application of a NN designed for multilevel classification. However, such an approach requires prior knowledge of the possible damage scenarios since the algorithm is based on class labels assigned to samples of measured data.
Results of NNs training
Pattern classification
ANNs training to novelty detection
The first identification level of the proposed diagnosis system was novelty detection. ANNs and a novelty index (3) were used for this purpose. From the 31 patterns obtained from laboratory tests the following specimen classes were assigned: undamaged and damaged (one or two damages).
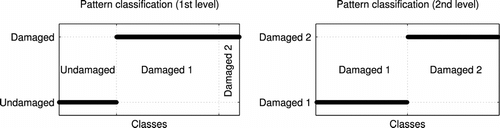
Since the number of patterns was relatively low, it was increased by adding to the source signals various time histories of the noise measured. In such a way 1120 patterns corresponding to the undamaged case were used for learning the ANN while further 880 patterns were used for ANN testing. It may be seen in Figure that, through the application of PCA and ANN, an extremely accurate pattern classification was achieved, even for patterns relating to incipient damages. It was proved that the ANN of architecture 16–5–16 could correctly separate the classes of damaged and undamaged structures for all the damage scenarios considered. Next, a novelty index was used for multilevel classification and separation of particular structure classes (undamaged, one damage, two damages). The results obtained are shown in Figure and given in Table . The biggest classification errors were associated with the separation of inter-classes. Novelty index accuracy, in this case, was approximately 90% for one damage, whereas the undamaged and two damages cases were classified with excellent (100%) accuracy.
Fig. 7 Results of testing the pattern classification using ANN (16–5–16) and novelty index.
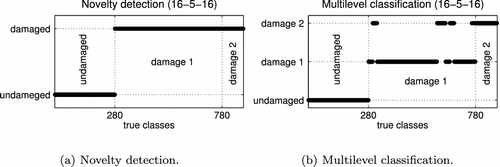
Table 1 Confusion matrix obtained for pattern classification using ANN (16–5–16) and novelty index.
Although the input vectors with different number of principal components were used (see Figure ) and each time, at least 20 times, the ANNs training was repeated, but unfortunately, it was not possible to train the classifier working properly in case of multilevel classification.
SVM and BDT
The damage detection approach using ANN and NI, described previously, works properly only for a two-class problem. Therefore, in the multilevel classification task, the possibility of using SVM classifier and BDT have also been taken into account.
Among all the SVM kernel functions available in Matlab Bioinformatics Toolbox, a selected Gaussian Radial Basis Function (RBF) kernel with a default scaling factor usually leads to very good solutions.
The idea of using BDT was described earlier, while the SVM training was started by determining the value of the parameter . Taking into account the change in the number of support vectors, the value of this factor was definitively set at 2.9 (Figure ).
Fig. 8 Changes in the number of support vectors for various parameters of SVM training.
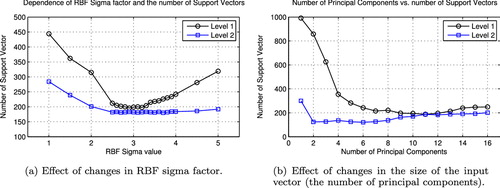
Next, SVM training was performed for input vectors consisting of a different number of principal components. In this case, stabilization of the number of support vectors was obtained when the length of the input vector was at least equal to the number of six principal components (Figure ).
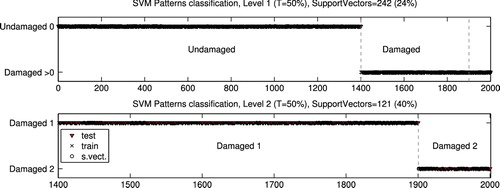
An example of the result of multilevel pattern classification based on the processed signals of elastic waves is shown in Figure . Training patterns have been separated in this case in relation: learning (L) and
testing (T). As can be seen, separation accuracy of the patterns into three classes in this case is
percent, which is a better result than the use of ANN’s and NI.
Fig. 9 SVM Patterns classification (6 PCs, RBF ).
ANN’s in the decision tree
Based on the analogy to the previous approach, the ANN’s were organized in a decision tree (DT), as shown schematically in Figure . As before, ANN training involves learning the mapping relationship between patterns of the same class. If the system response deviates significantly from the learned pattern, based on the value of novelty index (3) and accepted threshold level, it can be stated that the pattern belongs to another class.
Fig. 10 Schemes of ANN’s used for the multilevel pattern classification.
In this experiment, the process of ANN’s DT training was repeated several times for input vectors with different numbers of principal components. In order to assess the suitability of trained classifiers a correct rate was introduced, which aims to measure the percentage of correctly classified patterns at each level of DT. The results of this investigation are shown in Figure , where it can be seen that every time manages to train the classifier working properly at level 1. However, only from the input vector containing eight principal components, it was possible to train a classifier operating properly also at the second level. If it is compared with the results presented in Figure , the correct classification of patterns was previously completely impossible. Sample results of the ANN’s DT classifier working properly at both levels are shown in Figure .
Fig. 11 Statistical parameters of correct rate calculated for 20 repetitions of ANN’s training.
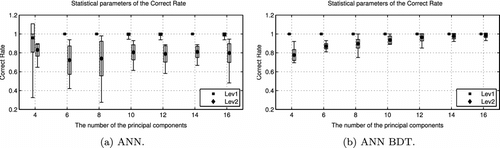
Fig. 12 Pattern classification by ANN’s BDT.
Damage prediction using NNs
The second stage of SHM system is the prediction of damage parameters, which can rely on the identification of the probable location of the damage and determine its size. It is a task in which soft computing methods can be successfully applied such as neural networks.
At the stage of laboratory measurements, a series of experiments were carried out with the participation of both continuous and impulse signals, forcing the elastic wave propagation [Citation5]. Every time, the signals were subjected to processing aiming at the determination of signal features sensitive to changes caused by the occurrence and growth of damage.
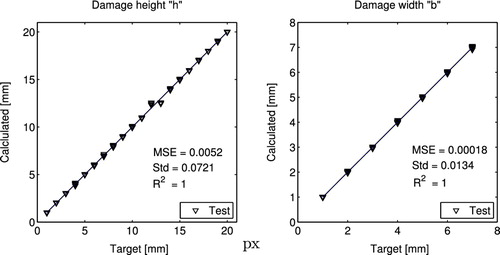
The studies conducted with multiple repetitions of NN training show that for each of the analysed signals, it was possible to determine the parameters of damage with fairly good accuracy. However, taking into account recent investigation with PCA, the best results in the case of steel strip considered were obtained by training the NN on the basis of principal components. Based on the obtained results of training the neural networks (Figure ) the input vector length was set to sixteen components while the number of neurons in the hidden layer starting from seven seems to provide satisfactory precision. For example, the results of this study obtained for the network architecture 16–7–2 are shown in Figure for testing the damage prediction. It can be seen that the identified parameters have a very good agreement. The testing error does not exceed mm (information about the size of the damaged area is contained in the chart axis labels).
Fig. 13 The results of testing the neural networks of different architectures.
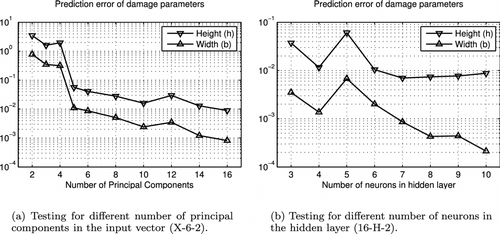
Fig. 14 Results of testing the NN (16–7–2) trained to predict the damage height and width.
Conclusions and final remarks
The obtained results of novelty detection have shown that two-level (undamaged, damaged) pattern classification was done perfectly. However, in case of multilevel classification (undamaged, 1 damage, 2 damages), the biggest errors were associated with separation of inter-classes. The accuracy for the specimen studied was approximately 90% for one damage, whereas the undamaged and two damages cases were classified with 100% accuracy. In contrast, a multilevel classificiation by the trained SVM BDT classifier and ANN’s organized into DT could be performed perfectly.
After this stage, another type of NNs was applied to evaluate the damage parameters. Finally, the obtained results followed many repetitions of NN training with various input vectors related to the extracted wave parameters, type of excitation signal (continuous, impulse), frequencies, location of control points, etc. The achieved testing accuracy for the steel strip varied between and 0.567 mm.
The results of investigations have proved that soft computing methods have a great potential in the field of damage detection and evaluation. The approach presented here allows automation of structure testing and seems to be very useful for online SHM systems.
Acknowledgments
Apparatus/Equipment purchased in the project No POPW.01.03.00-18-012/09 from the Structural Funds, The Development of Eastern Poland Operational Programme co-financed by the European Union, the European Regional Development Fund.
References
- Giurgiutiu, V, 2005. Tuned lamb wave excitation and detection with piezoelectric wafer active sensors for structural health monitoring, J. Intell. Mater. Syst. Struct. 16 (2005), pp. 291–305.
- Lee, BC, and Staszewski, W, 2007. Lamb wave propagation modeling for damage detection: II, Damage monitoring strategy. Smart Mater. Struct. 16 (2007), pp. 260–274.
- Staszewski, W, Lee, BC, Mallet, L, and Scarpa, F, 2004. Structural health monitoring using laser vibrometry: I, Lamb wave sensing. Smart Mater. Struct. 13 (2004), pp. 251–260.
- Nazarko, P, and Ziemiański, L, 2010. Towards application of soft computing in structural health monitoring, in artificial intelligence and soft computing, LNAI 6114. Berlin: Springer-Verlag; 2010. pp. 56–63.
- Nazarko P. Comparative analysis of auto-associative NNs and SVMs applied to patterns classification in the damage detection system. In: 19th International Conference on Computer Methods in Mechanics. 2011 May 9–12; Warsaw (Poland). p. 379–380..
- Waszczyszyn, Z, and Ziemiański, L, 2005. Parameter identification of materials and structures, CISM Courses and Lectures. 469 (2005), pp. 256–340.
- Nazarko, P, and Ziemiański, L, 2009. "Novelty detection and damage evaluation in laboratory models". In: Cunha, A, and Rodrigues, J, eds. SMART’09 Smart Structures and Materials. FEUP The Faculty of Engineering of the University of Porto: Portugal; 2009. pp. 359–360.
- Madzarov, G, Gjorgjevikj, D, and Chorbev, I, 2009. A multi-class SVM classifier utilizing binary decision tree, Informatica. 33 (2009), pp. 233–241.
- Worden, K, and Dulieu-Barton, JM, 2004. An overview of intelligent fault detection in systems and structures, Struct. Health Monit. 3 (2004), pp. 85–98.
- Hernandez-Garcia, MR, and Sanchez-Silva, M, 2007. "Learning machines for structural damage detection". In: Lagaros, ND, and Tsompanakis, Y, eds. Intelligent computational paradigms in earthquake engineering. Hershey, PA: Idea Group; 2007. pp. 158–187.
- Kuźniar, K, and Waszczyszyn, Z, 2006. Neural networks and principal component analysis for identification of building natural periods, J. Comput. Civil Eng. 20 (2006), pp. 431–436.
- Nazarko, P, and Ziemiański, L, 2011. Application of artificial neural networks in the damage identification of structural elements, Comput. Assist. Mech. Eng. Sci. 18 (2011), pp. 175–189.