 ?Mathematical formulae have been encoded as MathML and are displayed in this HTML version using MathJax in order to improve their display. Uncheck the box to turn MathJax off. This feature requires Javascript. Click on a formula to zoom.
Abstract
This research investigated imaging quality of two important methods widely used in electromagnetic inverse scattering problems. The algorithms, time reversal (TR) and linear sampling method (LSM), were compared for resolution of point imaging and a correlation indicator to determine image quality. Comparisons were made in single- and multifrequency modes for 2D scenarios in free-space. Comparisons revealed that resolution of TR is much better than LSM. In order to compare the total reconstructed images, several cases were considered to determine a comprehensive conclusion. The simulations were done based on experimental data. In this case, comparisons showed that in the term of correlation indicator, LSM surpasses TR.
1. Introduction
Image quality among microwave techniques is open to debate. The term quality is a descriptive expression. It needs to be quantified in order to compare and evaluate different methods. Some prior researches have been done comparing image quality among inverse methods.[Citation1,Citation2] A common technique to quantify this term is considering resolution of method as an index of quality.[Citation3] Unfortunately, resolution is a somewhat ambiguous term and there are several proposed definitions for resolution.[Citation4] The term resolution is an inherent characteristic of each imaging methods and it needs clarification and a mathematical definition. Comparison of imaging resolutions for different imaging methods is commonly applied to determine imaging quality. The intention of this study was to compare resolution between two important inverse methods; linear sampling method (LSM) [Citation5–Citation9] and time reversal (TR).[Citation10–Citation12]
LSM and TR are both methods of qualitative reconstruction. These methods represent different interpretations from a unique physical phenomenon; LSM is a frequency domain method and TR has originated from methods of time domain reconstruction. TR can be considered as an interpretation of distorted wave Born approximation (DWBA).[Citation13] Linear form of inverse scattering theory can be applied in order to implement a matched-filter response in the space-frequency domain, while time domain implementation of TR algorithm with the finite difference time domain (FDTD) method proposes some advantages. Time domain implementations do not need Green function calculations for ambient media, due to inherent characteristics of the FDTD in that inhomogeneity can be inserted directly to FDTD lattice. In addition, FDTD can simulate dispersive media. Furthermore, the FDTD method can simulate full-wave 3D problems. Implementation of TR using FDTD could have practical application in areas such as geophysics, where it is referred as time migration.[Citation14–Citation16]
Several migration techniques have been proposed in recent years. Although these techniques are different but a common characteristic is that most of them can be described using matched-filter concept. The main difference between such methods arises from interpretation of the wave propagation implemented in the filter. A migration method with the focus on reverse time migration is described in [Citation15]. The technique manipulates electromagnetic wave propagation theory and scattering, as well as matched-filtering. The procedure has some suppositions, as described below:
| (1) | The profile of the object is divided into several distinct point scatterers. This type of approximation permits evaluation of each single pixel by a separate filter. | ||||
| (2) | The linear scattering assumption allows each filter to be made independently. | ||||
| (3) | A priori data or initial information on a background medium is essential for wave propagation (this is a common point of several imaging methods). | ||||
Based on described points, LSM reveals advantages in comparison with TR. The LSM is a linear method which is based on solving an integral equation, while needs no linearization. The linear equation in LSM is an exact relation without any approximation. Thus, the LSM can consider the whole aspect of problem including multi-bounces in the data. In the framework defined for LSM, the method acts effective when using a large number of multi-static data. This form could be impractical for several imaging cases. For situations, in which a finite amount of data is available, the quality of LSM image is heavily dependent on the availability of dense multi-static data. In addition, in various practical cases, measurements at high frequencies might be sparse and the distribution of measurement and incident waves could be non-uniform. In these situations, image reconstruction using LSM may fail. It is known in general that the availability of multi-frequency data should compensate for reduced spatial diversity, however it is not directly revealed that how this point could be incorporated for LSM.[Citation17] Thus, one of the major problems for LSM is how to compensate in under-sampled spatial data cases.
This study aimed to compare image quality of the two aforementioned methods in the same framework. The first step was to present a definition of the term resolution. The Rayleigh resolution definition was adopted to make the comparison. Following this definition, resolution was presented for the LSM and TR methods for single- and multifrequency modes.
Resolution describes the image quality for each single pixel. Also important for relating quality of an imaging method is proximity and resemblance between a reconstructed image and the real target; so effectiveness of an algorithm is determined in terms of localization and shape detection of the real target. To the best of our knowledge, a unique agreement in determining this feature of imaging methods has not yet been reached in the literature. An index called image correlation indicator has been applied to compare quality of the reconstructed images between the two methods. This index is defined and used to compare imaging quality accordingly. For the sake of quality comparison between resultant images from these algorithms, reconstructions were made under the Fresnel institute dataset [Citation18] and the different shapes were examined.
2. Mathematical background
A matrix with dimensions is defined as multistatic data matrix
. Elements of this matrix are determined by the value of the signal received at antenna number
, when the excitation is sent as an impulse from the transmitter antenna number
.
is the signal frequency and
is the number of antennas. In transverse magnetic (TM) mode, and for a two dimensional configuration, it is assumed that the structure is extended across z-axis. Based on this assumption, the vector form of scattering equation could be simplified to scalar equations. Therefore,
is used instead of
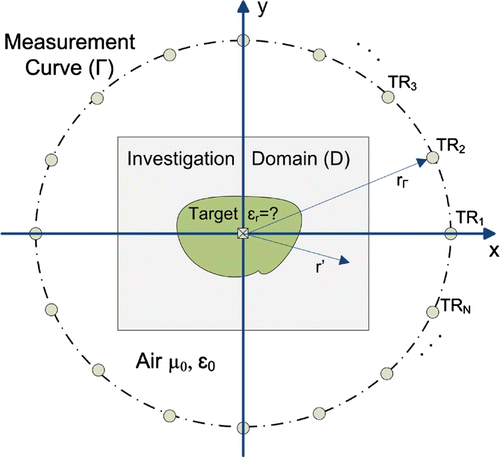
. Figure 1 shows the geometry of the problem in hand with multistatic configuration of filamentary transmitter/receiver antennas which are located on circumference (
) of the measurement curve. Investigation domain is also denoted with
. Assuming time harmonic radiation field
, the spatial part
of the electric field satisfies the Helmholtz equation:
(1)
(1)
where represents wavenumber and
and
stands for permeability and permittivity of the medium, respectively. Electric field can be decomposed into an incident and scattered part,
, where the incident field is propagated by source antennas, while the object is not present. Scattered wave is the reaction of object to incident wave. The incident field generated by source could be revealed as below:
(2)
(2)
the represents source current spectrum, while
is free-space scalar Green function and
. Based on theorem of volume equivalence,[Citation19]
in throughout of the region
can be replaced by
, provided discontinuity’s effect due to presence of the object is taken into account by an equivalent current source. Thus
where
denotes the object function. The solution for Equation (Equation1
(1)
(1) ) is:
(3)
(3)
3. Methods formulation: LSM & TR
3.1. Linear sampling method
The LSM is based on sampling within the investigation domain. A Fredholm linear integral equation is solved for each point. The subsequent Fredholm linear integral equation of the first kind is the preliminary point for LSM formulation [Citation5](4)
(4)
where is a sampling point inside the investigation area and
and
are the source and measurement positions on
, respectively. In the far field region, Green function can be approximated as
. Parameter
is a function that is known from solving the integral equation. Its Euclidian norm is small when
is inside the scatterer, as
travels close to its exterior contour or outside the object, the norm increases to a very large value. Therefore, the first step is to pixelate the investigated area. In the simulation process, we corrupt the input data with a specified noise in order to overcome inverse crime and to meet the conditions for practical measurement. As a result,
will be substituted by
. Then, assessment of noise power is reached when parameter
is defined so that
. Generally,
could be originate from several source of uncertainty including that of noise. As the discretized equation is ill-conditioned, a regularization method with an optimum regularization parameter (
) is applied. Using singular value decomposition (SVD)
,
is the root of the following equation [Citation20]
(5)
(5)
where the diagonal elements of
are singular values and
columns of
are singular vectors. Parameter
is the rank of
and
. Once
is calculated, norm of
can be obtained as [Citation20], according to the Tikhonov regularization method:
(6)
(6)
Choosing a monotonic indicator function for the norm of ,
, provides a tool to identify the scatterer boundary. Specific indicator function has been chosen here, different choices of indicator functions may influence the overall image however.
The basic form of LSM has been proposed for single frequency. However, recently in some studies,[Citation21–Citation24] multi-frequency LSM is proposed to overcome the weakness of LSM under sparse small aperture data. Guzina et al. [Citation22] proposed two candidates for multi-frequency indicator function and concluded that serial indicator is not able to distinguish interior boundary of the scatterer from the exterior, when the define frequency bandwidth traverses one of the isolated eigenvalues of interior problem. In general, these eigenvalues are unknown since the contour of obstacle is not known before reconstruction. Contrary to serial form, the parallel indicator
is not sensitive to the presence of pertinent interior eigenvalues. Therefore, it seems to be robust in a generic scattering configuration. In order to omit the effect of possible singularities, the result of single frequency reconstruction could be merged to attain a normalized paralleled index as below [Citation21]:
(7)
(7)
where is the number of frequencies.
3.2. Time interval
TR family methods recommend a distinctive prospect to solve electromagnetic focusing techniques. They have been employed in engineering problems such as acoustics for some years and more recently they have been applied to electromagnetics. TR methods can be interpreted as a spatiotemporal matched-filter method.[Citation12] By considering Equation (Equation3(3)
(3) ) and using DWBA, the scattered field in the frequency domain can be represented as below [Citation25]
(8)
(8)
In order to solve the problem, the investigation domain should be discretized into pixels. After discretizing and applying the reciprocity theorem:
(9)
(9)
where is the scatterer strength of
pixel.
In match filter formulation, final migrated data can be interpreted as an image with a finite number of pixels. Suppose that every pixel has a main point scatterer that may be modelled in such a way that an object’s profile can be assumed as an impulse located at , the center of the pixel. Mathematically, the transfer function of a match filter can be revealed as a complex conjugate of a presumed received waveform from the object under evaluation to which the filter is going to be matched. In cases when it is acceptable to suppose a linear scattering model, i.e. interactions between scattering centres can be neglected, it is possible to take account of the match filter of the point scatterer directly from the expected received signal waveform, and this makes it essential to conjugate the gathered data prior to application of the filtering process.[Citation16] Therefore, in accordance with (Equation9
(9)
(9) ), the output result of the match filter could be presented as below:
(10)
(10)
where the highest value of function will occur at or in the neighbourhood of the scatterer point (). In such a case, this is the image of the point scatterer.
From formula (Equation10(10)
(10) ), the right-hand side of the equation can be divided into two distinct terms and this division corresponds to its physical interpretation. The first is the electrical field of a current source
. If we take into account time dependence of the received wave signal, then the source can be revealed as a TR
. The generated field of this source is referred as back propagated electric field
. The second term of the equation is the incident wave
.[Citation16] In conclusion, when the investigation domain is pixelated, and TR procedure is used (i.e. the phase conjugation technique is applied), then complete expression for migrated data could be defined as suggested by Liao and Dogaru [Citation26]:
(11)
(11)
4. Comparison of algorithms
4.1. PSF and resolution
Resolution can be considered as an appropriate indicator for quality of an imaging system or method; however, resolution needs mathematical definition. For many years, optic researches have used several definitions of resolution. In classical definitions, resolution means the ability of an imaging system or method to resolve a point in the vicinity of another point whereby these two points generate a scattered field of equal intensity. A common definition for resolution limit is proposed by Rayleigh’s criterion. In Rayleigh’s criterion, two neighbouring points are resolved if the maxima of the scattered wave function of one point occurs at the first minima of the scattered wave function of other points, or at a point far away from the minima. If resolution can be achieved beyond these limits then it is termed a super resolution.[Citation3]
The definition of resolution used in this study is the Rayleigh criterion. According to the Rayleigh criterion, when a single point is imaged by a system or method, due to diffraction, the image will not be a single point and the image has non-zero width, while the mathematical width of a point is zero. The resulting distribution is termed point spreading function (PSF). In PSF, the image index has a peak at the location of an imaged point and it falls for the surrounding points. In an ideal imaging system, the image has its maximum in the location of a point and for any other points in the vicinity, the value of an index is zero, while in practical imaging methods, the value of an index for the neighborhood is much lower than that of the point, however the value is not zero.[Citation4]
In order to compare resolutions of the two methods according to Rayleigh resolution criterion, a single point needs to be reconstructed by both methods. Mathematical definition of a point is as follows; the point to be recovered is a dielectric cylinder with a circular cross section located at the centre of a coordinate. Radius of the circle is 7.5 mm. The dielectric relative permittivity is and it is lossless. Source and measurement locations on a circle are
equally spaced in 15 m of the object. All simulations are done in TM polarization.
Figure shows results of the reconstruction from single frequency synthetic data obtained by method of moment forward solver at 3 GHz. Based on this figure and the Rayleigh criterion, resolution of the two methods can be calculated as shown below:(12)
(12)
(13)
(13)
Figure 2. Normalized PSF of (a) LSM and (b) TR in single-frequency free-space reconstruction. (c) Comparison of the profiles of the single-frequency PSFs for LSM and TR. Extremums of main lobe for each method have been denoted with appropriate numbers.
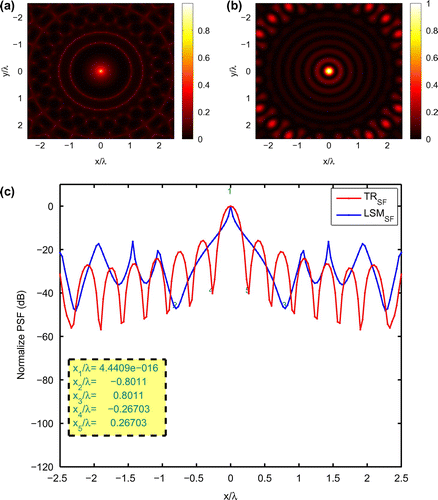
Figure and equations show that the TR method had finer and thus better resolution. Results demonstrate that TR image quality surpassed that of LSM for imaging a single point. However, analysis of the figure determines that the null of LSM was obviously deeper than that of TR. This cannot be considered an advantage but it represents some kind of better contrast for the LSM method in comparison with TR.
To investigate the effect of frequency diversity on resolution of algorithms, the above-mentioned point scatterer is imaged by the multifrequency signal excitation that consists of a combination of 11 single tone signal from 2.5 to 3.5 GHz, with equal step increments of 100 MHz. The resulting images are depicted in Figure ( is the free-space wavelength at the centre frequency 3 GHz)
(14)
(14)
(15)
(15)
Figure 3. Normalized PSF of (a) LSM and (b) TR in multi-frequency free-space reconstruction. (c) Comparison of the profiles of the multi-frequency PSFs for LSM and TR. Extremums of main lobe for each method have been denoted with appropriate numbers.
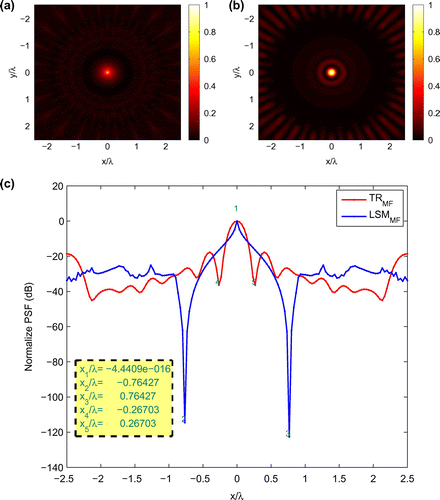
Results of multi frequency demonstrate some similarity to those of single frequency. It means that this attribute of methods almost independent from number of applied frequencies though the overall quality of the resultant images in this case have been improved.
According to Figures and , it can be said that the maximum peak for the LSM is sharper in comparison to the TR but next values of energy do not drop off as fast. So it is difficult to assess resolution in a clear way. This can go towards the point that a resolution measure in isolation is a hard measure to ascertain quality. Therefore, in order to clarify about this point, separation resolution of algorithms between two canonical objects [Citation3,Citation27] is reported in Figure by sweeping the distance () between two identical dielectric cylinders with radius of 25 mm and
. Simulations for this configuration are carried out at 3 GHz with
antennas uniformly located at a circle at distance of 1.5 m.
Figure 4. Separation resolution study: (a) resolution ratio for various distances between two dielectric cylinders (b) representation of profiles corresponding to (c), (d) and (e) reconstructed images obtained from LSM of cylinders scenario with
, respectively, and (f), (g) and (h) reconstructed images obtained from TR under similar conditions (The solid blue lines in each reconstruction plot indicate the true target boundary).
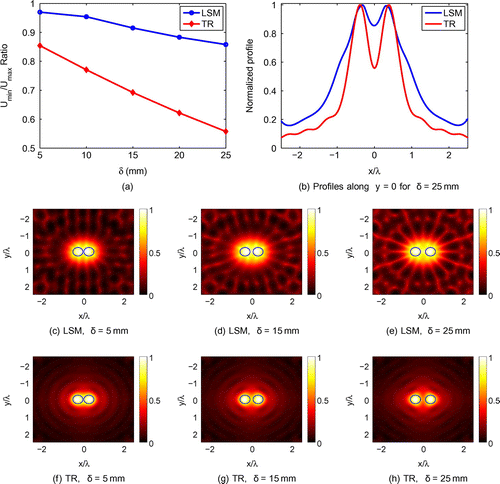
Semenov et al. [Citation27] used a cross-sectional profile across the centres of two cylinders and considered the ratio of the minimum value between them () to the first maximum closest to this minimum (
) as a metric to measure resolvability of experimental imaging systems. Following the same procedure and from Figure (a) and (b), it can be stated that the separation resolution for TR obviously better than that for LSM. This result is consistent with the previous discussion based on the Rayleigh criterion.
4.2. Correlation index
Another common standard for comparing methods is similarity between the reconstructed image and the real target. An indicator is needed to compare performance of the two methods. The Rayleigh resolution index was used to compare the quality of single point reconstruction between the two methods. Although all reconstructed images by different imaging methods consist of single points, the Rayleigh index is not appropriate for making comparisons of total image quality. Accordingly, it was necessary to propose a new indicator to determine image quality.
The focus of this study was to investigate qualitative methods to recover the shape and location of objects under evaluation. Based on this, the results of recovery related to whether or not a sample point belonged to an investigated object. This problem resembles a binary form: for a point on the object was assigned and for others,
. The indicator was then introduced based on this description. A
matrix was considered to image an area, which is discretized to
cells. In This matrix, elements that correspond to the surrounding free-space are equal to
while a point corresponding to the object is 1. This matrix is called the real target matrix.
For each method of imaging, when an image is constructed, a definition for the threshold and binarized images were defined accordingly. Two-dimentsional gradients of images demonstrated that maximum variation occurred next to the boundary between the scatterer and its host medium. Thus, normalized values of pixels with the maximum gradient could be chosen as a proper threshold for binarization. Based on this threshold, values below the threshold were assigned to and values higher than the threshold were assigned to 1 (object). Then, the correlation indicator was defined as described below; the indicator equals correlation of the two matrices; the real target matrix and the image matrix.
The quality of the whole image was then determined based on the proposed indicator. Definition of correlation for the two binary matrices and
is described below:
(16)
(16)
where and
are the mean values (average of matrix elements) of their corresponding matrices.
In this section, objects were reconstructed based on measurement data i.e. Fresnel institute data-set. This data-set is related to an aspect-limited configuration in which the source is transferred along the circumference of a circle, while the spacing of the steps is 10 per step and for each wave illumination , the measurement receiver antenna was moved in
steps along a
arc which excluded the
angular sector centred around the incidence direction. Four configurations were considered for imaging. These configurations are depicted in Figure .
Figure 5. Configuration of test structures: (a) an off-centred dielectric cylinder (b) a rectangular conductor (c) two dielectric, symmetrical located on axis, cylinder (d) a u-shaped conductor. All dielectric cylinders are with circular cross section of radius 15 mm and the real part of the relative permittivity .[Citation18]
![Figure 5. Configuration of test structures: (a) an off-centred dielectric cylinder (b) a rectangular conductor (c) two dielectric, symmetrical located on axis, cylinder (d) a u-shaped conductor. All dielectric cylinders are with circular cross section of radius 15 mm and the real part of the relative permittivity ϵr=3±0.3.[Citation18]](/cms/asset/df5ed3ae-6d92-4128-93d1-41695c0fba6a/gipe_a_1104308_f0005_b.gif)
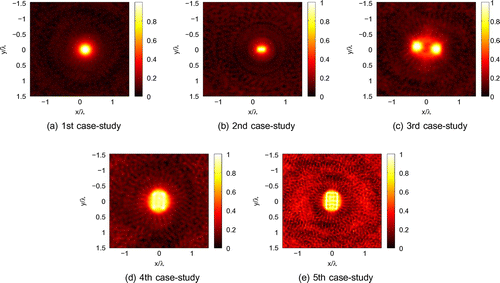
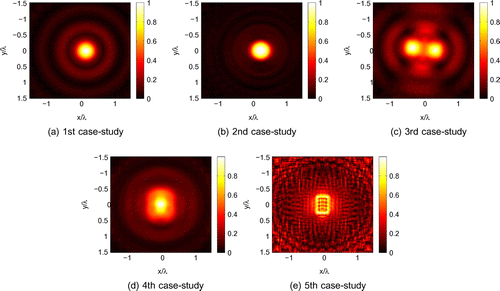
Imaging was done with frequency diversity in a set of frequencies: 2, 4, 6 & 8 GHz. For the u-shaped structure, due to its complicated shape, more resolution was needed. Hence for this scenario, reconstruction was repeated at higher frequency bands, i.e. 10, 12, 14 & 16 GHz and named the fifth case study. Results of the reconstructed images are depicted in Figures and . In these figures, investigation domain has been pixelated into
pixels in all reconstructions and
denotes the free-space wavelength at the frequency 2 GHz.
As aforementioned, binarization was necessary to evaluate quality. The resultant binary images from LSM and TR are shown in Figures and , respectively. Also, binary images of the test scenarios under evaluation, which are necessary tools for obtaining a correlation index in each case, should be calculated with the same number of pixels.
Figure 8. Binary images obtained from Figure with Gradient-based threshold set to: (a) 0.6595, (b) 0.6377, (c) 0.7976, (d) 0.6966 and (e) 0.5813.
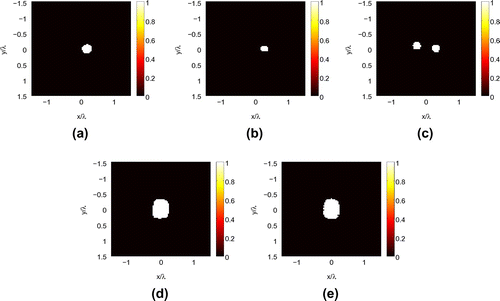
Figure 9. Binary images obtained from Figure with Gradient-based threshold set to: (a) 0.3833, (b) 0.3909, (c) 0.4531, (d) 0.7232 and (e) 0.4728.
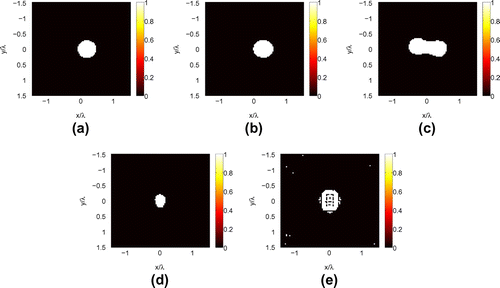
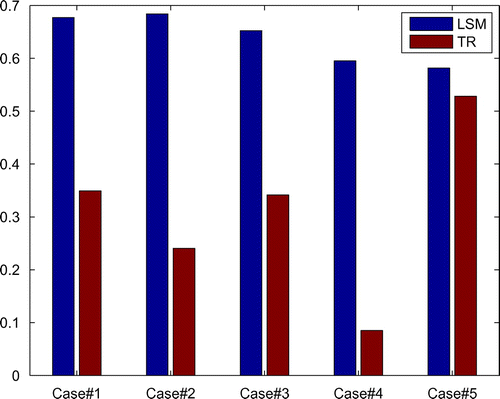
Based on these results, the two methods were compared by the suggested correlation index. The correlation index is calculated for five case studies. The results are illustrated in Figure .
Based on the proposed threshold, the quality of total image for LSM was much better than that of TR. This is a fascinating result because when quality is compared between resolutions, TR was much better than LSM. This demonstrates that resolution parameter is not sufficient enough to determine quality of an imaging algorithm. By comparing the indices of fourth and fifth case studies, it can be stated that increasing the imaging frequency evidently increased the quality of TR, while it had no effect on the LSM image.
At this point, it should be noted that the value of the correlation index was highly dependent on the value of the threshold. As discussed in several references, the decision threshold criterion is an open dispute in imaging methods. Usually, if another threshold criterion is adopted then correlations will show different results. In order to present the importance of threshold value setting and evaluating the maximum capability of algorithms in retrieving known scenarios, an F-measure score can be exploited. The F-measure score is a quite common indicator in imaging and vision.[Citation17,Citation28] This score takes into account the precision as well as recall of a detector with following definition which is a function of threshold () and seeks the argument that achieves the maximum F-measure:
(17)
(17)
where(18)
(18)
(19)
(19)
and
denote the reconstructed image after binarization and true target for corresponding scenario, respectively. Table presents a summary of quantified assessment of algorithms based on Fresnel institute experiments. Although ideal threshold determination is not possible in practice, in order to study F-measure score, here the known real target is considered, which provides the maximum accessible performance of each method under different conditions which in turn provides an even-handed quantitative measure to assess imaging quality.
Table 1. Quantitative assessment of image reconstruction using of the F-measure. Higher recall-precision performance leads to a higher score.
Table reveals that in second, third and fourth case studies LSM shows a better upper limit of performance than TR. Since these scenarios contain PEC or multiple dielectric targets, these results are due to Born approximation usage in TR formulation which assumes weak scattering nature model and neglect multiple scattering events. Indeed these results confirm the claim that LSM can overcome Born-approximated methods, when multi-bounce events are considered. However, in the first case, TR acts quite similar to LSM. Even TR performance is slightly better than LSM in retrieving single low-contrast dielectric cylinder. In fifth case, TR has better score than LSM in exploiting high frequency raw data.
5. Conclusion
This comprehensive study was done to compare image quality of TR and LSM. Two indexes were introduced to compare imaging quality, the Rayleigh resolution for point imaging quality and a proposed index called the correlation index for total image quality. In terms of the resolution parameter, results showed that quality was better in TR than LSM. Resolutions of both methods were similar for single frequency and multifrequency imaging. These results demonstrate that the TR method could produce finer points than LSM. In order to compare total image between the reconstruction methods, a new indicator called the correlation index was recommended whereby imaging was made using real measurements. Simulation showed that image quality for LSM was much better than that of TR. In addition, the recovery quality for LSM was somehow constant and not dependent on an object’s structure or material, while this was not the case for TR. Increasing imaging frequency improved the quality of a TR image, but had no effect on quality of the LSM image.
Acknowledgements
The authors would like to thank Dr M. Dehmollaian at University of Tehran, Tehran, Iran, for helpful consultations on various steps of this study. The authors would also like to acknowledge the anonymous reviewers for their constructive comments and suggestions to improve this work.
Notes
No potential conflict of interest was reported by the authors.
References
- Cui TJ, Chew WC, Yin XX, et al. Study of resolution and super resolution in electromagnetic imaging for half-space problems. IEEE Trans. Antennas Propag. 2004;52:1398–1411.
- Zhang P, Zhang X, Fang G. Comparison of the imaging resolutions of time reversal and back-projection algorithms in EM inverse scattering. IEEE Geosci. Remote Sens. Lett. 2013;10:357–361.
- Gilmore C, Mojabi P, Zakaria A, et al. On super-resolution with an experimental microwave tomography system. IEEE Antennas Wirel. Propag. Lett. 2010;9:393–396.
- den Dekker AJ, van den Bos A. Resolution: a survey. J. Opt. Soc. Am. A. 1997;14:547–557.
- Colton D, Haddar H, Piana M. The linear sampling method in inverse electromagnetic scattering theory. Inverse Prob. 2003;19:S105–S137.
- Cakoni F, Colton D, Monk P. The linear sampling method in inverse electromagnetic scattering. 1st ed. Philadelphia (PA): Society for Industrial and Applied Mathematics; 2010.
- Catapano I, Crocco L, Isernia T. On simple methods for shape reconstruction of unknown scatterers. IEEE Trans. Antennas Propag. 2007;55:1431–1436.
- Brignone M, Coyle J, Piana M. The use of the linear sampling method for obtaining super-resolution effects in born approximation. J. Comput. Appl. Math. 2006;203:145–158.
- Cheney M. The linear sampling method and the music algorithm. Inverse Prob. 2001;17:591–595.
- de Rosny J, Lerosey G, Fink M. Theory of electromagnetic time-reversal mirrors. IEEE Trans. Antennas Propag. 2010;58:3139–3149.
- Borcea L, Papanicolaou G, Tsogka C. A resolution study for imaging and time reversal in random media. Contemp. Math. 2003;333:63–77.
- Sarabandi K, Koh I, Casciato MD. Demonstration of time reversal methods in a multi-path environment. IEEE Antennas Propag. Soc. Int. Symp. 2004;4:4436–4439.
- Kosmas P, Rappaport CM. A matched-filter fdtd-based time reversal approach for microwave breast cancer detection. IEEE Trans. Antennas Propag. 2006;54:1257–1264.
- Kosmas P, Rappaport CM. Time reversal with the fdtd method for microwave breast cancer detection. IEEE Trans. Microwave Theory Tech. 2005;53:2317–2323.
- Leuschen CJ, Plumb RG. A matched-filter approach to wave migration. J. Appl. Geophys. 2000;43:271–280.
- Leuschen CJ, Plumb RG. A matched-filter-based reverse-time migration algorithm for ground-penetrating radar data. IEEE Trans. Geosci. Remote Sens. 2001;39:929–936.
- Alqadah HF, Valdivia N. A frequency based constraint for a multi-frequency linear sampling method. Inverse Prob. 2013;29:095019–095046.
- Belkebir K, Saillard M. Special section: testing inversion algorithms against experimental data. Inverse Prob. 2001;17:1565–1571.
- Harrington RF. Time-harmonic electromagnetic fields. New York (NY): McGraw-Hill; 1961.
- Pastorino M. Microwave imaging. Hoboken (NJ): Wiley; 2010.
- Catapano I, Crocco L, Isernia T. Improved sampling methods for shape reconstruction of 3-d buried targets. IEEE Trans. Geosci. Remote Sens. 2008;46:3265–3273.
- Guzina BB, Cakoni F, Bellis C. On the multi-frequency obstacle reconstruction via the linear sampling method. Inverse Prob. 2010;26:125005–125034.
- Erramshetty M, Bhattacharya A. Shape reconstruction of mixed boundary objects by linear sampling method. IEEE Trans. Antennas Propag. 2015;63:3077–3086.
- Guo Y, Monk P, Colton D. The linear sampling method for sparse small aperture data. Appl. Anal. 2015;94:1–17.
- Devaney A. Time reversal imaging of obscured targets from multistatic data. IEEE Trans. Antennas Propag. 2005;53:1600–1610.
- Liao D, Dogaru T. Full-wave characterization of rough terrain surface scattering for forward-looking radar applications. IEEE Trans. Antennas Propag. 2012;60:3853–3866.
- Semenov S, Svenson R, Bulyshev A, et al. Spatial resolution of microwave tomography for detection of myocardial ischemia and infarction-experimental study on two-dimensional models. IEEE Trans. Microwave Theory Tech. 2000;48:538–544.
- Arbelaez P, Maire M, Fowlkes C, et al. Contour detection and hierarchical image segmentation. IEEE Trans. Pattern Anal. Mach. Intell. 2011;33:898–916.

