 ?Mathematical formulae have been encoded as MathML and are displayed in this HTML version using MathJax in order to improve their display. Uncheck the box to turn MathJax off. This feature requires Javascript. Click on a formula to zoom.
Abstract
A method of coherent multifrequency acoustic tomography and holography of spatially localized subbottom inhomogeneities in shallow seas is proposed. This method is based on solving of the near-field inverse scattering problem that makes it possible to realize a subwavelength resolution. It involves the analysis of measurement data obtained by the 2D transversal scanning with the source-receiver system along the sea bottom, over the area of sounded inhomogeneities. The solution begins with the Born approximation, where the original 3D integral equation for the scattered field is reduced to the 1D Fredholm equation of the first kind relative to the depth profile of the lateral spectrum of inhomogeneities. When solving this integral equation for each pair of spectral components, the generalized discrepancy method is in use. Then, corrections to the Born approximation can be obtained in the proposed iterative procedure. For distributed inhomogeneities, the inverse Fourier transform of the retrieved spectrum gives their 3D distribution that can be visualized as tomography images. For solid targets, this spectrum is used to obtain their shape (i.e. to solve the problem of computer holography). Corresponding results of the numerical simulation are presented.
1. Introduction
Acoustic methods of remote diagnostics of the sea environment are now widely applied in multiple applications [Citation1], including the acoustic remote sounding of the seabed [Citation2–17]. Subbottom profilers [Citation18–25] give valuable information for marine technology and engineering, exploration of objects in basic sediments, ecological monitoring in the vicinity of ports, marine pipelines and offshore oil production platforms, and in the analysis of sediments in the marine archaeology. These profiling systems comprise a source of sound towed behind a vessel or firmly mounted to it that produces an acoustic signal (typically, pulse). Some part of the acoustic signal is reflected from the seafloor, whereas the remaining part penetrates the seafloor and is reflected from layers with different acoustic impedances. High-frequency systems (from 2 to 20 kHz) produce a high resolution (tens of cms) of sediment layers below the seafloor. Low-frequency systems (Sparker systems) working in 50 Hz to 4 kHz range have much greater penetration with typical resolution more than 2 m.
It is worth mentioning that the penetration of sound is decreased with frequency, necessitating a variety of subbottom profiling tools specific to different marine environments [Citation25]. The corresponding dependence is not linear; in the range 100–1000 Hz, the penetration depth changes dramatically – from 100 m at 1000 Hz – up to 2000 m at 100 Hz [Citation3]. As a result, various types of subbottom profilers have been developed: high-frequency (>2–3 kHz) boomer, pinger and chirper systems are developed to give very detailed information about near surface features, with bottom penetration of about 100 m. Medium frequency (~1 kHz) profilers such as the sparker system can penetrate to a depth of approximately 500 m, and maintain relatively good resolution. Very low frequency and high energy systems (<1 kHz), such as airgun systems may penetrate a number of kilometres into the seabed, with a corresponding reduction in resolution [Citation25]. However, any one of these systems gives no more than a visualization of the scattered acoustic field. To obtain the distribution of physical parameters of subbottom inhomogeneities, it is necessary to solve corresponding inverse scattering problems.
Solving such a problem is an uneasy task as it demonstrates a history of similar investigations in electrodynamics. The method of scanning tomography proposed in this paper is based on hydrodynamics equations for the sound propagation in layered media [Citation26,27] with low-contrast subbottom inhomogeneities, such as mud-like depositions. Because the statement of this problem for above-mentioned pulse profilers is too complicated, our method involves the analysis of multifrequency measurements of complex amplitudes of harmonic signals obtained by 2D transversal scanning along the bottom in the near-field zone above inhomogeneities. Unlike pulse sounding, where the depth sensitivity is related to the pulse delay, in this case, the frequency dependence of the near-field penetration is employed. In this approach, developed earlier in electromagnetic sounding [Citation28–30], a subwavelength resolution can be realized by measurements of targets in the near-field zone with small-aperture probes. It can be especially important in cases of a strong sound absorption in the sounded medium, when it impossible to use higher frequencies. Based on such measurements computer tomography provides the retrieved 3D distribution of the sound speed perturbation in subbottom inhomogeneities that can be visualized as tomography images. For solid targets with a homogeneous internal structure, the inverse problem consists in calculation of their geometric shape. Its visualization gives us images of such a computer holography.
Within the scope of this approach, the inverse scattering problem is considered on the base of the 3D integral equation of the first kind obtained from the relevant Helmholtz equation. We apply here, the approach that has been developed by us in the near-field subsurface electromagnetic tomography [Citation28–30]. In these papers, 2D distributions of the scattered signal over transversal coordinates are involved in analysis. To provide the depth sensitivity, these data should be obtained in dependence on a third parameter (such as signal frequency, sensor elevation, or its size). Here, we consider a multifrequency method as the most simple in realization.
Such a 3D problem leads to strong limitations of the grid size of discretization used at numerical calculations and, hence, to limitations of the achievable resolution. To overcome this difficulty, we propose to use the scheme of measurements that has been realized in electromagnetic diagnostics [Citation29,30] – the scanning at the condition of the unchanging source-receiver relative position. In analysis, this scheme enables one to make 2D Fourier transform of the corresponding 3D integral equation over transversal coordinates in the Born approximation and, thereby, reduce this problem to the multiple solution of obtained 1D integral equation. It was shown in these papers that for subsurface targets in the near-field zone, the property of small-aperture antennas to generate and receive evanescent waves made it possible to realize a subwavelength resolution of such a tomography that has been demonstrated with the multifrequency microwave scanning system [Citation30]. Note, that it is the only way when it is impossible to use higher frequencies (or short pulses) – technically, or because of large extinction in media.
In this paper, we use this approach to develop a hydroacoustic method of subbottom near-field multifrequency tomography (retrieval of 3D structure of sound speed perturbations in distributed inhomogeneities) and holography (retrieval of the shape of inhomogeneities with sharp boundaries). Possibilities of this new diagnostics are demonstrated in numerical simulation.
2. Theory
In Figure , one can see the scheme of proposed near-field tomography based on data of 2D scanning in x-y plane along the bottom in the near zone, over the region of subbottom inhomogeneities.
Figure 1. Scheme of the main elements of the acoustic system for the subbottom tomography in the sea waveguide.
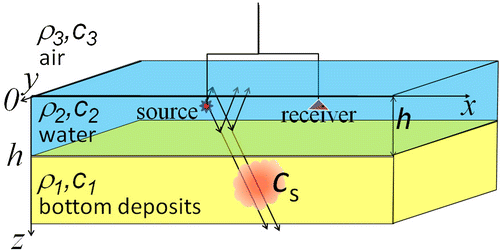
This method can be used in diagnostics of objects in the bottom sediments. In the formulation of this problem, we can use the three-layered model (1 – liquid half-space, such as mud-like sediments; 2 – water (for example, shallow sea); 3 – air). If the bottom represents as a more consolidated environment, a more appropriate seabed model would be an elastic half-space [Citation26]. In the liquid half-space at z > h (medium 1), we assume the density ρ = ρ1, and the velocity of sound c = c1. In the water layer (0 < z ≤ h, medium 2) ρ = ρ2, the velocity of sound c = c2. The third medium in the half-space z ≤ 0 is air. In general case, observable objects could be heterogeneous both of the speed of sound and density. In view of the complexity of this formulation, in this paper, we consider these problems separately. At first, we consider the case of refractive inhomogeneities, i.e. of a small perturbations cs in a medium with the constant velocity c = c0 of sound, i.e. , where
,
.
From Euler, continuity and state equations for the perfect incompressible liquid, the wave equation for the sound wave pressure P is written in the linear approximation [Citation26] as:
(1)
(1)
where – pressure at the point
and time t, c2 = ∂P/∂ρ is the velocity of sound, f is the source. The analysis is based on the solution of the Helmholtz equation obtained from (1) for the complex amplitudes
of the pressure wave
(ω is cyclic frequency) and of the source
:
(2)
(2)
where k = ω/c. Equation (2) can describe the propagation of waves in absorbing media, if we assume [Citation26]; here ζ, η – shear and bulk viscosity, respectively. Absorption becomes significant as the frequency increases. For example, absorption in sand and marine sediments at 100 kHz amounts 61 and 26 dB/m respectively [Citation26]. Absorption in water is much smaller, and for distances and frequencies considered in this paper, it can be neglected.
In the presence of inhomogeneity, it is possible to represent parameter k2 as , where
is a dimensionless parameter of inhomogeneity (similarly, for the case of absorbing inhomogeneities
and
).
Then, using the Green function formalism, it is possible to obtain the integral expression for the pressure in the considered waveguide:
(3)
(3)
where is the probing field,
is the dyadic Green function,
is the field scattered by inhomogeneities. In solving the direct problem (to determine the field distribution in a medium with inhomogeneities), Equation (3) is considered as a Fredholm integral equation of the 2nd kind, which has the solution:
(4)
(4)
where the resolvent R is represented by Neumann series:
(5)
(5)
Terms of the series in (5) are interpreted as the contribution of single, double, etc. scattering. Green’s functions can be calculated as the expansion of the probing field in the 2D spectrum of plane waves over lateral (transverse) coordinates with the summation of geometric series of multiple-reflected waves [Citation26,27]. This approach allowed us to obtain explicit expressions for the lateral spectrum of Green functions, which are used in the subsequent analysis (see details in Appendix 1). It is worth mentioning that such Green functions can be derived for an arbitrary multilayer medium.
To solve the considered tomography problem, i.e. to retrieve the 3D distribution of by measurements of the scattered field, one should consider expression for
in (3) as a non-linear integral equation of the first kind that can be solved iteratively, beginning with the Born approximation, making the substitution
in (3):
(6)
(6)
It is a Fredholm integral equation of the first kind, so one deals with a well-known ill-posed problem. The solving of such 3D problems is especially difficult. For example, to obtain the solution with the resolution of 100 points for each coordinate, it requires 1012 numbers in the computer memory to store the 6D kernel of the Equation (6). It leads to inevitable limitations of the discretization and, hence, of the achievable resolution. To overcome this difficulty, we use the approach based on the reduction of this equation to a convolution equation over lateral coordinates because such equations can be reduced to 1D equations and solved relative to each pair of their Fourier components separately. Unfortunately, (6) isn’t a convolution equation, and such a reduction, in general, is impossible. Nevertheless, there are statements of this problem, where this transformation is still possible.
The first one is to regard the product as the desired function. However, this desired function is frequency-dependent, and the most promising multifrequency method can’t be based on this approach. The second approach is to use a single plane wave as the probing field
that can be realized in sounding with a remote source operating in a single-mode regime. In this case, the kernel in (6) is formed by the product of the Green function with an exponent that makes it possible to carry out the convolution over the lateral coordinates. Disadvantages of this method are related to frequency limitations of the single-mode operation when the receiver should be placed far away from the source – in the range where the field has a single-mode structure.
The third approach, which has been used in similar electrodynamics problems [Citation29,30], is to use data of the scanning with a source-receiver system at the condition of the unchanging source-receiver relative position. In this case, making the Fourier transform over transversal coordinates in (6), we obtain a 1D integral equation (see details in Appendix 1):(7)
(7)
where spectra of Green functions are determined in Appendix 1,
is the offset of the receiver position relative to the position of the source. For brevity, here and below, we use for Fourier transforms the same notation, so values and their transforms are identified by their arguments. The derived 1D Fredholm integral equation of the first kind should be sequentially solved for each pair of spectral components
relative to the depth profile of the lateral spectrum of inhomogeneities Cs(kx, ky, z′). From the practical point of view, a great advantage of this measurement scheme is the fact that all variations of the signal (received scattered field P1) can be related only to subbottom inhomogeneities.
Within frameworks of this approach, it is possible to propose some corrections beyond the Born approximation, though a direct reduction of the problem to a 1D equation is no longer possible. Indeed, if the solution in the Born approximation is obtained, it can be used for the correction of the probing field in subsequent iterations:
(8)
(8)
Performing 2D Fourier transform over the lateral coordinates, obtain the k-space representation of (8):
(9)
(9)
As you can see, this equation is 3D – in contrast to (7) obtained in the Born approximation. Nevertheless, it can be used for corrections as a 1D equation, if one assumes in the second term on (9). In such a statement, corrections can be obtained with available computers.
It is suitable to note that for inhomogeneities in the far-field zone the solution of the inverse scattering problem leads to fundamental Rayleigh limitations of the achievable resolution. But in the proposed method, where we consider the scheme with near-field measurements, a subwavelength resolution can be realized. As it was mentioned above, to retrieve the desired 3D distribution, data of 2D scanning over transversal coordinates (x, y) should be measured in dependence on a third parameter that provides the depth sensitivity. For that, it is possible to use the multilevel scanning at a single frequency (i.e. the scanning in x-y plane at several altitudes above the bottom) or multifrequency measurements at a single level. The latter method is simpler in use, and, in this statement, the integral Equation (7) can be rewritten in a compact form as:
(10)
(10)
In solving this equation, we use the algorithm [Citation29] based on the Tikhonov’s generalized discrepancy principal [Citation32] for complex-valued functions in Hilbert space (Sobolev’s space). Detailed comments to Tikhonov’s method in application to various problems of physical diagnostics can be found in the book [Citation31]. Let us represent (10) in the operator form:
(11)
(11)
where is a data vector that includes measurement errors. The measure of data errors is determined as
(12)
(12)
where in (10) corresponds to the exact solution Cs(z), Δω is the frequency band of analysis,
is the norm of a function as an element of Hilbert space L2 (space of complex-valued functions, summable with the square). In frameworks of this method, it is necessary to take into account errors in the kernel of this equation that include discretization errors at the numerical solution as well as errors of the Born approximation:
(13)
(13)
where h is a constant, is the numerical approximation of
in (10),
(14)
(14)
where Δz = zmax − zmin is the depth region of analysis. Note, that unlike the error δP, this measure of kernel errors is proportional to the norm of the desired solution. Both kinds of errors can lead to incompatibility of data with the equation to be solved. The corresponding measure of errors related to this incompatibility δμ can’t exceed the sum of two previous error components [Citation32], so it is reasonable to determine it as
(15)
(15)
In this method, the approximate solution minimizes the smoothing functional
(16)
(16)
In the numerical algorithm, the conjugate gradient method was applied to minimize this functional. The regularization parameter α that determines the extent of the solution smoothing is determined from the 1D equation of generalized discrepancy:
(17)
(17)
where is the function that minimizes the functional (16), δ2 is the sum of all three sources discrepancy that includes all three error components [Citation32]:
(18)
(18)
The value of the regularization parameter (and the extent of smoothing) is determined by the level of this error parameter. As δ2 tends to zero, the approximate solution converges to the exact solution in the norm and, according to Sobolev’s including theorem, it converges uniformly in the space C with the maximum modulus as a norm – that is the main advantage of this Tikhonov’s approach. Parameters δh and δμ can be determined in the numerical simulation. Finally, the desired distribution is determined from the solution of (10) in k-space as:
(19)
(19)
Then, the distribution of the sound speed inhomogeneity is easily calculated as . Based on the numerical simulation, it is possible to obtain the estimation of the solution accuracy in the C-norm that is a stronger estimation when compared to L2 or mean square estimations. So, to obtain true information about the solution accuracy, it is enough to study the method for typical or expected targets. The numerical simulation includes:
| (a) | Generation of real-valued non-correlated random gauss-distributed errors δp(x, y, ω)with rms = σ in each point (x,y) of analysis; transformation of errors in the k-space to obtain complex-valued data errors δp(kx, ky, ω) | ||||
| (b) | Production of input data in (11): | ||||
| (c) | Solving the inverse problem to retrieve the 3D distribution of inhomogeneity; | ||||
| (d) | Comparison of initial and retrieved distributions. | ||||
In the solving algorithm, the first term of in (17) should be minimized up to the value of δ2 that includes three components (18). The first is
. It is possible to estimate this parameter as the mean value over multiple realizations of random errors, or to use its calculation for a single realization. However, to build a universal algorithm, it is reasonable to use a universal parameter for each pair (kx, ky). We choose this parameter as the mean value over the k-space region of analysis:
(20)
(20)
that is practically independent on the realization of random errors. In our simulation, we used the pseudorandom number generator with the fixed rms = σ in every random sequence, so . Using the Plancherel theorem, one obtains
. In real measurements, it would be reasonable to estimate these noise parameters by data of measurements in a region without subsurface inhomogeneities – outside the studied place.
In our case, when we know the exact formula for the kernel K of the integral equation, the second parameter is related to the level of discretization, and we minimize this parameter gradually increasing the discretization level to satisfy the condition
. The necessary level of discretization depends on target parameters (its permittivity, sizes, shape, depth). At a scarce discretization, retrieved images can be smoothed, so we used the numerical simulation to satisfy the mentioned condition for our test targets. As a result, it was obtained that the discretization 80 × 80 × 80 in the region of analysis 40 × 40 × 20 m3 gives about the same results as that at 40 × 40 × 40 m3. According to [Citation32], the third part of δ2 (measure of incompatibility) satisfies
. So, neglecting the contribution of δh, we obtain the estimation
that has been used in analysis.
The frequency range of analysis has been determined so that the near-field distribution changed significantly over a sounded object. This condition provides the depth sensitivity of measurements. The number of frequencies has been chosen so that the difference of signal variations at neighbour frequencies exceeds the error level. It is clear that this number increases with the decrease of errors.
Here it should be noted that the inverse problem is simplified for quite a typical case of solid targets composed of a homogeneous material – in this case it is enough to determine the shape of their boundaries. However, it is impossible to obtain the exact positions of boundaries for such targets from (19) – even neglecting retrieval errors – because it is well-known that step-functions can’t be expressed exactly nearby points of gradient discontinuity by arbitrary long Fourier series that represent (19). In such points, the Dini test for pointwise convergence of Fourier series is unfilled, and results are distorted by the Gibbs effect. So, if it is known, a priori that we deal with such a target, the problem can be solved rigorously using our approach.
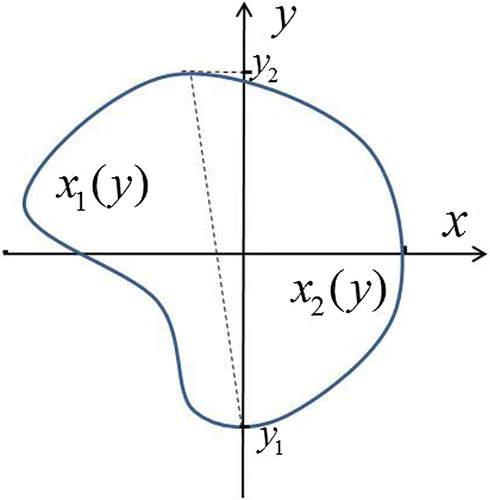
When it is known a priori that , the holography problem (i.e. the problem of the target shape retrieval) can be solved using k-space solution Cs(κx, κy, z) of (7). For that, let us represent the shape of a simple connected target by two single-valued functions x1(y, z), x2(y, z) (see in Figure ).
Figure 2. Boundaries of a target in the section z = const represented by functions x1(y, z), x2(y, z).
In this case, retrieved k-space spectrum of a target can be written as a Fourier transform with finite limits:
(21)
(21)
Then, making the inverse Fourier transform of (21) over ky
(22)
(22)
obtain (after change y′ → y) the complex-valued transcendent equation:
(23)
(23)
that is equivalent to the system of two real-valued equations. Then, the desired shape of the target expressed by two functions x1(y, z), x2(y, z) is obtained from the solution of (23). It should be mentioned that this equation is overdetermined: it can be solved at each value of kx that makes it possible to optimize the solution. This optimization could be based on the optimal choice of kx or on the solving (23) as a system of equations with different values of kx. Depending on available conditions, the value of may be known a priori, or obtained from tomography results (19), or from the solution of (23) as an expanded system with some extra equations with different values of kx. It is clear that similar equation can be written for the shape expressed by functions y1(x,z), y2(x,z).
3. Numerical simulation
In numerical simulation, we consider the case of the point source of the probing field because small aperture sources (that should be used in near-field sounding) have about the same k-space spectrum of the emitted field as the point source. The probing field of the point source is expressed by the Green function
. In this case, the transversal spectrum (7) of the scattered field measured in the point
is expressed as:
(24)
(24)
In our simulation, we consider a waveguide water layer with depth h = 20 m and parameters above the liquid half-space with
that simulates mud bottom deposits (see in Figure ). In Figure , distributions of the probing field amplitude (relative to its maximum value Pmax) are shown in the vertical section at two frequencies in the band of analysis.
Figure 3. Distributions of the probing field for the source at
in the vertical section
at frequencies 100 (left) and 200 Hz (right).
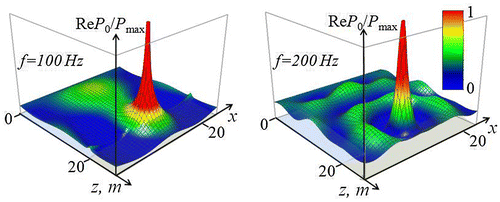
From these images of two field distributions, it is seen that the near zone penetrates much deeper into the bottom for the source at the frequency 100 Hz than for the source at 200 Hz. This frequency dependence of the near field penetration explains the depth sensitivity of multifrequency sounding of targets in the near zone. It is also seen that in both cases, the range of penetration of the strong field is much shorter than the wavelength. This property provides a subwavelength sensitivity of near-field sounding.
The tomography method for distributed inhomogeneities is simulated with two 3D gauss functions with parameters: Cm1 = Cm2 = 0.25, zm = 30 m, σx1 = 7.7 m, σx2 = 13.7 m, σy1 = 13.0 m, σy2 = 6.0 m, σz1 = 6.0 m, σz2 = 3.0 m at 12 m distance between centres. The source was located at z0 = 19.9 m; the receiver – at zr = 19 m (at 0.1 m and 1 m above the media interface, respectively). Data of ‘measurements’ include calculated complex amplitudes of the scattered field (with added random errors) that simulate results of the scanning over lateral coordinates in the range
at five frequencies in the region 33–165 Hz. In Figure , corresponding images of calculated 2D distributions of
(the relation of the scattered field amplitude to its maximum value) are demonstrated.
Figure 4. Distributions of the scattered field at five frequencies used in analysis: f1 = 33 Hz, f2 = 66 Hz, f3 = 99 Hz, f4 = 132 Hz, and f5 = 165 Hz.

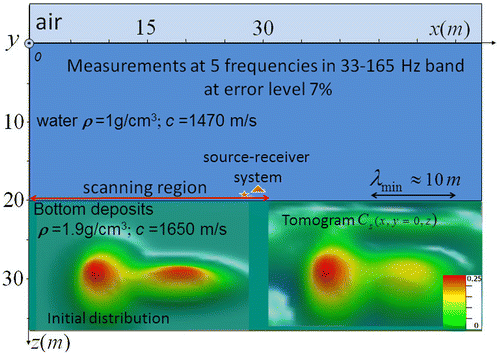
One can see that the image of the scattered field is rather smoothed at the lowest frequency f1. Then, at the frequency f2, it resembles simulated targets; at higher frequencies the structure of images becomes more complicated. To simulate the described tomography method, ‘data’ at five frequencies are used to solve the inverse problem in the k-space (24); then its solution Cs(kx, ky, z) has been transferred in (19) to Cs(x, y, z) (in Cartesian coordinates). In Figure , results of the tomography simulation are demonstrated for simulated gauss inhomogeneities in the vertical section Cs(x, y = 0, z) at the level of random errors of 7%.
Figure 5. Measurements scheme and simulation results of multifrequency tomography (vertical section). Initial distribution of inhomogeneities is shown in the left part of bottom layer, tomogram – in the right part.
In Figure , tomography results obtained at two values of simulated errors are shown in the horizontal section at the depth of maxima (at zm = 30 m).
Figure 6. Simulation of tomography (horizontal section in the range ).
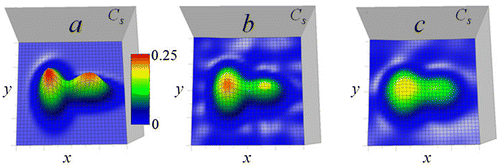
It is seen in Figures and that the applied algorithm works quite good. Results demonstrate that the left inhomogeneity (broader in z-direction) is retrieved better than the right one because corresponding small-scale near-field components of the probing field (that provided the depth resolution) are significantly faded at depth on maxima. The comparison of tomogram details to the shortest wavelength in analysis (shown by the arrow in Figure ) demonstrates the subwavelength resolution of proposed method. In Figures and , it is possible to see a good retrieval quality at the data error level of 7%, however, the general shape of inhomogeneities is still seen even at errors of 35% (in Figure ). At the error of 7%, the value of Cs in the left maximum amounts about 0.8 Cm. It is seen that retrieval errors decrease with simulated data errors; however, we have obtained also that the further convergence continues only at the simultaneous increase of the number of frequencies in analysis that should be chosen in a broader frequency band.
The case of solid objects with sharp boundaries is especially interesting because it seems as more typical. In this case, the solution of the inverse problem in k-space obtained from integral Equation (24) can be used to determine also the shape of such targets from the obtained non-linear Equation (23). In Figure , one can see results of the numerical simulation, where the k-space distribution Cs(kx, ky, z′) has been retrieved from the solution of (24) for such an object (parallelepiped with Cs = const = 0.25 with sizes ∆x = 5 m, ∆y = 12 m, ∆z = 6 m at z = 25 m). Results are given for the relation of real part of the complex-valued spectrum to its maximal value CSmax at z = 25 m (the depth position of the rectangular target).
Figure 7. Numerical simulation of k-space tomography method for a solid object: retrieval of the transversal spectrum of the parallelepiped target from the solution of (24) at the error level of 2%. Left, transversal spectrum () of simulated target shown in the spectral range
; right, its retrieved spectrum.
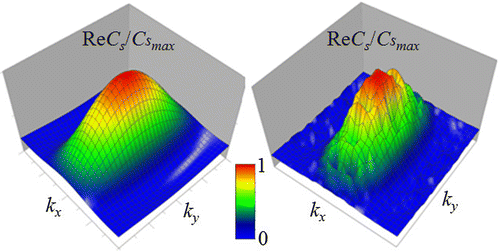
Comparing initial and retrieved images in Figure , one can see the influence of random errors on the retrieval quality of that is used in the further analysis to obtain holography images demonstrated below in Figures and . The error level in the integral metric L2 amounts about 10%, so we have some amplification of the error’s level when compared to that of input data. It is a common property of ill-posed problems [Citation31]. Using k-space distributions, shown in Figure , holography images of the parallelepiped target have been obtained from the Equation (23) for this target at z = 25 m and, similarly, for the target at z = 30 m. In Figure , the shape of these targets is visualized as two functions y1(x, z), y2(x, z).
Figure 8. Numerical simulation of holography method for a parallelepiped object.
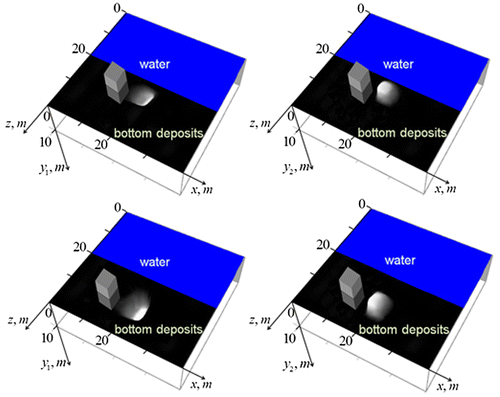
Figure 9. Numerical simulation of holography method for a parallelepiped object (another viewpoint). Top row: target at z = 25 m.
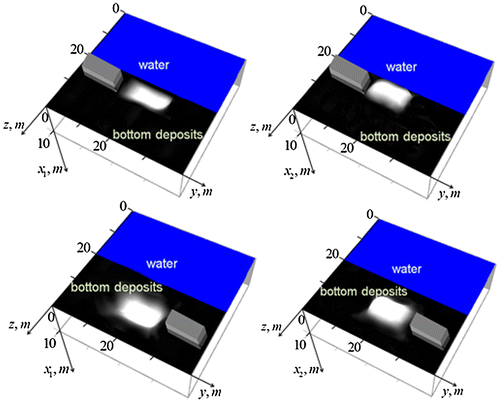
In Figure , holography images of these targets are shown from a different viewpoint.
Results demonstrate a good quality of the retrieval – one can easily identify the target’s shape and determine its sizes and depth position with reasonable accuracy. Based on such numerical simulations, we found a way for the optimization of the solution of (23) using the freedom in the choice of the kx value. It was obtained that the optimal value is kx ≅ 2π/L, where L is a typical scale of a target. At the optimal value, one obtains the most sharp holography images, so the process of optimization is similar with the optical focusing.
In Figure , possibilities of the method are demonstrated for spherical targets.
Figure 10. Numerical simulation of holography method for spherical objects.
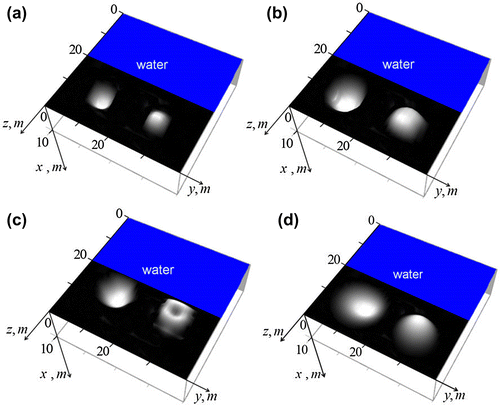
Results demonstrate somewhat better quality for spherical targets in Figure (a) and (b) when compared to the case of parallelepiped targets in Figures and . Also, the smoothed spherical surface seems less distorted than sharp-edged shapes. In Figure (c), the retrieved image of the spherical surface with a cavity is shown. The retrieved image of this cavity is somewhat distorted that demonstrates a typical property of ill-posed problems that it is more difficult to retrieve more complicated distributions [Citation31].
In Figure (d), one can see retrieved images in an absorbing medium with for the same target as in Figure (b). At that, the skin-depth
amounts 7.5 m at the highest frequency 165 Hz; at the lowest frequency 33 Hz this medium is almost transparent. Comparing these images with results for the medium without absorption in Figure (b), one can see a smoothing effect related to the signal fading.
It is important to note that similar results have been obtained for tomography and holography in waveguides with depth from 20 cm up to 200 m if all sizes (depths of targets, their sizes, wavelengths of analysis) change proportionally. So, for waveguide depth h = 20 cm, similar results can be obtained using measurements in 3.3–16.5 kHz frequency band.
Finally, we note a possibility to modify this method that is important to practical applications. As it was found in similar electromagnetic diagnostics [Citation30], it appeared difficult to discern sounded subsurface objects in images of the scattered signal at separate frequencies (such, as shown in Figure ) against the noise produced by the surface scattering. Nevertheless, it was found that it is possible to obtain much better images of subsurface targets, using the transformation of multifrequency data to the synthesized pseudopulse.
(25)
(25)
It can be represented in dependence on the effective depth parameter zs as P1(x, y, zs) = P1(x, y, t = −2zs/c1) (taking into account the sound velocity in a medium and the signal path to and from a scattering element). At that, subsurface inhomogeneities could be clearly seen in visualised 2D images of . The strong maximum of
observed in every point of the scanning region will mark the value of zs that corresponds to the surface scattering. The same transformation
can be applied to the Equation (10) (compact form of (7)):
(26)
(26)
where P1(kx, ky, zs) = P1(kx, ky, t = −2zs/c1). The same method, as above, can be applied to solve this equation.
In the case of diagnostics that uses real pulse measurements, one has the problem related to calculations of necessary reflection coefficients and Green functions that are, in general, unknown for time-dependent signals. It is possible overcome this problem by the Fourier transformation of the signal to frequency domain. Then, one can apply the theory for multifrequency diagnostics, developed here.
4. Tomography and holography problems for inhomogeneities of density
In the case of inhomogeneities of density, the wave equation for complex amplitudes of a harmonic signal is written [Citation26] as:
(27)
(27)
It is possible to apply the same method, as above, considering the inhomogeneity as an effective source of sound. Then, using the Green function for homogeneous media, instead of (6), obtain the generalized equation for the scattered field in the Born approximation:
(28)
(28)
where is the perturbation of density
. It is possible to take by parts the term related to the perturbation:
(29)
(29)
Of course, it is difficult to solve problem for inhomogeneities of sound and density simultaneously. However, it is still possible when these inhomogeneities are not independent, for example, when we know the target material or components of a mixture. This is just the proper condition for the above-considered holography diagnostics of solid targets. For the scheme of sounding with the fixed source-receiver system, (29) is a convolution equation over transversal coordinates that it is possible to solve in the same way as (6) – transforming it to the 1D integral equation in k-space.
Let us assume for a solid target , where the material parameter s is a constant. Then it is possible to rewrite (29) as
(30)
(30)
The Fourier transform over transversal coordinates x and y reduces (30) to a 1D integral equation of the corresponding inverse problem in the k-space:
(31)
(31)
Then, in the same way as in (21)–(23), obtain the equation of holography that determines the shape of a target by two functions x1(y, z) and x2(y, z):
(32)
(32)
where is the a priori known density of the target,
. Therefore, holography results demonstrated in Figures are valid for the proposed near-field diagnostics even in this, more generous case.
5. Conclusion
A new method of near-field multifrequency tomography and holography of subbottom inhomogeneities is developed and studied in the numerical simulation. The developed approaches can be applied to diagnostics of low-contrast under-bottom targets, such as, for example, archaeology artefacts. Similar near-field approaches can be developed in sound defectoscopy and diagnostics of living tissues.
Funding
This work was supported by the Russian Foundation for Basic Research [grant number 17-07-00488]; partly by grant of Ministry of education and science of Russian Federation under Agreement on August 27, 2013 No. 02.B.49.21.0003 between Ministry of education and science and Lobachevsky State University of Nizhny Novgorod and within frameworks of the state plan in the region of scientific activity (the project part code No. 1727).
Disclosure statement
No potential conflict of interest was reported by the authors.
References
- Medwin H, Clay CS. Fundamentals of acoustical oceanography. Boston (MA): Academic; 1998.
- Blondel P, Murton BJ. Handbook of seafloor sonar imagery. Chichester: Wiley; 1997.
- Penrose JD, Siwabessy PJW, Gavrilov A, et al. Acoustic techniques for seabed classification. Technical Report 32, Cooperative Research Centre for Coastal Zone Estuary and Waterway Management. Indooroopilly, Queensland; 2005.
- Brown CJ, Blondel P. Developments in the application of multibeam sonar backscatter for seafloor habitat mapping. Appl Acoust. 2009;70:1242–1247.10.1016/j.apacoust.2008.08.004
- Sternlicht DD, de Moustier CP. Remote sensing of sediment characteristics by optimized echo-envelope matching. J Acoust Soc Am. 2003;114:2727–2743.10.1121/1.1608019
- Fonseca L, Brown C, Calder B, et al. Angular range analysis of acoustic themes from Stanton Banks Ireland: a link between visual interpretation and multibeam echosounder angular signatures. Appl Acoust. 2009;70:1298–1304.10.1016/j.apacoust.2008.09.008
- Amiri-Simkooei AR, Snellen M, Simons DG. Riverbed sediment classification using multi-beam echo-sounder backscatter data. J Acoust Soc Am. 2009;126:1724–1738.10.1121/1.3205397
- Lamarche G, Lurton X, Verdier A-L, et al. Quantitative characterisation of seafloor substrate and bedforms using advanced processing of multibeam backscatter – application to Cook Strait, New Zealand. Cont Shelf Res. 2011;31:S93–S109.10.1016/j.csr.2010.06.001
- Snellen M, Eleftherakis D, Amiri-Simkooei A, et al. An inter-comparison of sediment classification methods based on multi-beam echo-sounder backscatter and sediment natural radioactivity data. J Acoust Soc Am. 2013;134:959–970.10.1121/1.4812858
- Le Bas TP, Huvenne VAI. Acquisition and processing of backscatter data for habitat mapping-Comparison of multibeam and sidescan systems. Appl Acoust. 2009;70:1248–1257.10.1016/j.apacoust.2008.07.010
- Siemes K, Snellen M, Amiri-Simkooei AR, et al. Predicting spatial variability of sediment properties from hydrographic data for geoacoustic inversion. IEEE J Oceanic Eng. 2010;35:766–778.10.1109/JOE.2010.2066711
- Micallef A, Le Bas TP, Huvenne VAI, et al. A multi-method approach for benthic habitat mapping of shallow coastal areas with high-resolution multibeam data. Cont Shelf Res. 2012;39–40:14–26.10.1016/j.csr.2012.03.008
- Eleftherakis D, Amiri-Simkooei A, Snellen M, et al. Improving riverbed sediment classification using backscatter and depth residual features of multi-beam echo-sounder systems. J Acoust Soc Am. 2012;131:3710–3725.10.1121/1.3699206
- Buscombe D, Grams PE, Kaplinski MA. Characterizing riverbed sediment using high-frequency acoustics: 1. Spectral properties of scattering. J Geophys Res Earth Surf. 2014;119:2674–2691.10.1002/2014JF003189
- Buscombe D, Grams PE, Kaplinski MA. Characterizing riverbed sediment using high-frequency acoustics: 2. Scattering signatures of Colorado River bed sediment in Marble and Grand Canyons. J Geophys Res Earth Surf. 2014;119:2692–2710.10.1002/2014JF003191
- Eleftherakis D, Snellen M, Amiri-Simkooei A, et al. Observations regarding coarse sediment classification based on multi-beam echo-sounder’s backscatter strength and depth residuals in Dutch rivers. J Acoust Soc Am. 2014;135:3305–3315.10.1121/1.4875236
- Tang Q, Lei N, Li J, et al. Seabed mixed sediment classification with multi-beam echo sounder backscatter data in Jiaozhou Bay. Mar Georesour Geotechnol. 2015;33:1–11.10.1080/1064119X.2013.764557
- Schock SG, LeBlanc LR, Mayer LA. Chirp subbottom profiler for quantitative sediment analysis. Geophysics. 1989;54:445–450.10.1190/1.1442670
- Mindell DA, Croff K. Deep water, archaeology and technology development. MTS J. 2002;36:13–20.
- Foley BP, Mindell DA. Precision survey and archaeological methodology in deep water. ENALIA J. 2002;6:49–56.
- Davis A, Haynes R, Bennell J, et al. Surficial seabed sediment properties derived from seismic profiler responses. Mar Geol. 2002;182:209–223.10.1016/S0025-3227(01)00235-3
- Kim HJ, Chang JK, Jou HT, et al. Seabed classification from acoustic profiling data using the similarity index. J Acoust Soc Am. 2002;111:794–799.10.1121/1.1433812
- Walter DJ, Lambert DN, Young DC. Sediment facies determination using acoustic techniques in a shallow-water carbonate environment, Dry Tortugas, Florida. Mar Geol. 2002;182:161–177.10.1016/S0025-3227(01)00233-X
- McGee TM. High-resolution marine reflection profiling for engineering and environmental purposes. Part A: acquiring analogue seismic signals. J Appl Geophys. 1995;33:271–285.10.1016/0926-9851(95)90046-2
- Stoker MS, Pheasant JB, Josenhans H. Seismic methods and interpretation. In: Davies TA, Bell T, Cooper AK, et al., editors. Glaciated continental margins: an atlas of acoustic images. London: Chapman and Hall; 1997:9–26.
- Brekhovskikh L, Lysanov Y. Fundamentals of ocean acoustics. In: Felsen L, editor. Springer Series in Electrophysics. Vol. 8. Berlin: Springer-Verlag; 1982. Available from: http://link.springer.com/book/10.1007%2F978-3-662-02342-610.1007/978-3-662-02342-6
- Brekhovskikh LM, Godin OA. Acoustics of layered media. Berlin: Springer; 1990.10.1007/978-3-642-52369-4
- Gaikovich KP. Subsurface near-field scanning tomography. Phys Rev Lett. 2007;98:183902.10.1103/PhysRevLett.98.183902
- Gaikovich KP, Gaikovich PK. Inverse problem of near-field scattering in multilayer media. Inverse Prob. 2010;26:125013.10.1088/0266-5611/26/12/125013
- Gaikovich KP, Gaikovich PK, Maksimovitch YS, et al. Pseudopulse near-field subsurface tomography. Phys Rev Lett. 2012;108:163902.10.1103/PhysRevLett.108.163902
- Gaikovich KP. Inverse problems in physical diagnostics. New York (NY): Nova Science; 2004.
- Tikhonov AN, Goncharsky AV, Stepanov VV, et al. Numerical methods for the solution of ill-posed problems. Dordrecht: Kluwer; 1995.10.1007/978-94-015-8480-7
- French WS. Two‐dimensional and three‐dimensional migration of model‐experiment reflection profiles. Geophysics. 1974;39:265–277.10.1190/1.1440426
Appendix 1
Direct problem
To solve the direct problem, it is necessary to find the Green function in the Equation (2) with taking into account, the boundary conditions in the waveguide, i.e. to solve the problem for the point source located in the point
:
(1A)
(1A)
Then, the solution of (2) with the source () is given by
(2A)
(2A)
Green functions in any multilayer medium are obtained from the Green function in a homogeneous medium that is expressed by the spherical wave:
(3A)
(3A)
Following [Citation26,27], we use the plane wave expansion of (3A):
(4A)
(4A)
This Green function can be considered as the 2D inverse Fourier transform over differences of its lateral spectrum:
(5A)
(5A)
To obtain Green functions in a multilayer medium, it is necessary to match fields on boundaries of layers taking into account boundary conditions. For that, it is possible to express the field in each layer as a sum of multiply reflected plane waves [Citation26,27]. For the considered problem of tomography in the three-layer medium (Pekeris waveguide), it is necessary to obtain fields in the medium 1 from the source located in the medium 2 and fields in the medium 2 from the source located in the medium 1, i.e. Green functions G21, G12:
(6A)
(6A)
(7A)
(7A)
where , and reflection and transmission coefficients
from ith layer to jth layer are determined by the method of input impedances in [Citation26,27] as
(8A)
(8A)
where . In the case considered in this paper, the reflection coefficient on the water–air interface is R23 = −1. Expressions (6A), (7A) are also expressed as inverse Fourier transforms of their transversal spectra, used in formulas (7), (24) as:
(9A)
(9A)
(10A)
(10A)
At k1,2 > κ⊥ these spectra describe the wave (propagating) part of a field; at k1,2 < κ⊥ they correspond to near-field (evanescent) components that are sharply fading from a source providing a subwavelength resolution of the proposed diagnostics in the near zone. In this diagnostics, the frequency dependence of the extinction depth of evanescent waves is in use to obtain a subwavelength resolution – unlike the far-field technique [Citation18–25] in hydroacoustic sounding and in the seismic sounding (for example, in the wave migration technique [Citation33]) that uses the time delay as the depth sensitivity parameter.
Inverse problem
Let us consider the case when the scattering inhomogeneities are placed under the bottom in the medium 1, whereas the source-receiver system is located in the medium 2 (water). Then, the scattered field measured in the medium 2 is determined as:
(11A)
(11A)
It is possible to simplify the problem using the 2D Fourier transform to obtain the 1D integral equation for the depth profile of the transversal spectrum
(12A)
(12A)
However, in general, (11A) isn’t a convolution equation. For that, the probing field should depend on differences of transversal coordinates, i.e. it can be expressed as P0 = P(x − x′, y − y′, z, z′). This condition can be fulfilled if the relative source-receiver position is unchanged in the scanning, i.e. the offset of the receiver position relative to the position of the source . Then, the probing field can be expressed as
(13A)
(13A)
or, using the k-space representation of the Green function (9A), as
(14A)
(14A)
After the change of variables , obtain the expression
(15A)
(15A)
where the dependence on differences of transversal coordinates is given explicitly.
Finally, making the 2D inverse Fourier transform over transversal coordinates in (11A)
(16A)
(16A)
obtain the desired 1D integral equation:
(17A)
(17A)
