
 ?Mathematical formulae have been encoded as MathML and are displayed in this HTML version using MathJax in order to improve their display. Uncheck the box to turn MathJax off. This feature requires Javascript. Click on a formula to zoom.
ABSTRACT
In this work, the adjoint to the transport operator is used to estimate the spatial distribution of an isotropic neutral particles source in a homogeneous one-dimensional medium, from readings of internal detectors. An analytical discrete ordinates formulation, the ADO method, is applied to derive a spatially explicit solution for the adjoint flux. Simulations are performed for reconstructing Gaussian and piecewise localized sources. Numerical results indicate that the source estimates may be considered satisfactory although scalar fluxes are reconstructed more precisely.
1. Introduction
Several problems of practical interest in science and engineering require the solution of inverse particle transport problems. Among them, we may cite non-destructive material identification [Citation1–Citation4] and nuclear safety [Citation5–Citation7]. In this sense, a series of different approaches can be found in the literature on this subject [Citation8]. For instance, in source reconstruction problems, typical in safety analysis, either readings on the boundaries [Citation1,Citation3,Citation6,Citation9,Citation10] or in the interior of the domain [Citation5,Citation11] is considered in order to estimate the source distribution, usually approximated in given basis functions [Citation1,Citation3,Citation6,Citation9,Citation10]. The adjoint to the transport operator is an additional tool for the solution of such problems, either in iterative schemes, when computing gradients [Citation1,Citation6,Citation12], or to estimate detector readings in a source–detector configuration [Citation5,Citation13].
Our goal, in this paper, is the source term reconstruction in the particle transport equation. In this way, we estimate the projection coefficients of the source function expansion in a given basis, using measurements of particle detectors placed within the domain. The detectors may be distributed over the entire domain as well as concentrated in specific regions. Effects of noise on the measurements are also taken into account in our analysis. We consider that the reconstructed source may be approximated by sectionally constant functions defined over the physical domain. Such a choice leads to low-order systems for the minimization procedure and to simpler implementation schemes. Using the same basis functions, we have successfully reconstructed polynomials and piecewise sources, assuming the basis functions support was defined over intervals where the original source had no discontinuities [Citation14]. Here, when defining the basis function support, no conditions are imposed with respect to possible discontinuities of the source. In addition, thinking of some of the previous applications mentioned, we extend our analysis to a wide class of source functions, trying to represent the occurrence of peaks of localized intensity.
We assume all physical properties of the medium and incoming fluxes at the boundaries are given, then we follow Hykes and Azmy [Citation5] to derive, using the adjoint of the transport equation, a linear model that relates the detector readings with the coefficients of our expansion. The coefficients are estimated by the minimization of the 2-norm of the discrepancy between the numerical readings and the observed ones. As an additional contribution of this paper, we derive analytical expressions with regard to the spatial variable for the matrix entries of the minimization problem, a consequence of the use of the Analytical Discrete Ordinates (ADO) method for solving the adjoint transport equation [Citation15]. Such feature is expected to contribute with computational time reduction and solution accuracy. The ADO method is a fast, accurate and concise variation of the classical Chandrasekhar’s discrete ordinates method ( method) [Citation16], which provides spatially closed-form solutions to the discrete ordinates approximation of the transport equation [Citation17,Citation18] and its adjoint [Citation15]. More recently the ADO method has been successfully extended, with aid of nodal techniques, to solve bi-dimensional transport problems [Citation19,Citation20], to which the present derivations may be associated later.
In this work, we consider monoenergetic, slab-geometry transport problems with arbitrarily high anisotropic scattering. As boundary conditions, we assume either known incoming fluxes or reflective boundary conditions. The medium is composed of materials with homogeneous physical properties, although simple modifications would allow us to treat heterogeneous media [Citation15] with sectionally constant physical properties.
The remainder of this paper is organized such that: in Section 2, we briefly discuss the transport operator and relations with its adjoint operator; in Section 3, we present the source reconstruction strategy; in Section 4, we summarize the ADO methodology for obtaining a solution for the one-dimensional discrete ordinates adjoint transport equation and deduce analytical expressions to the matrix related to the inversion problem derived in Section 3 and in Section 5, we apply the source reconstruction strategy in two test problems aiming the reconstruction of a Gaussian and a localized piecewise constant source. To conclude, a few remarks and suggestions for future work are discussed in Section 6.
2. Mathematical formulation
Let us suppose that an isotropic source of neutral particles S lies within a plane-parallel medium, a slab of optical thickness . Thus, the monoenergetic distribution of particles within the slab may be modelled by the transport equation
(1)
(1)
with being the transport operator, here written as [Citation21,Citation22]
(2)
(2)
where is the angular flux of neutral particles, which in this work, we assume to be symmetrical with respect to the azimuthal variable and
is the cosine of the polar angle measured from the positive z-axis, with
. Besides that, we represent the mean number of neutral particles emerging from collisions by c and we set
as the coefficient of the lth term in the Lth order expansion of the scattering law in terms of Legendre polynomials
. Later on, in this text, we mention specific forms of defining those coefficients, depending on the applications. In fact, thinking of general applications of the particle transport equation, even the unknown
and the parameter c may named as alternative quantities (angular intensity, albedo, respectively, for instance). Additionally, we prescribe boundary conditions related to more general problems in transport theory [Citation21,Citation23], written as
(3a)
(3a)
(3b)
(3b) for
, with known incoming fluxes
and
at the boundaries, and reflection coefficients
,
.
Figure 1. Neutral particle detector placed within the slab.
Before we proceed, it is useful to define an inner product on the phase space as
(4)
(4)
for integrable functions, since, according to the literature [Citation21,Citation24], if we consider a detector of neutral particles, placed within a slab (see Figure ), then
(5)
(5)
is the detector response due to particles migrating in all directions within segment . In our (dimensionless) formulation,
is the ratio between the macroscopic absorption cross-section of the detector and the total cross-section of the medium. For a fixed contiguous region
, we define
(6)
(6)
For every , with
a constant value, we refer here as absorption parameter.
Alternatively, an efficient approach to determine the detector response r is given by the solution of the adjoint transport problem, which may be derived by assuming the existence of a smooth function , which we refer to as the adjoint angular flux. We multiply
by
, then we use the inner-product defined in Equation (Equation4
(4)
(4) ), which yields, after some mathematical manipulation, the result [Citation21,Citation24]
(7)
(7)
with defined as
(8)
(8)
and , the adjoint transport operator, as [Citation21,Citation24]
(9)
(9)
Here is the adjoint angular flux of particles, and the remaining quantities are defined as in Equation (Equation2
(2)
(2) ).
At this point, we write the adjoint transport equation as(10)
(10)
for a certain adjoint source yet to be chosen. If the adjoint source is chosen to be equal to
, then we may rewrite Equation (Equation5
(5)
(5) ) as
(11)
(11)
using Equation (Equation7(7)
(7) ), thus, allowing us to compute the detector response using the adjoint angular flux. Furthermore, since Equation (Equation8
(8)
(8) ) depends on
and
only at the boundaries of the slab, the practical choice of boundary conditions to the adjoint angular flux problem
(12a)
(12a)
(12b)
(12b) results in the simplification of Equation (Equation8
(8)
(8) ) to [Citation15]
(13)
(13)
We remark that, since the adjoint angular flux does not depend on S, r can be computed by Equation (Equation11
(11)
(11) ) for any S, given
and
. Thus, if one changes source distribution S and the prescribed boundary conditions
and
, Equation (Equation11
(11)
(11) ) can still be used to evaluate r, as long as the detector is not changed or displaced. On the other hand, the use of Equation (Equation5
(5)
(5) ) requires the transport equation to be solved every time the source distribution and/or the incoming fluxes at the boundaries are changed. This feature along with the bilinearity of Equation (Equation4
(4)
(4) ) allow us to deal with the linear inverse problem for the source reconstruction, as we will discuss in the next section.
3. Source reconstruction strategy
First of all, we point out some aspects about the configuration of our reconstruction problem. Following Hykes and Azmy [Citation5],
| (i) | a set of D particle detectors is placed within the slab | ||||
| (ii) |
| ||||
| (iii) | for each detector, the adjoint angular flux that solves | ||||
| (iv) | the original source of neutral particles S may be approximated by the projection of S onto a linear space with known basis function | ||||
with constants , targets of our source reconstruction process, yet to be found. Under these assumptions, we can express the detector response due to neutral particles migrating in all directions within the ith detector region as
(15)
(15)
for . We consider the vectors
,
, and the matrix
, such that
(16)
(16)
Then, we are able to rewrite Equation (Equation15(15)
(15) ) in a matrix form as
(17)
(17)
with . At this point, we use Equation (Equation17
(17)
(17) ) to write our inverse problem as a minimization problem of the discrepancy between the numerical readings
and observed data. For this, we first suppose the existence of noisy measurements
, computed by numerical simulation or through physical experimentation. In this way, the coefficients, components of the vector
in Equation (Equation17
(17)
(17) ), may be estimated by the minimization of the objective function [Citation5]
(18)
(18)
with ,
, where
is the classical Euclidean in
.
At this point, basis functions for the reconstruction space must be fixed. In this work, we only consider sectionally constant approximations to the neutral particles source S. Thus, given(19)
(19)
a partition of the domain, basis functions are defined as [Citation5](20)
(20)
for .
We remark that the function space generated by the basis functions in Equation (Equation20(20)
(20) ) may be too poor for representing the true space of the particle source S, in such way that the well-known ill-posedness of inverse problems might negatively affect the quality of the reconstruction. Moreover, we found in our numerical tests that the identifiability [Citation25] of our inverse model is
, leading to difficulties to uniquely determine the coefficients. We treat these issues here by searching for Tikhonov regularized solutions for the minimization problem defined by the objective function in Equation (Equation18
(18)
(18) ). In fact, we search for solutions that minimize the objective function [Citation26]
(21)
(21)
where is the Tikhonov’s regularization parameter, here chosen by the Morozov’s discrepancy principle [Citation26]. We consider, in this work, three choices for the Tikhonov’s regularization matrix
:
, the identity matrix in
, which selects solutions of minimal norm;
,
(22a)
(22a)
which selects solutions that minimizes and
(22b)
(22b)
which minimizes . In fact,
and
are associated with finite difference approximations of the first and the second derivatives of the source term, respectively.
In the next section, before proceeding to the numerical simulations, we describe the Analytical Discrete Ordinates method (ADO), and we use to solve the adjoint to the transport problem and to derive explicit expressions to Equation (Equation16(16)
(16) ).
4. An analytical solution of the discrete ordinates adjoint transport equation
The inversion strategy we previously described requires the adjoint transport equation to be solved a number of times equal to the number of detectors. A fast, concise and accurate approach is the Analytical Discrete Ordinates (ADO) method, originally derived by Barichello and Siewert [Citation17,Citation23] for solving the discrete ordinates approximation of the transport equation. The extension of such approach for solving the adjoint one-dimensional equation is straightforward, and it was done by Pazinatto et al. [Citation15,Citation27].
Since Equation (Equation10(10)
(10) ) is a linear equation, we write the adjoint angular flux
as the solution
of the homogeneous equation
, plus any particular solution
of the non-homogeneous equation. For the sake of simplicity, we suppose that all physical parameters in the equation are constant. Otherwise, the domain is partitioned in regions of constant parameters, and we impose continuity conditions on the adjoint angular flux at the interfaces of contiguous regions.
4.1. Homogeneous solution
We start by rewriting the homogeneous version of Equation (Equation10(10)
(10) ) in the form [Citation15]
(23)
(23)
by changing the integration variable from to [0, 1], then applying the Legendre polynomials rule
[Citation28]. Furthermore, we consider a set of N nodes and weights
of a quadrature scheme for the interval [0, 1], then the angular dependence on Equation (Equation23
(23)
(23) ) is discretized in the directions
as
(24)
(24)
for . Moving on, we seek for spectral solutions for Equation (Equation24
(24)
(24) ) in the form
(25)
(25)
where is an arbitrary constant. Then, we substitute Equation (Equation25
(25)
(25) ) into Equation (Equation24
(24)
(24) ), to obtain
(26)
(26)
for . After a series of algebraic operations carefully described in Pazinatto et al. [Citation15], we can write the homogeneous solution to the adjoint transport equation as
(27)
(27)
where and
with eigenfunctions defined by
(28a)
(28a)
with , where
and
are such that
(28b)
(28b)
with written as
(28c)
(28c)
and(28d)
(28d) Here
,
and
is the identity matrix in
.
4.2. Particular solution
For the special case where is a constant source, we may choose a constant function as particular solution to Equation (Equation10
(10)
(10) )
(29)
(29)
which can easily be verified by direct substitution into the equation, as long as the denominator is different from zero. To deal with more general cases, when is not a constant, we followed the approach developed in Ref. [Citation29] based on the use of Green’s functions and extended that to the adjoint transport equation [Citation14]. In this case, we express the particular solution in terms of the eigenfunctions
defined in Equation (Equation28a
(28a)
(28a) )
(30)
(30)
where, for an isotropically defined source ,
(31a)
(31a)
and(31b)
(31b)
with(31c)
(31c)
We remark that this particular solution formulation allows us to deal more easily with source terms defined as piecewise functions, without imposing any restrictions on the domain partitions. Besides, it reduces the order of the linear system to be solved, in comparison with the use of the constant particular solution, previously mentioned. However, the evaluation of the spatial integrals in Equations () may be costly depending on the quadrature scheme. Such problem may be suppressed when analytical expressions for the integrals are available.
4.3. The detector response: an analytical approach
Once the solution of the discrete ordinates approximation of the adjoint transport equation is established, we are able to use Equations (Equation13(13)
(13) ) and (Equation16
(16)
(16) ) to compute the vector
and the matrix
in Equation (Equation21
(21)
(21) ). The evaluation of the relevant integrals may be performed using our angular quadrature scheme and defining additional spatial quadrature scheme. However, with aid of the ADO framework, we are able to derive analytical expressions for those equations.
In order to simplify the notation, we consider a single detector where for
and
outside the interval, as in Equation (Equation6
(6)
(6) ), and in Equation (Equation20
(20)
(20) ), without loss of generality, a single basis function,
, for
, and
, otherwise. We note that, differently of previous work [Citation14], no conditions are imposed to relate the intervals where the detectors are placed with the ones where the basis functions are defined. Continuing, by the bilinearity of Equation (Equation4
(4)
(4) ) and the linearity of Equation (Equation13
(13)
(13) ), we may rewrite Equation (Equation11
(11)
(11) ) as
(32)
(32)
We then express the first term on the right-hand side of Equation (Equation32(32)
(32) ) as
(33a)
(33a)
(33b)
(33b)
(33c)
(33c) where, looking back to Equation (Equation27
(27)
(27) ), we get
(34)
(34)
with(35)
(35)
After replacing Equation (Equation34(34)
(34) ) into Equation (Equation33c
(33c)
(33c) ) and using the definition of f to restrict the integration limits, we obtain
(36a)
(36a)
(36b)
(36b) Similarly, for the second term on the right-hand side of Equation (Equation32
(32)
(32) ), we use Equation (Equation30
(30)
(30) ) to evaluate
(37a)
(37a)
(37b)
(37b) Now, special attention has to be given to the evaluation of the integrals in the right-hand side. In this way, we first substitute Equation (Equation31a
(31a)
(31a) ) along with the definition of
into the first term of Equation (Equation37b
(37b)
(37b) )
(38a)
(38a)
(38b)
(38b)
(38c)
(38c) taking into account that
and
when z is outside
. Here the notation
means the minimum value between z and
. Similarly,
(39a)
(39a)
(39b)
(39b)
(39c)
(39c) where, in this case,
and the maximum value between z and
is denoted by
.
Proceeding, we evaluate the integral in Equation (Equation38c(38c)
(38c) ), to finally obtain
(40)
(40)
where we have tried to properly take into account all possible relations among the values of ,
,
and
, with
and
, when defining the integral limits. Analogously, for Equation (Equation39c
(39c)
(39c) ),
(41)
(41)
Going back now to Equation (Equation32(32)
(32) ), we use the previously defined angular quadrature scheme to express the third term in the right-hand side as
(42a)
(42a)
(42b)
(42b) Replacing the expressions for
and
calculated in Equation (Equation27
(27)
(27) ) into Equation (Equation42b
(42b)
(42b) ), we get, after some algebraic manipulations,
(43a)
(43a)
with(43b)
(43b)
and(43c)
(43c) Finally, the last term in the right-hand side of Equation (Equation32
(32)
(32) ), we express, after similar calculations as
(44a)
(44a)
(44b)
(44b)
with(44c)
(44c)
and(44d)
(44d)
To summarize, to use the adjoint angular flux to evaluate the detector response, through Equation (Equation11(11)
(11) ), one can either directly apply numerical quadrature schemes to evaluate the requested integrals, a procedure which in general demands more computational time, or to compute r by Equation (Equation32
(32)
(32) ) along with the explicit expressions derived in this section. In the later case, we start by computing Equation (Equation35
(35)
(35) ) to substitute into Equation (Equation36b
(36b)
(36b) ), to obtain
. Then, we evaluate Equations (Equation38c
(38c)
(38c) ) and (Equation39c
(39c)
(39c) ) to substitute into (Equation37b
(37b)
(37b) ), to calculate
. Next, we compute
, Equation (Equation43a
(43a)
(43a) ), and
, Equation (Equation44b
(44b)
(44b) ), to have the final value of r established.
We discuss aspects of our computational implementation and present some numerical results in the next section.
5. Computational aspects and numerical results
To begin, we fix a set of D neutral particle detectors, with (z), for
, as in Equation (Equation6
(6)
(6) ). To generate the measurements, we first solve Equation (Equation1
(1)
(1) ), given a source S, and compute the numerical response
of each detector, using Equation (Equation5
(5)
(5) ). In this work, we use the ADO [Citation23] method for solving the forward transport equation, to compute
. After that, we generate noisy readings by computing
(45)
(45)
for , where
is a random number generated from a zero-mean Gaussian distribution with standard deviation
, where, for the numerical tests, we discuss later on in this text, we assumed two values: (A)
; (B)
.
Continuing, with respect to the minimization procedure, we rewrite the objective function defined in Equation (Equation21(21)
(21) ) as
(46)
(46)
for a given regularization parameter , with
and
, where
depends on the regularization matrix
. Provided that only non-negative neutral particle sources are physically acceptable, we minimize Equation (Equation46
(46)
(46) ) using the non-negative least squares method [Citation30].
To generate matrix , we apply the ADO method for obtaining the adjoint flux, as described in Section 4, solving Equation (Equation10
(10)
(10) ) D times, considering as source term the absorption function
of each detector. To compute the entries
of
, either numerical integration of the inner-product integrals, Equation (Equation16
(16)
(16) ), can be used or, our choice here, analytical expressions discussed in Section 4.3; in particular Equations (Equation36b
(36b)
(36b) ) and (Equation37b
(37b)
(37b) ). Finally, we have to choose the regularization parameter
, in Equation (Equation46
(46)
(46) ). First choice was such that
in Equation (Equation15
(15)
(15) ) would satisfy the Morozov’s principle [Citation26]
(47)
(47)
for . However, we found in our tests that Equation (Equation47
(47)
(47) ) was too restrictive, only being satisfied on a few test cases. Instead, we selected
such that a weaker condition
(48)
(48)
with , is satisfied.
In order to analyse the quality of our reconstructions, we consider a few measurements related to the reconstruction error:
| (1) | the absolute and relative errors between the original font S and the reconstruction | ||||
| (2) | the absolute and relative errors between the scalar flux | ||||
| (3) | the absolute and relative error between the noisy-free readings | ||||
All tests were performed on a machine equipped with an Intel Core i5-4670 processor with 16 GiB of RAM.
5.1. Problem I
As a first test, we consider an homogeneous medium defined for and we analyse two cases of the parameter c,
and
. To be able to explore higher order anisotropy degrees, we chose a known scattering law in radiative transfer applications [Citation22,Citation31] to which a recurrence relation is available to generate the coefficients
(51)
(51)
for , with
. At the boundaries
and
the incoming fluxes are zero.
We aim to reconstruct a Gaussian source(52)
(52)
which may be taken as an approximation to the Dirac’s Delta function centred at [Citation32]. We define an uniform partition of the interval [0, 50] to set the basis functions
, Equation (Equation20
(20)
(20) ),
(53)
(53)
This basis is clearly too poor to represent the source S. This aspect, however, may be considered as an additional noise to our reconstruction. We found that 0.1058 is the absolute error in the norm between S and its projection onto the space generated by the proposed basis, which leads to a relative error of
.
In our tests, we initially placed a given number () of detectors, with fixed width, equally distributed in the domain. When different from zero, we set the absorption parameter
. With respect to the relation with the basis function support, we consider two configurations in [0,50]: (i) a single particle detector within each basis function support and (ii) two detectors within each support. Still, we consider the support of each detector is defined in an arbitrary sub-interval of just one basis function support. It cannot intercept the support of two basis functions. For both configurations, measurements
were computed with at least 10 decimal places of accuracy, by the ADO method, using 64 discrete directions in the interval (0, 1].
In order to compute the matrix , we solve the adjoint transport equation using each one of the detectors as adjoint source term. The solutions here were computed using the ADO method considering 32 discrete directions with 9 to 10 decimal places of accuracy. With respect to the identifiability [Citation25] of our inverse model, we have
for both configurations, indicating the necessity of regularization techniques.
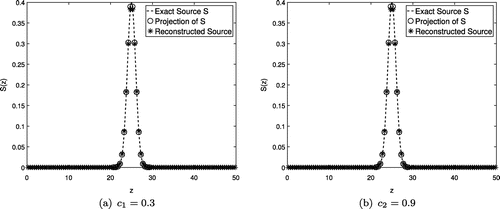
Since we hope at least to be able to approximate the original source S when using noise-free readings, we plot in Figures and the true source S (dashed line), the projection of S onto the span of (circles) and the reconstruction without regularization using noise-free readings (asterisks) for configurations (i) and (ii) and each choice of c. Table shows the errors we found in this reconstruction.
Figure 2. Exact source S (dashed line), projection of S onto the span of (circles) and unregularized reconstruction using noise-free readings (asterisks) using 50 particle detectors.
Figure 3. Exact source S (dashed line), projection of S onto the span of (circles) and unregularized reconstruction using noise-free readings (asterisks) using 100 particle detectors.
Table 1. Absolute error and relative to S error for the noise-free reconstructions, angular flux and detector reading.
As indicated by Figures and , and Table , using error-free measurements, the derived method was able to approximate S successfully, in the sense of reproducing a relative error of similar magnitude of its projection onto the basis space.
As a next step, we use Equation (Equation45(45)
(45) ) to add noise to each detector reading. As mentioned previously, we work with cases (A) and (B), respectively, where we set the standard deviation for the normal distribution as
and
of each reading. Table summarize our test cases.
Table 2. Test cases for problem I.
Table 3. Comparisons between exact and perturbed readings.
We list in Table the maximum value, mean, minimum and standard deviation of the perturbed readings for both configurations of the detectors and different values of c. In Table , we present the absolute and relative errors between the exact source S and the reconstructed source , calculated by Equation (Equation49a
(49a)
(49a) ); the absolute and relative errors between the scalar flux calculated using the exact source S and the scalar flux calculated using the reconstructed source
, through Equation (Equation49b
(49b)
(49b) ), and, the absolute and relative errors between the detector readings calculated using the exact source S and the readings computed using the reconstructed source
, as in Equation (Equation49c
(49c)
(49c) ).
Table 4. Problem I: minimum (Min), mean (Mea), maximum (Max) and standard deviation (Std) values for (i) the absolute and relative to S errors of the reconstructed source ; (ii) absolute and relative to
error of the scalar flux calculated using the reconstructed source
; (iii) absolute and relative to r errors of the detector readings. Results obtained utilizing
as Tikhonov’s regularization matrix. Test cases described in Table .
As Table indicates, for the source term reconstruction, we were able to obtain for cases I to IV (less noise) errors of similar order of magnitude as the ones obtained with no perturbation, showed in Table .
The errors associated with the particle detector readings may also be considered satisfactory. On the other hand, for cases V to VIII, when we increase the noise, the errors in the source reconstruction are a lot higher, even reaching in test VI. However, we were still able to obtain satisfactory results for the error in the scalar flux and detector readings.
Proceeding, we repeat our tests using , defined in Equation (Equation22a
(22a)
(22a) ), as regularization matrix. The errors are very similar to the ones obtained in the previous tests using
; however, we remark a drop between 50% and 60% in computational time, since the regularization parameter is more quickly determined.
Using as regularization matrix, Equation (Equation22b
(22b)
(22b) ), we also found similar results to the errors when comparing to the previous tests using
and
as regularization matrices. Similarly with the test using
, the computational time was once again faster than the test using
as regularization matrix.
We also note, that based on the analysis of the results, the additional computational effort required to run the 100 detectors case do not seem to enhance the reconstruction process (cases III, IV, VII and VIII).
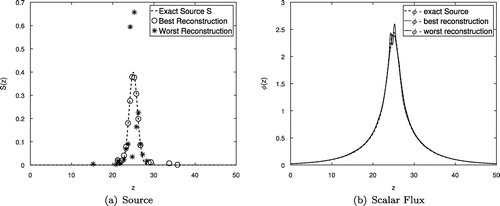
We show in Figures the best and worst reconstructions obtained in our tests with higher noise, , and
as regularization matrix. We named the best reconstruction the one which absolute error between the exact and the estimated source is minimum, and similarly, the worst reconstruction is the one with maximum absolute error.
Figure 4. (a) Exact source S (dashed line), best reconstruction (circles), and worst reconstruction (asterisks); (b) Scalar flux calculated using the exact source S (dashed line), using the best reconstruction (dotted line) and using the worst reconstruction (solid line).
In Figure (a), both the best and worst reconstruction were able to approximate the exact source shape and the location of the region where it is positive. The scalar flux computed with the best reconstruction almost overlapped, as Figure (b) indicates, the exact one. On the other hand, for the worst reconstruction, the scalar flux presented higher values in the same spot where the reconstructed source was far from the exact one.
For our next tests, we refine our partition. We set our basis functions in Equation (Equation20
(20)
(20) ) using an uniform partition
(54)
(54)
of [0, 50]. Using these basis functions, we found an absolute error of 0.0539 between S and its projection into the basis space, and a relative error of . For the readings, we consider 100 particle detectors, one for each basis function, all with the absorption parameter
within its support. We note, however, that the support of the detector is defined as a subinterval of the basis function support (in general we use about
of the interval).
In the same way as before, we compute the real measurements through solving the transport equation by the ADO method considering 64 discrete directions, obtaining in the process at least 10 decimal places. The inversion matrix
is once again calculated using the ADO method considering 32 discrete directions when solving the adjoint transport equation, which was also able to attain at least 10 decimal places of accuracy.
We plot in Figure the true source S (dashed line), the projection of S onto the span of (circles) and the reconstruction without regularization using noise-free readings (asterisks) for the two values of c.
Figure 5. Exact source S (dashed line), projection of S onto the span of (circles) and unregularized reconstruction using noise-free readings (asterisks) using 100 basis functions and 100 particle detectors.
As indicated by Figure , the derived method was able to successfully approximate the desired true source S using error-free measurements, once again, in the sense that relative errors between the original source and the reconstructed one are similar to the ones between the original source and its projection.
As we have already done in the previous tests, we use Equation (Equation45(45)
(45) ) to add noisy information to each exact detector reading, then proceed with the reconstructions for different values of c and each regularization matrix.
Similarly as the previous configuration, using noiseless data, we were able to obtain good approximations to the true source. The errors in the readings were also satisfactory. As the noise level increases, we noted again higher errors when estimating the source. But, one more time, we were still able to obtain relatively good results to the scalar flux and detector readings estimates. In Figure , we show the best and worst reconstructions using as regularization matrix and
, under the conditions just described.
Figure 6. (a) Exact source S (dashed line), best reconstruction (circles), and worst reconstruction (asterisks); (b) Scalar flux calculated using the exact source S (dashed line), using the best reconstruction (dotted line) and using the worst reconstruction (solid line).
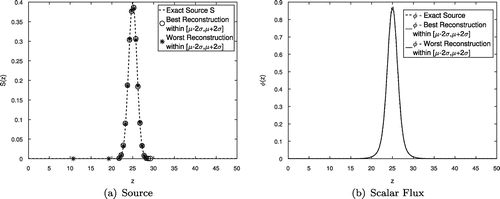
Although there is a clear lack in the reconstruction quality for the worst case, Figure (a), the scalar flux calculated using this reconstructed source, showed in Figure (b), almost overlaps the scalar flux computed using the exact source. Moreover, for almost the totality of the samples (4816 out of 5000), the error , with
and
being, respectively, the mean and standard deviation of the sample distribution. Restricting the samples to those within this interval, we find a maximum absolute error of
, which is equivalent to a
relative error to the exact source S error, a value close to the ones obtained using 50 basis functions. We plot in Figure the graphs of the source and scalar flux reconstructions for this case.
Figure 7. (a) Exact source S (dashed line), best (circles) and worst (asterisks) reconstructions within two standard deviations interval to the absolute error mean; (b) Scalar flux calculated using the exact source S (dashed line), using the best (dotted line) and worst reconstructions (solid line) within two standard deviations interval to the absolute error mean.
5.2. Problem II
As a second test problem, we consider the reconstruction of a localized source piecewisely defined for by
(55)
(55)
We assume that the particles are isotropically migrating within the slab, a medium with physical parameters set as and
. As before, we also assume that there is no incoming flux at the boundaries
and
.
For this test, we assume three different partitions of [0, 10] when defining the basis functions in Equation (Equation20(20)
(20) ):
(56a)
(56a)
(56b)
(56b)
and(56c)
(56c)
At this time, a detector is placed at the centre of each basis function support, in general occupying about of the support interval, with the absorption parameter defined by
in the detector support. Just as before, for each detector, we compute a reading
using Equation (Equation5
(5)
(5) ) and, thereafter, we add normally distributed noise, with zero mean and
of each reading as standard deviation. For this test problem, we used only
, defined in Equation (Equation22a
(22a)
(22a) ), as regularization matrix and consider 5000 noisy samples. Table displays all errors obtained in the simulation.
Table 5. Problem II: minimum (Min), mean (Mea), maximum (Max) and standard deviation (Std) values for (i) the absolute and relative to S errors of the reconstructed source ; (ii) absolute and relative to
error of the scalar flux calculated using the reconstructed source
; (iii) absolute and relative to r errors of the detector readings. Results obtained utilizing
as Tikhonov’s regularization matrix. Number of detectors equal to the number of basis functions for each partition.
Similarly to the previous test problem, we were able to obtain, even when adding more noise, satisfactory approximations to the original source S. Upon using the finer partition instead of
, the method presented a slightly improvement of the error values. The reconstructions based on the
partition provided better results than the ones using
, probably as consequence of the combination of a finer discretization when defining our basis function and smaller number of detectors adding noise information into the system. In Figure , we plot the best reconstruction result using the partition
.
Figure 8. (a) Exact source S (dashed line) and best reconstruction using the partition (circles); (b) Scalar flux calculated using the exact source S (solid line) and using the reconstruction (dashed line).
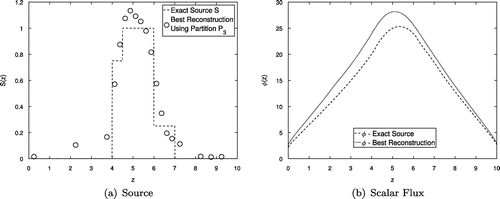
As both Figures, (a) and (b), indicate, our method is able to provide a qualitative idea of the true particle source S shape and magnitude, although, as numerical simulations indicate, it was not able to reproduce the original source as accurately as the Gaussian source in the previous test problem.
As a variation of the previous test, we now reduce the number of particle detectors, still uniformly distributed along the physical domain, to only 10. Partitions and
are considered for defining the basis functions. We show in Table the results.
Table 6. Problem II: minimum (Min), mean (Mea), maximum (Max) and standard deviation (Std) values for (i) the absolute and relative to S errors of the reconstructed source ; (ii) absolute and relative to
error of the scalar flux calculated using the reconstructed source
; (iii) absolute and relative to r errors of the detector readings. Results obtained utilizing
as Tikhonov’s regularization matrix. Uniform distribution of ten detectors along the domain.
As the analysis of Table indicates, the reduction of the number of detectors to half and one quarter, respectively, of the number of basis functions, led to higher errors in the source reconstruction.
We also tested the reconstruction with a nonuniform distribution of detectors throughout the domain. We first considered 20 particle detectors placed near to the boundaries – half of them within the range [0, 1], and the remaining ones in [9, 10]. We still assume noisy measurements normally distributed, with zero mean and of each reading as standard deviation.
Table 7. Problem II: minimum (Min), mean (Mea), maximum (Max) and standard deviation (Std) values for (i) the absolute and relative to S errors of the reconstructed source ; (ii) absolute and relative to
error of the scalar flux calculated using the reconstructed source
; (iii) absolute and relative to r errors of the detector readings. Results obtained utilizing
as Tikhonov’s regularization matrix. Twenty detectors placed (half of them) close to each one of the boundaries of the domain.
As we see in Table , using partition to generate the reconstruction basis, situation where we have as many detectors as basis functions, the errors were much higher than the ones we found using uniformly distributed detectors. Proceeding, using
, where we have twice as many basis functions as detectors, the error values we obtained were even higher.
Proceeding, we then consider 20 particle detectors now placed all of them within the range [4, 7], exactly the region where the source S is positive.
Table 8. Problem II: minimum (Min), mean (Mea), maximum (Max) and standard deviation (Std) values for (i) the absolute and relative to S errors of the reconstructed source ; (ii) absolute and relative to
error of the scalar flux calculated using the reconstructed source
; (iii) absolute and relative to r errors of the detector readings. Results obtained utilizing
as Tikhonov’s regularization matrix. Twenty detectors distributed in a subinterval of the domain.
Table indicates that the errors, in the source reconstruction, are slightly higher than the ones we found using uniformly distributed detectors. However, results obtained through this configuration seems better than the previous one, where the detectors were concentrated closer to the boundaries. In fact, we note the shape of the source still may be recovered.
6. Discussion
The ADO method, an analytical approach to solve the discrete ordinates approximation of the adjoint transport equation, was applied in the inverse problem of estimating the location and magnitude of sources of neutral particles. The use of analytical expressions when calculating the matrix , basic for the minimization problem, Equation (Equation18
(18)
(18) ), allowed us to avoid all spatial discretizations error inherent of quadrature schemes. We remark, however, that those analytical expressions are only valid for the particular choice of basis functions and absorption function used in this work, requiring to be re-evaluated for distinct configurations. In both test problems, each reconstruction took less than a second in our machine. In the first test problem, when computing the matrix
, our code took an average of 9.445 s to perform all the calculations using quadrature schemes. In contrast, using the analytical expressions proposed in Section 4.3, we observed a reduction in the computational time to 0.007 s, a gain of three orders of magnitude. We should stress here that although we have carefully implemented the computational code for both versions, the codes were not particularly optimized, still having room for improvements.
For the two source reconstruction model problems considered, with localized sources and detectors scattered through the domain, we were able to obtain good results for the absolute error between the reconstructed source and the original one: values of order for the Gaussian source and order
for the localized piecewise constant source. Relative errors were in general of same order of magnitude than the ones between the original source and its projection. Still, scalar fluxes and the detector readings recovered with the reconstructions were very satisfactory. In the reconstruction of the Gaussian source, we found similar errors using
,
and
as regularization matrices; however, we were able to get an appropriate regularization parameter faster when using
and
. For the second test problem, when using a more refined partition only in the interval where the source is positive, we were able to easily achieve same order of magnitude error than the other partitions, using smaller number of basis functions and detectors. In regard to the detectors location, although the cases where they were uniformly distributed through the domain result in smaller errors, it may not be realistic in some applications. When they were concentrated in some intervals of the domain, the configuration with detectors closer to the boundaries shown to be worse than the one where they were located in coincidence with the positive source region.
Perhaps an obvious improvement is the use of others basis functions for the reconstruction space, like polynomials and splines, which may be considered in the future, still requiring our analytical expressions to be re-evaluated for such cases. However, it is our main idea to move, firstly, in the direction of extending our analysis to more complex model problems.
Currently, we are working on the use of Bayesian framework in the inverse process as well as the inclusion of energy dependence in the model problem. Furthermore, studies developed by our research group found out that the ADO method along with nodal techniques, when applied in bi-dimensional problems, are able to reproduce results as accurate as other techniques from coarser meshes [Citation20]. It might provide a speed up in computational time and suggests a natural extension of this work to two-dimensional problems.
Disclosure statement
No potential conflict of interest was reported by the authors.
Additional information
Funding
References
- Gao H , Zhao H . Multilevel bioluminescence tomography based on radiative transfer equation part 1: l1 regularization. Opt Express. 2010;18(3):1854–1871.
- Dorn O . Scattering and absorption transport sensitivity functions for optical tomography. Opt Express. 2000;7(13):492–506.
- Kauati AT , Silva Neto AJ , Roberty NC . A source-detector methodology for the construction and solution of the one-dimensional inverse transport equation. Inverse Probl Eng. 2001;9(1):45–66.
- Haltmeier M , Neumann L , Rabanser S . Single-stage reconstruction algorithm for quantitative photoacoustic tomography. Inverse Probl. 2015;31(6):1–24.
- Hykes JM , Azmy YY . Radiation source reconstruction with known geometry and materials using the adjoint. In: International Conference on Mathematics and Computational Methods Applied to Nuclear Science and Engineering (M &C); 2011 May 8--12; Rio de Janeiro, Brazil.
- Miller KA , Charlton WS . An inverse transport approach to radiation source location for border security. In: Proceedings of the 29th Annual Meeting of the European Safeguards Research and Development Association; 2007 May 22--24; Aix-en-Provence, France.
- Sugaya S , Endo T , Yamamoto A . Inverse estimation of unknown radioactive source using detection probability and adjoint calculation. In: International Conference on Mathematics and Computational Methods Applied to Nuclear Science and Engineering (M &C); 2017 Apr 16--20; Jeju, Korea.
- McCormick NJ . Inverse radiative transfer problems: a review. Nucl Sci Eng. 1992;112(1):185–198.
- Siewert CE . An inverse source problem in radiative transfer. J Quant Spectrosc Radiat Transfer. 1993;50(6):603–609.
- Siewert CE . A radiative-transfer inverse-source problem for a sphere. J Quant Spectrosc Radiat Transfer. 1994;52(2):157–160.
- Tao Z , McCormick NJ , Sanchez R . Ocean source and optical property estimation from explicit and implicit algorithms. Appl Opt. 1994;33(15):3265–3275.
- Bledsoe KC , Favorite JA . Using the Levenberg-Marquardt method for the solution of inverse transport problems with scattering. In: Joint International Topical Meeting on Mathematics & Computations and Supercomputing in Nuclear Applications (M &C+SNA); 2007 Apr 15--19; Monterey, CA, USA. p. 1898–1912.
- Curbelo JP , Barros RC . Application of the adjoint spectral green’s function-constant nodal method for one-speed xy-geometry discrete ordinates source detector problems. In: International Conference on Mathematics and Computational Methods Applied to Nuclear Science and Engineering (M &C); 2017 Apr 16--20; Jeju, Korea.
- Pazinatto CB , Barichello LB . On the use of analytical techniques for source reconstruction problems. In: International Conference on Mathematics and Computational Methods Applied to Nuclear Science and Engineering (M &C); 2017 Apr 16--20; Jeju, Korea.
- Pazinatto CB , Barros RC , Barichello LB . Analytical adjoint discrete ordinates formulation for monoenergetic slab-geometry source-detector calculations. Int J Nucl Energy Sci Technol. 2016;10(2):107–119.
- Chandrasekhar S . Radiative transfer. New York (NY): Dover; 1960.
- Barichello LB , Siewert CE . A discrete-ordinates solution for a non-grey model with complete frequency redistribution. J Quant Spectrosc Radiat Transfer. 1999;62(6):665–675.
- Barichello LB , Siewert CE . A discrete-ordinates solution for a polarization model with complete frequency redistribution. Astrophys J. 1999;513(1):370–382.
- Barichello LB , Cabrera LC , Prolo Filho JF . An analytical approach for a nodal scheme of two-dimensional neutron transport problems. Ann Nucl Energy. 2011;38(6):1310–1317.
- Barichello LB , Tres A , Picoloto CB , Azmy YY . Recent studies of the asymptotic convergence of the spatial discretization for two-dimensional discrete ordinates solutions. J Comput Theor Transp. 2016;45(4):299–313.
- Bell GI , Glasstone S . Nuclear reactor theory. New York (NY): Van Nostrand Reinhold Company; 1970.
- Siewert CE . Inverse solutions to radiative-transfer problems based on the binomial or the henyey-greenstein scattering law. J Quant Spectrosc Radiat Transfer. 2002;72(6):827–835.
- Barichello LB . Explicit formulations for radiative transfer problem. Chapter 15, In: Thermal measurements and inverse techniques. Boca Raton (FL): CRC Press; 2011.
- Prinja AK , Larsen EW . General principles of neutron transport. Chapter 5, In: Handbook of nuclear engineering. Vol. 1, Nuclear engineering fundamentals. New York (NY): Springer; 2010.
- Beck JV , Arnold KJ . Parameter estimation in engineering and science. New York (NY): Wiley; 1977.
- Kaipio J , Somersalo E . Statistical and computational inverse problems. New York (NY): Springer; 2005.
- Pazinatto CB . Formulação ADO para o problema adjunto de transporte unidimensional e aplicação em um problema inverso de reconstrução de fonte [master’s thesis]. Porto Alegre, RS, Brazil: Universidade Federal do Rio Grande do Sul; 2015. Portuguese.
- Abramowitz M , Stegun IA . Handbook of mathematical functions with formulas, graphs, and mathematical tables. New York (NY): Dover; 1965.
- Barichello LB , Garcia RDM , Siewert CE . Particular solutions for the discrete-ordinates method. J Quant Spectrosc Radiat Transfer. 2000;64(3):219–226.
- Lawson CL , Hanson RJ . Solving least squares problems. Philadelphia (PA): SIAM; 1995.
- McCormick NJ , Sanchez R . Inverse problem transport calculations for anisotropic scattering coefficients. J Math Phys. 1981;22(1):199–208.
- Kythe DK , Kythe PK . Algebraic and stochastic coding theory. Boca Raton (FL): CRC Press; 2012.