
 ?Mathematical formulae have been encoded as MathML and are displayed in this HTML version using MathJax in order to improve their display. Uncheck the box to turn MathJax off. This feature requires Javascript. Click on a formula to zoom.
Abstract
In this research work, a crack diagnosis method for beam-column structures is proposed considering axial load effects through experimental data. The proposed method is employed for the detection of damage locations including single and multiple damage scenarios considering four cases of simply supported beam-column. The results show that the locations of single and multiple damage scenarios can be well recognized in low axial loads considering random noise effect. However, in the vicinity of the critical load, healthy and damaged static data are uncommon. On the other hand, increasing the axial load, especially when it reaches to the critical load, has a negative effect on the static responses that is precisely considered by the proposed damaged index.
1. Introduction
Structural health monitoring (SHM) systems are usually used to check the status of structures, to diagnose the damage. Damages may occur in different parts of structures. Hence, monitoring of a structure and identifying damage at the earliest possible stage is a main concern, which was considered by many researchers during past decades. For this purpose, changes of dynamic and static characteristics of the structure were employed for structural damage detection techniques. In the meantime, dynamic responses were used by several researchers to estimate the natural frequencies and mode shapes of a structure [Citation1–14]. Moreover, static data only depend on the stiffness matrix and more inexpensive tools are sufficient to extract responses. Also, speed of access to static data compared with dynamic ones can be as another advantage. Consequently, these valuable characteristics, listed for static data, attracted much attention. Measurements of the strain energy were used by Sanayei and Saletnik [Citation15] to estimate parameters in the linear elastic structures. A method based on stored strain energy in elements in order to select the location of applied load was introduced by Bakhtiari-Nejad et al. [Citation16]. Also, they tested the method experimentally using a frame in order to determine damage at element level without having an accurate model for healthy structure. A two-stage damage detection method based on a grey system theory using the measured static displacement of a cantilever beam was proposed by Chen et al. [Citation17]. The results showed that the slight to moderate damage can be localized through the proposed method based on the grey relation analysis and the optimization can identify the damage magnitude with a high accuracy. A method based on static measurement was used by Caddemi and Morassi [Citation18] to identify single crack in a beam via damaged static deflection. The results indicated a good agreement between numerical results and those of proposed theory. A parametric study using static displacement curvature for damage detection of beam structures was made by Abdo [Citation19]. The results demonstrated that changes in displacement curvature can be used as a good damage indicator even for a small amount of damage. Change of strain energy based on static noisy data was utilized by Seyedpoor and Yazdanpanah [Citation20] to propose an efficient structural damage indicator. The acquired results clearly showed that the proposed indicator can precisely locate the damaged elements. A new so-called Deformation Area Difference (DAD) Method based on static load deflection experiment on a beam was proposed by Dolgion et al. [Citation21] for damage detection. This method does not require a reference measurement of initial condition. In order to assemble the DAD index, theoretical (reference) deflection, first and second derivations of the theoretical deflection were employed.
Most of the previous research works focused on a beam element without axial load effect. The capability of static data considering axial load was examined theoretically by Yazdanpanah et al. [Citation22] to localize damage in beam-column structures. A more sensitive damage indicator was proposed to demonstrate the effects of axial forces comparable to critical loads. Since there is a lack of experimental data for the aforementioned research work, therefore, this paper aims to investigate the structural behaviour of the beam-columns considering axial loads experimentally. For this purpose, the proposed efficient damage indicator for beam-column structures was evaluated via experimental data including displacements and their first and second derivatives. Based on the theory of structural stability, considering the slop terms in the behaviour of beam-column structure and its governing differential equation plays a vital role. Therefore, considering this parameter in the proposed damage indicator leads to more accurate evaluation of its behaviour that the accuracy and validity of the results were approved in the previous paper based on only the theoretical data. As a result, in this paper, the influence of parameters affecting on the efficiency and accuracy of the proposed method is investigated via experimental data.
2. Damage detection techniques
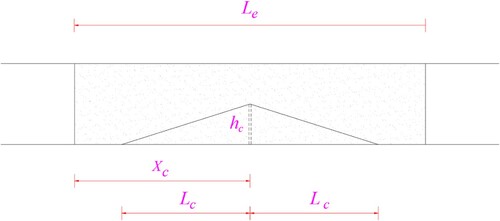
Curvature, flexibility and strain energy methods were selected as candidates of damage detection techniques to diagnose the damage in a beam structure [Citation23–25]. In this study, a transverse surface crack model, proposed by Sinha et al. [Citation26], is adopted, which explained completely in the literature. It is assumed that damage occurs by a transverse surface crack located at xcr from the left end of a beam-column as shown in Figure and the effect of the crack on the mass is small and can be neglected. It is assumed that the elements are sufficiently large with respect to the crack size and reduction of stiffness due to the crack is related to one element. Due to cracked element as shown in Figure , the flexural rigidity EI of the cracked element changes linearly from the cracked position towards both sides in an effective length lc.
Figure 1. A simply supported beam-column having a crack located at xcr from the left end.
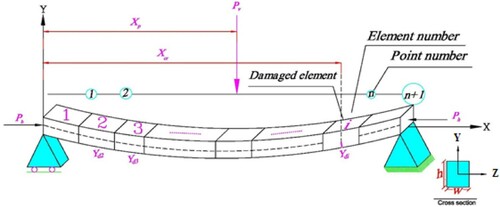
Figure 2. Variation of EI due to the crack in an element with length le.
The stiffness matrix of the damaged element is defined as follows:
(1)
(1) where
represents the element stiffness matrix of the intact element;
is the stiffness reduction on the intact element stiffness matrix due to the jth crack. According to Euler–Bernoulli beam-column element, the element stiffness matrix of the intact beam-column is expressed as [Citation26]
(2)
(2) where
(3)
(3) utilizing the linear variation of EI as proposed by Sinha et al. [Citation26], the reduction on the beam-column element stiffness matrix can be obtained as
(4)
(4) where the stiffness factors are given by
(5)
(5) The reduction stiffness matrix on the beam element can be extended for a beam-column element as
(6)
(6) where the
factor is given by
(7)
(7)
where xc is the crack location in the local coordinate, le is the length of the element and lc is the effective length of the stiffness reduction. The value of lc is assumed to be 1.5 times the beam-column height. Also, E is the Young’s modulus,
,
and
are the moments of inertia of the intact and cracked cross sections, respectively, w and h are the width and height of the intact beam-column and
denotes the crack depth. For the case of more than one cracked elements, the same procedure can be followed. The global stiffness matrix of the beam-column Kc is obtained by assembling the element stiffness matrices including those of cracked elements.
3. Proposed damage detection method
Consider the damage detection problem of a prismatic beam-column with a specified length. First, the beam-column is divided into a number of finite elements. Then, the displacements of the healthy beam-column in measurement points are evaluated using the finite element method. A MATLAB (R2017a) [Citation27] code is prepared here for this purpose. Henceforward, consider the nodal coordinates and displacement
obtained for the healthy beam-column as follows:
Utilizing the displacements, the displacements slope (the first derivative of displacements,
) of healthy beam can be achieved through the central finite difference approximation as
(8)
(8) where le is the distance between the measurement coordinates or equivalently the element length. Also,
represents the displacement at the measurement coordinate q.
Similarly, the displacement curvature (the second derivative of displacements) of healthy beam-column can now be determined using the central finite difference approximation as
(9)
(9) This process can also be repeated for damaged beam-column. It is assumed that the damage decreases the stiffness and therefore can be simulated by a reduction in the moment of inertia (I) at damage location. Also the homogenized crack is considered at the centre of an element. So, the nodal coordinates and ith displacement (
) are obtained for the damaged beam-column as follows:
Now displacements of the considered damaged state are used to achieve the displacement slope of damaged beam-column via the central finite difference method.
(10)
(10) Also, the displacement curvature of damaged beam-column can now be approximated as follows:
(11)
(11) Finally, using the static responses (displacement, slope and curvature of displacement) obtained for two above states, static responses based indicator (SRBI) is proposed here follows:
(12)
(12) Assuming that the set of the SRBI of all points
represents a sample population of a normally distributed variable, a normalized form of SRBI can be defined as follows:
(13)
(13) where SRBIq is defined by Equation (12). Also, mean (SRBI) and std (SRBI) represent the mean and standard deviation of (
), respectively. The results of utilizing proposed indicator given by Equation (13) are compared using both the results measured from the experimental and theoretical methods. It should be noted that in order to crack detection a damage borderline for nSRBI is assumed as 0.05.
4. Numerical examples
In order to assess the efficiency of the proposed method for damage detection under axial load, an example including a simply supported beam-column including different damage cases and scenarios is considered (listed in Table ). Various parameters that may affect the performance of the method, especially the critical axial load effects, are examined.
Table 1. Twelve different damage scenarios induced in simply supported beam-column.
4.1. A simply supported beam-column considering axial load
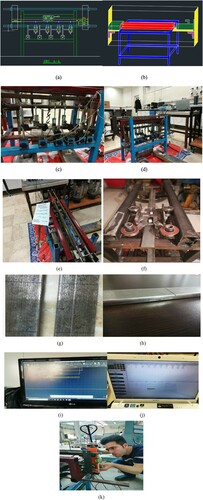
A simply supported beam-column with span L = 0.62 (m) shown in Figures –, with different damage cases, is selected as example. The beam-column has a cross-section with dimensions of 0.04 × 0.01 (m) and 0.02 × 0.03 (m) presented in Figures –, respectively. It is worth mentioning that Figures and are considered for multiple cracks. Modulus of elasticity is E = 2.1 × 10¹¹ (N/m2). As shown in Table , for the assessment of the method, 4 damage cases including 12 different damage scenarios are considered. In the first four scenarios (case 1), the effects of axial load on damage detection method in damaged element 3 are investigated using both the experimental and theoretical methods. To evaluate the capability and robustness of the proposed method, case 2 with three damage scenarios is also examined for damaged element 2 considering different axial load. Moreover, Cases 3 and 4 are considered for multiple cracks. Figure shows the experimental setup of the simply supported beam-column including modelling, assembling, LVDT, Data logger, VIRA software, Hydraulic jack, Pallet jack, platform, Load Cells, notches and so on.
Figure 3. Geometry of the simply supported beam-column and its cross-section: case 1.

Figure 4. Geometry of the simply supported beam-column and its cross-section: case 2.

Figure 5. Geometry of the simply supported beam-column and its cross-section: case 3.
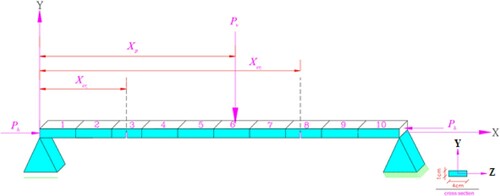
Figure 6. Geometry of the simply supported beam-column and its cross-section: case 4.
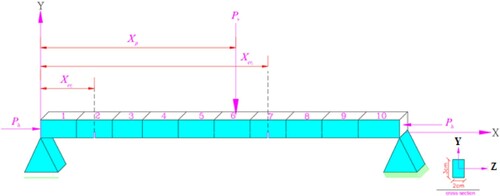
Figure 7. Experimental setup of the simply supported beam-column.
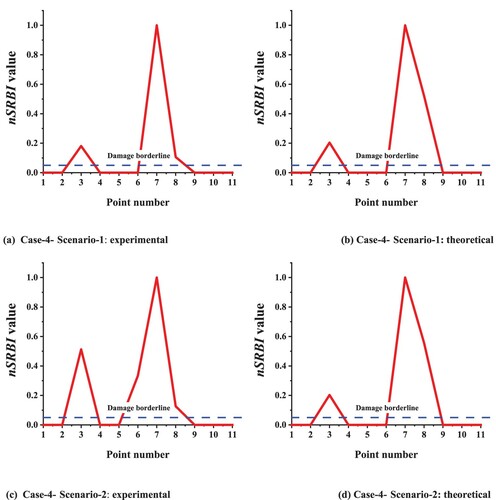
Damage identification diagrams of the simply supported beam-column for cases 1–4, listed in Table , were depicted in Figures –, respectively. As shown in the figures, the value of nSRBI is larger in the vicinity of some elements that indicates damage occurs in these elements. Moreover, a damage borderline for nSRBI is defined as nSRBI ≥ 0.05. Based on the defined threshold, it is revealed that the proposed index can accurately locate the damage cases under low and moderate axial loads. Furthermore, for verifying the proposed indicator, the experimental results of nSRBI were compared with those of analytical ones. The results show that there is a good agreement between both the experimental and analytical results.
Figure 8. Damage identification of simply supported beam-column for cases 1–4 subjected to different axial loads.
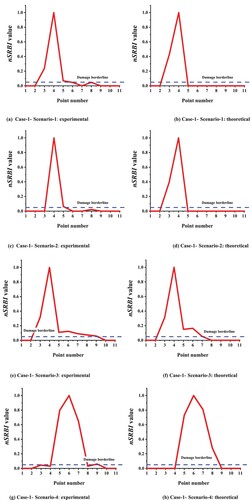
Figure 9. Damage identification of simply supported beam-column for cases 5–7 subjected to different axial loads.
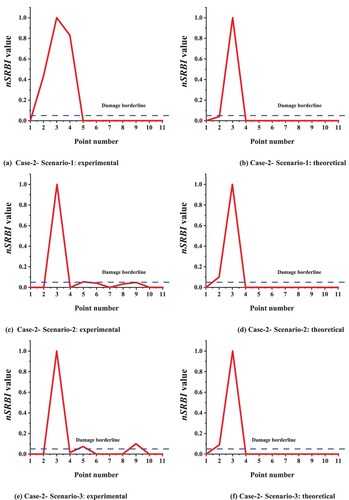
Figure 10. Damage identification of simply supported beam-column for cases 8–10 subjected to different axial loads.
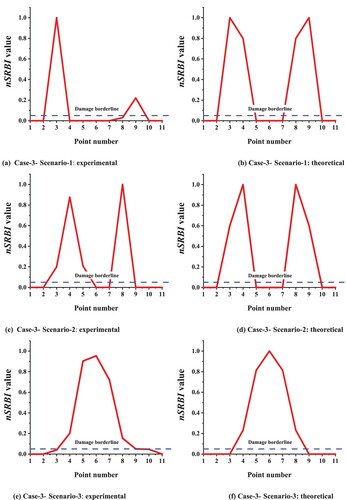
Figure 11. Damage identification of simply supported beam-column for cases 11–12 subjected to different axial loads.
4.1.1. The critical load effect
Different damage scenarios listed in Table were simulated and tested experimentally to consider the effect of axial load on the proposed indictor. In this regard, damage case 1 in Table including four different axial loads (especially over critical load) was studied. As shown in the identification diagram (Figure a–h), experimental results demonstrate that the proposed indicator (nSRBI) in low axial load can well determine the locations of damage cases. On the other hand, as the axial load reaches the critical load, the healthy and damaged static data are uncommon and the proposed damaged indicator is more sensitive to this issue. The reason of this fact is to consider the slope terms in the governing equation on beam-column behaviour [Citation28]. While the proposed indicator in the literature [Citation29] does not include this issue (for more detail see [Citation22]). As a result, considering the axial load especially critical load leads to disturb the responses of structures. It is worth mentioning that the beam-column structures under the axial loads in the vicinity of their critical load values experience high deformations which may cause failure. Therefore, the failure is practically due to increasing of the axial load than cracked element. Henceforth, it is concluded that the damaged indicators and extendedly the damage identification methods should not be studied. Because the failure was occurred due to critical load and the damaged indicator proposed in this paper considered this issue in both cases of numerical and experimental methods than damaged indicator proposed in the literature [Citation29].
Figure indicates damage identification diagram for damage case 2 in Table . As can be seen, the damage element 2 is accurately detected in low axial load through experimental and analytical methods. While increase in the axial load leads to detect other elements that are not suspected for damage. On the other hand, increase in axial load has a negative effect on damage identification method, which can be well determined using proposed damaged index.
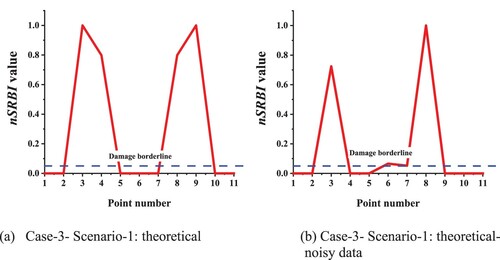
Figures and have been considered for multiple damage diagnosis defined in cases 3 and 4 in Table . The results show that the nSRBI can accurately detect the damaged elements in low axial loads. As the axial load reach the critical load, the healthy and damaged static data are uncommon and the proposed damaged indicator is more sensitive to this issue. As a matter of fact, in the vicinity of critical load, the failure is practically due to increase in the axial load than cracked element.
4.1.2. Random noise effect
As the responses may have accompanied by little noise, therefore, the aforementioned procedure is examined by using noisy data. To this end, the measurement noise effect on the static responses is considered according to Equation (14) as follows [Citation11,Citation20,Citation22,Citation30–32]:
(14)
(14) where noise, rand, data and N data are standard error of measurement noise, a function of random numbers generation distributed in the interval (0,1), responses vector and noisy responses vector, respectively. As illustrated from Figures –, the considering measurement noise up to 3% and 4%, respectively, has insignificant effect on the results.
Figure 12. Damage identification of simply supported beam-column for Case 2 Scenario 1: (a) theoretical data without noise and (b) theoretical data with 3% noise.
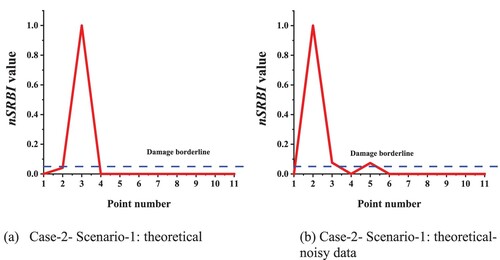
Figure 13. Damage identification of simply supported beam-column for Case 3 Scenario 1: (a) theoretical data without noise and (b) theoretical data with 4% noise.
5. Conclusion
In this paper, the effect of axial load on damage detection method and damage indicator was studied by using experimental results and compared with those of numerical ones. A damaged indicator proposed for modal analysis was extended for static data (nSRBI). In order to examine the efficiency of the damage indicator, various damage scenarios with different characteristics were examined. Based on the experimental and numerical studies, the following results can be obtained as
| • | nSRBI is sensitive to the stiffness reduction and the capability and efficiency of the proposed indicator were verified using both the experimental and numerical noisy data. The results show that nSRBI can accurately diagnose the single and multiple damages under low and moderate axial loads. | ||||
| • | As the axial load reaches to the critical load, the static data are disturbed. On the other hand, experimental and numerical results demonstrate that the proposed index in low axial load can well diagnose the locations of damage cases with different characteristics. However, in the vicinity of the critical load the healthy and damaged static data are uncommon. Despite previous indicator in the literature, the proposed damaged indicator in this study, due to considering the slope terms, is more sensitive to this issue. | ||||
| • | The beam-column structure in the vicinity of the critical load experiences high deformation. Failure in the next stages is practically due to increasing of the axial load than cracked element. Therefore, the available damaged indicator proposed in the literature cannot be used anymore. | ||||
Disclosure statement
No potential conflict of interest was reported by the author(s).
References
- Abdo MA-B, Hori M. A numerical study of structural damage detection using changes in the rotation of mode shapes. J Sound Vib. 2002;251(2):227–239.
- Talebinejad I, Fischer C, Ansari F. Numerical evaluation of vibration-based methods for damage assessment of cable-stayed bridges. Comp-Aid Civil Infrastruct Eng. 2011;26(3):239–251.
- Ho YK, Ewins DJ. On the structural damage identification with mode shapes. Proceedings of the European COST F3 Conference on system identification and structural health monitoring; 2000; Madrid, Spain. 1, 677–686.
- Kim J-T, Ryu Y-S, Cho H-M, et al. Damage identification in beam-type structures: frequency-based method vs mode-shape-based method. Eng Struct. 2003;25:57–67.
- Koh BH, Dyke SJ. Structural health monitoring for flexible bridge structures using correlation and sensitivity of modal data. Comput Struct. 2007;85(3-4):117–130.
- Messina A, Jones IA, Williams EJ. Damage detection and localization using natural frequency changes. Proceedings of the conference on identification in engineering system; 1992. Cambridge, UK, 1, 67–76.
- Messina A, Williams EJ, Contursi T. Structural damage detection by a sensitivity and statistical-based method. J Sound Vib. 1998;216(5):791–808.
- Ndambi J-M, Vantomme J, Harri K. Damage assessment in reinforced concrete beams using eigen frequencies and mode shape derivatives. Eng Struct. 2002;24:501–515.
- Salawu O. Detection of structural damage through changes in frequency: a review. Eng Struct. 1997;19:718–723.
- Seyedpoor SM, Yazdanpanah O. Structural damage detection by differential evolution as a global optimization algorithm. Iran J Struct Eng. 2015;1(1):52–62.
- Yazdanpanah O, Seyedpoor SM, Akbarzadeh Bengar H. A new damage detection indicator for beams based on mode shape data. Struct Eng Mech. 2015;53:725–744.
- Mukhopadhyay T. A multivariate adaptive regression splines based damage identification methodology for web core composite bridges including the effect of noise. J Sandwich Struct Mater. 2018;20(7):885–903.
- Mukhopadhyay T, Chowdhury R, Chakrabarti A. “Structural damage identification: A random sampling-high dimensional model representation approach”. Adv Struct Eng. 2016;19(6):908–927.
- Naskar S, Bhalla S. Metal-wire-based twin one-dimensional orthogonal array configuration of PZT patches for damage assessment of two-dimensional structures. J Intell Mater Syst Struct. 2016;27(11):1440–1460.
- Sanayei M, Saletnik MJ. Parameter estimation of structures from static strain measurements II: error sensitivity analysis. J struct Eng ASCE. 1996;122(5):563–572.
- Bakhtiari-Nejad F, Rahai A, Esfandiari A. Structural damage detection method using static noisy data. Eng Struct 2005;27:1784–1793.
- Chen XZ, Zhu HP, Chen CY. Structural damage identification using test static data based on grey system theory. J Zhejiang Univ Sci. 2005;6A(8):790–796.
- Caddemi S, Morassi A. Crack detection in elastic beams by static measurements. Int J Solids Struct. 2007;44(16):5301–5315.
- Abdo MA-B. Parametric study of using only static response in structural damage detection. Eng Struct. 2012;34:124–131.
- Seyedpoor SM, Yazdanpanah O. An efficient indicator for structural damage localization using the change of strain energy based on static noisy data. Appl Math Model. 2013;38(9-10):2661–2672.
- Dolgion E, Waldmann D, Norman Teferle F. (2018). Static load deflection experiment on a beam for damage detection using the Deformation Area Difference Method.
- Yazdanpanah O, Izadifard RA, Dehestani M. Static data based damage localization of beam-column structures considering axial load. Mech Adv Mater Struct. 2020;27(16):1433–1450.
- Pandey AK, Biswas M. Damage detection in structures using changes in flexibility. J Sound Vib. 1994;169(1):3–17.
- Lee E-T, Eun H-C. Damage detection approach based on the second derivative of flexibility estimated from incomplete mode shape data. Appl Math Model. 2017;44:602–613.
- Yang QW, Sun BX. Structural damage localization and quantification using static test data. Struct Health Monitor. 2011;10(4):381–389.
- Sinha JK, Friswell MI, Edwards S. Simplified models for the location of cracks in beam structures using measured vibration data. J Sound Vib. 2002;251(1):13–38.
- MATLAB R. The language of technical computing (software). Natick, MA: Math Works Inc; 2017a.
- Yoo CH, Lee SC. Stability of structures: principles and applications. Butterworth-Heinemann, Burlington, MA: Elsevier; 2011. p. 171–179.
- Pandey AK, Biswas M, Samman MM. Damage detection from changes in curvature mode shapes. J Sound Vib. 1991;145(2):321–332.
- Cao L, Liu J, Xie L, et al. Non-probabilistic polygonal convex set model for structural uncertainty quantification. Appl Math Model. 2021;89(1):504–518.
- Liu J, Meng X, Xu C, et al. Forward and inverse structural uncertainty propagations under stochastic variables with arbitrary probability distributions. Comput Methods Appl Mech Eng. 2018;342:287–320.
- Liu J, Cai H, Jiang C, et al. An interval inverse method based on high dimensional model representation and affine arithmetic. Appl Math Model. 2018;63:732–743.