
 ?Mathematical formulae have been encoded as MathML and are displayed in this HTML version using MathJax in order to improve their display. Uncheck the box to turn MathJax off. This feature requires Javascript. Click on a formula to zoom.
Abstract
Lightning location is a significant issue in the protection of transmission lines, renewable energy sources, and electrical equipment. In this article, a new technique for the determination of lightning striking points is been proposed. This method is depending on measured values of lightning-induced voltage obtained from distribution power lines in the vicinity of the lightning channel. The proposed method considers lightning location as well as lightning current wave shape at the channel base. It was validated using a number of measured return stroke currents, and the outcomes are debated accordingly. All electromagnetic field components were taken into consideration in the proposed method, and lightning current wave shape was determined in contrast with the other, widely used methods. Evaluated lightning current wave shapes, based on local measured data, can be used to examine and improve existing protection schemes in renewable energy generation farms, transmission lines, and other power sites. Moreover, lightning maps and ground flash density can be obtained from the evaluated lighting location data to be used in lightning risk assessment studies.
Abbreviations
| BG | = | Bruce and Golde model |
| ECM | = | Engineering current models |
| LC | = | Lightning current |
| LEF | = | Lightning electric fields |
| LIV | = | Lightning-induced voltage |
| LL | = | Lightning location |
| MDF | = | Magnetic direction finder |
| MTLE | = | Modified transmission line with exponential decay model |
| MTLL | = | Modified transmission line with linear decay model |
| PSO | = | Particle swarm optimization algorithm |
| TCS | = | Travelling current source model |
| TDOA | = | The time difference of arrival |
| TL | = | Transmission line model |
| TOA | = | Time of arrival technique |
| TOGA | = | Time of group arrival |
| VLF | = | Very low frequency |
Introduction
Protection of power units and power farms against lightning is an important issue. Site selection for power networks and renewable farms needs to consider lightning risk assessment based on lightning maps and ground flash density at the project site [Citation1,Citation2]. Therefore, evaluation of LL and LC wave shape, and development of related data banks can be helpful toward increasing the protection level of existing power sites and designing proper protection schemes for new power stations [Citation3]. Several methods have been proposed and used to evaluate lightning location. These have normally been based on the radiation part of LEF [Citation4–6]. However, they contain inherent errors due to their neglect of other field components and ground effects on propagation fields. The most widely used method can only evaluate current peak or current values within a certain range of frequency when the full shape of the current is a significant issue in both the design of surge protection devices and system performance [Citation7,Citation8]. One of the important challenges for electric field-based methods is measuring electric fields and extracting lightning electric fields from other field pollutants, as they have been used in algorithms(as input data).
In this study, a new method is proposed to evaluate LL as well as the full shape of LC based on measured values of LIV on the distribution lines in the vicinity of the lightning channel. In this method, the measured induced voltage data are used as input data as all field components were taken into account indirectly through induced voltage values. Therefore, lightning at different ranges of radial distance can be considered using the proposed method, in contrast with the widely used electric field-based methods. Likewise, the presented method can evaluate the full shape of LC to prepare the required data for protection and evaluation of system performance in power stations. The proposed method is a voltage-bases algorithm. Measurement of voltage on the distribution line has fewer operational obstacles compared to field-based methods. Moreover, the measuring points can be developed easily on different distribution lines. In this article, the performance of the proposed procedure was evaluated using different recorded return stroke current samples. Results will be analysed and considered accordingly. The fundamental presumptions in this paper are as follows:
Return stroke velocity as a constant value
Lightning as a vertical channel
Lightning branching and its effect are ignored
Ground conductivity is set to the perfect condition
Lightning location systems and inverse procedure algorithms
Several studies that have evaluated lightning location are summarized in .
Table 1. Overview of previous studies on LL systems.
Moreover, different inverse procedure algorithms have been proposed in previous research that considered lightning current wave shape along the channel as listed in Table .
Table 2. Overview on the previous researches on the lightning inverse procedure algorithms.
Proposed method
In order to evaluate LL as well as LC wave shape at the channel base, lightning-induced voltage signals were used in the proposed method as input data. shows the geometry of the problem.
Figure 1. Geometry of the study problem.
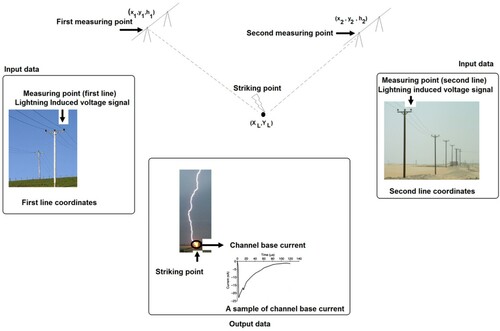
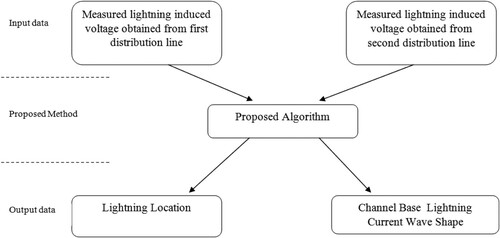
illustrates a block diagram of the study, where in the induced voltage signals were obtained from overhead distribution lines using high voltage probes. They were used in the proposed algorithm that will be presented in the next part. Output of the proposed method was the LL as well as the LC wave shape. Noted that the LC at the channel base (striking point with ground), expressed using various current functions as the sum of two Heilder functions, has been used in this study as presented by Equation (1):
(1)
(1)
where
are the peaks of the LC,
are the front time parameters,
are the decay-time parameters, n is the exponent (the rate is between 2 to10),
Figure 2. Block diagram of the study.
Lightning current at various altitudes along its channel can be expressed using disparate models, e.g. dynamic current models [Citation17,Citation18] electromagnetic current models, distributed circuit models, ECM. In this article, the generic analytical form of the ECM was used as declared in Equation (2):
(2)
(2)
where I(z’,t) is the current function along channel, I(0,t) is the current at channel base, P(z’) is a reduction factor (depending on charge height), z’ is the impermanent charge altitude along the channel, v is the current wave propagation velocity,
is the skyward propagation front velocity, u is the Heaviside function defined as
widely used ECM based on Equation (3), where λ is a decay constant ( km),
is the cloud altitude, c is
, and
is a constant (between c/2 to 2c/3) [Citation19].
Table 3. Parameters of widely used engineering current models [Citation19].
Lightning-induced voltage for each term of Equation (1), based on ECM, can be evaluated from this equation as the observation point is set on an overhead line (Equation 3). It should be mentioned that the sum of two Heidler functions has been used in this study. The induced voltage due to the first and the second terms in Equation (1) can be evaluated by using and (
) in Equation (3), respectively, and the total induced voltage is the sum of two obtained induced voltages from two terms of Equation (1) [Citation20]. Noted that the expressed induced voltage expression is based on Agrawal coupling model.
(3)
(3)
where
is the value of LIV
is division factor (≥2),
is the LEF at the x direction,
is the LEF at the z direction,
is the time step,
is the quantity of time steps,
k is division factor(
),
In order to evaluate LL and LC wave shape using two measured signals of LIV in first and second distribution lines (based on ), the relation between measured signals at different time steps of each measuring point was equal to the corresponding analytical expression as mentioned in Equation (3). and
were defined as the measured, induced voltages in the first and second distribution lines(based on ), respectively. The ratio between measured induced voltage values and the corresponding analytical expressions in the first and second distribution lines were expressed as in Equation (4). Noted that the channel base current function with unbeknown parameters were set as the sum of two Heidler functions, and the analytical expression of LIV consisted of both terms of equation (1). Moreover, the MTLE model, with unbeknown parameters, was set as the current model along the channel. Noted that the MTLE model had been frequently used in previous studies as it could prepare the simulated induced voltage with a proper range of accuracy compared to the corresponding measured one however the current model in this paper can be replaced with other engineering current models(as tabulated in ) [Citation6,Citation21–22]. The coordinates of lightning location were set as unknown parameters, and the ground level effect was ignored in this paper. Equation (4) can be converted to a nonlinear equation system for both measuring stations as expressed in Equation (5):
(4)
(4)
where
(5)
(5)
In Equation (5), the known parameters are and
at different time steps and coordinates in both distribution lines. Moreover, the unknown parameters are those of the current function and model as well as coordinates of the lightning striking points. In order to solve the above-mentioned nonlinear equation system (equation 5), various numerical techniques can be applied. In this research, the PSO was used to solve this system. In this method, the absolute values of the left-hand equations in Equation (5) were set as objectives. The roots of the equation were determined by the PSO algorithm [Citation23,Citation24] to minimize all equations by a multi-objective approach; the main goal of minimization is zero on the right side of Equation (5). Noted that the PSO searching algorithm had been proposed based on the social behaviour of a flock of flying birds during their search for food while the position and velocity of the swarm particles are strangely depend on the cooperative communication among all the particles and each individual’s own experience at the same time. This algorithm had been used in different engineering problems to minimize the objective functions. In order to minimize the function, each PSO particle represents a candidate potential solution with a velocity vector and a position vector. The advantages of this algorithm are insensitive to scaling of design variables, simple implementation, easily parallelized for concurrent processing, very few algorithm parameters and very efficient global search algorithm however it has slow convergence in the local search. The unknown parameters of equation 5 are
Other optimization algorithms of the same approach can be applied to whatever convergence rate of PSO is an acceptable level.
Results and discussion
In order to evaluate and validate the presented method, the following steps had been considered;
First step – Two samples of lightning current (based on measured currents from previous researches) were utilized and the values of lightning-induced voltage at two different distances with respect to striking point were estimated.
Second step – The evaluated induced voltage signals on two different overhead lines were used as input data to the proposed algorithm.
Third step – Lightning location and lightning current were determined by the presented method
Forth step – Both evaluated lightning location and lightning current were compared with the corresponding utilized ones (in first step).
Results are herein discussed accordingly. In the first step, Based on the geometry of problem for first case as shown in , two signals of lightning-induced voltage (from two overhead lines with a 10 m height above the ground surface)were used to feed the proposed method as illustrated in Figures and .
Figure 3. Geometry of problem for first case.
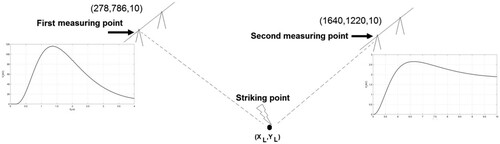
Figure 4. First LIV on the distribution line with a 10 m height (based on first sample of LC).
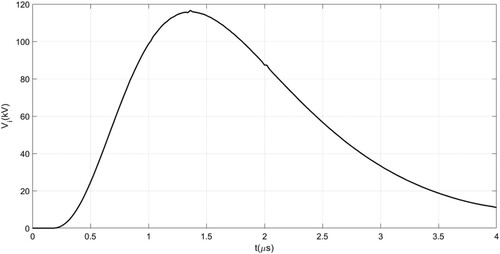
Figure 5. Second LIV on the distribution line with a 10 m height (based on first sample of LC).
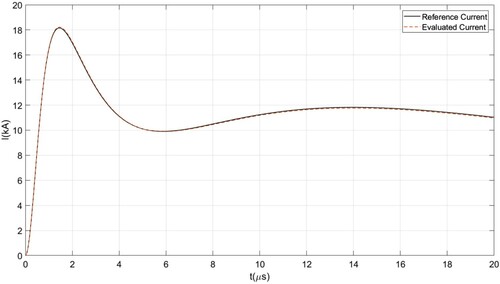
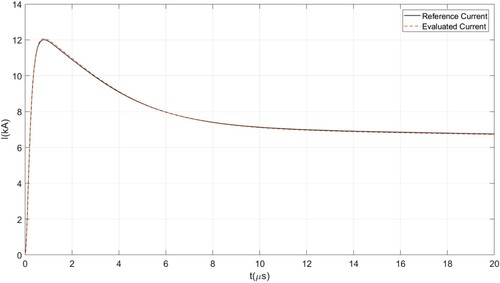
With regard to the coordinates of the measuring stations and the measured values of induced voltage at both stations(as illustrated in Figures and ), the evaluated lightning return stroke current was compared with the corresponding reference one () [Citation22]. Noted that actual current (reference current) was utilized in the first step of validation. The detailed parameters of reference current based on the sum of two Heidler functions (Equation 1) are . Moreover, the lightning location was determined with radial distances of 51.66m and 1502.2m with respect to the first and second stations, respectively (based on ). The error percentage was <1% with respect to actual location. It should be noted that the actual and evaluated lightning locations were (200,800) and (198,799), respectively. In addition, real radial distance with respect to the first measuring station was 50m (248,786) while the actual value for the second station was 1500 m (1640, 1220). In this case, the non linear equations system obtained from Equation (5) (at different time steps) had been solved using PSO method and the current and lightning location parameters had been evaluated. The cost function value at last stage was 0.00002.
Figure 6. Comparison between the evaluated return stroke current and the corresponding reference one based on the first sample of LC.
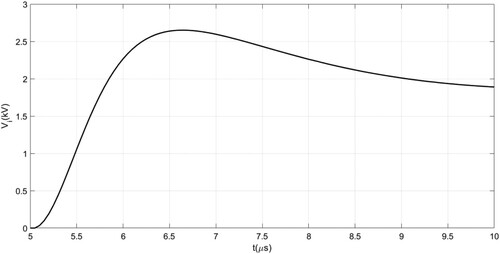
In order to consider the performance of the presented algorithm based on geometry of problem (see ), two other induced voltage signals from the two overhead lines with 7.5 and 10m heights with respect to ground surface were used as input data as demonstrated in Figures and , respectively. Evaluated LC at the channel base and the corresponding reference one are shown in [Citation22]. They were in a good agreement. Moreover, the determined radial distances with respect to the first and second stations were presented as 502.2 and 2499 m, respectively (based on ) The maximum error percentage of <1% was in an acceptable range with respect to previous research. Note that the actual and evaluated lightning locations were (1100, 1500) and (1102, 1499). Likewise, the real radial distances with respect to the first measuring station were 500 m (700, 1800)while the actual value for the second station was 2500 m (3100, 3000). In this case, the cost function value of PSO at last stage was 0.000142.
Figure 7. Geometry of problem for second case.
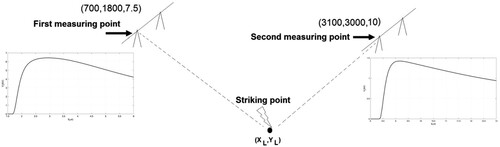
Figure 8. First LIV on the distribution line with a 7.5 m height (based on the second sample of LC).
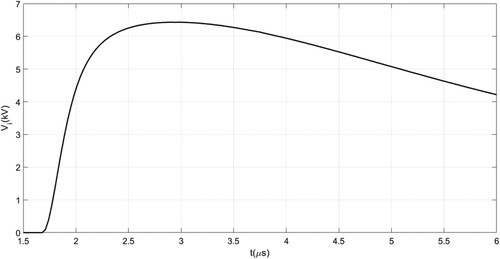
Figure 9. Second LIV on the distribution line with a 10 m height (based on the second sample of LC).
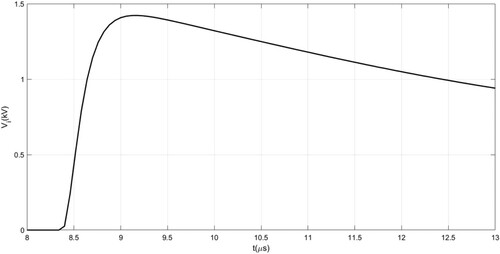
Figure 10. Comparison between the evaluated return stroke current and the corresponding reference one (based on the second sample of LC).
Results showed that the proposed method can evaluate LC wave shape as well as lightning location in an acceptable range of accuracy. The proposed method is based on measured induced voltage from the phase conductor of distribution overhead lines. All field components (static, induction, and radiation) were taken into account indirectly through induced voltage values in tandem with a number of inverse procedure algorithms. These are algorithms that only consider the radiation field component that is effective at far distances to the striking point. In addition, the considered method can evaluate the wave shape of LC straight forwardly in the time domain, at variance with a number of previous studies where the current peak of current values in a certain frequency range were estimated. It should be mentioned noted here that the evaluated LC wave shapes can be helpful in developing lightning protection standards depending on local data. On the other hand, the proposed method is depending on measured LIV from existing distribution lines; given the vastness of distribution networks, the system operation is easily accessible compared with field base methods. The considered method can be applied on a greater number of measuring stations and can be placed in a network throughout the considered district. In this research, Equation (1) was utilized to express the generalized form of LC function. The MTLE current model was applied to present current behaviour at various altitudes along the channel as it maintained a good range of accuracy in previous studies. However, the proposed method is very flexible and other current functions and models can be updated with the same approach.
Conclusion
In this research, a new algorithm is proposed to assign LL and LC at the channel base based on measured LIV on overhead distribution networks (in the proximity to a channel base). The proposed method was evaluated and validated using two samples of return stroke currents. Based on the proposed algorithm, all different components of the field were taken into consideration indirectly through LIV and were used for various spaces with respect to the striking point. Furthermore, it can evaluate the wave shape of LC straightforwardly in the time domain as opposed to the findings in a number of previous studies evaluating current peak or current values in a certain frequency range. The considered method is depending on measured LIV on a distribution line. The system operation is easily accessible compared with field-based methods. This study can be applied to different current models and functions and the obtained results can be used for preparing data banks on lightning flash maps and lightning flash density maps for risk assessment studies. They can also enhance lightning current database preparation to improve existing lightning protection schemes and standards based on local information.
Disclosure statement
No potential conflict of interest was reported by the author(s).
References
- Tan Y, Peng L, Shi Z, et al. Lightning flash density in relation to aerosol over Nanjing (China). Atmos Res. 2016;174:1–8.
- Holland I, Doorsamy W, Nixon K. Computational methodology for lightning risk assessment of small-scale rooftop photovoltaic systems. In 2018 IEEE International Conference on Environment and Electrical Engineering and 2018 IEEE Industrial and Commercial Power Systems Europe (EEEIC/I&CPS Europe), Palermo, Italy, 2018. p. 1–6.
- McDonald JD. Electric power substations engineering. New York: CRC Press; 2016.
- Ushio T, Wu T, Yoshida S. Review of recent progress in lightning and thunderstorm detection techniques in Asia. Atmos Res. 2015;154:89–102.
- Diendorfer G. A review of 25 years of lightning research in Austria from 1991–2015. In World Meeting on Lightning, Cartagena, Colombia, 2016.
- Izadi M, Kadir A, Abidin MZ, et al. Evaluation of lightning current and velocity profiles along lightning channel using measured magnetic flux density. Prog Electromagn Res. 2012;130:473–492.
- Ceclan A, Ţopa V, Micu DD, et al. Lightning-inverse reconstruction by remote sensing and numerical-field synthesis. IEEE Trans Magn. 2013;49(5):1657–1660.
- Ceclan A, Tapa V, Micu D, et al. Return stroke current remote sensing, based on solving an inverse ill-posed problem. In 2012 IEEE International Conference and Exposition on Electrical and Power Engineering, Iasi, Romania, 2012. p. 717-722.
- Li D, Azadifar M, Rachidi F, et al. Analysis of lightning electromagnetic field propagation in mountainous terrain and its effects on ToA-based lightning location systems. J Geophys Res Atmos. 2016;121(2):895–911.
- Li D, Rubinstein M, Rachidi F, et al. Location accuracy evaluation of ToA-based lightning location systems over mountainous terrain. J Geophys Res Atmos. 2017;122(21):11,760–11,775.
- Sun Z, Qie X, Liu M, et al. Lightning VHF radiation location system based on short-baseline TDOA technique – validation in rocket-triggered lightning. Atmos Res. 2013;129:58–66.
- Rakov V. Electromagnetic methods of lightning detection. Surv Geophys. 2013;34(6):731–753.
- Abarca SF, Corbosiero KL, Galarneau TJ. An evaluation of the worldwide lightning location network (WWLLN) using the national lightning detection network (NLDN) as ground truth. J Geophys Res Atmos. 2010;115(D18):P1–11.
- Rachidi F, Rubinsein M. Time reversal of electromagnetic fields and its application to lightning location. 2013 IEEE International Symposium on Lightning Protection (XII SIPDA), Belo Horizonte, Brazil, 2013. p. 378–383.
- Ceclan A, Ţopa V, Andreotti A, et al. Regularization of ill-posed return stroke current identification problem. 2012 IEEE International Conference on Lightning Protection (ICLP), Vienna, Austria, 2012. pp. 1–6.
- Ceclan A, Micu DD, Czumbil L. On a return stroke lightning identification procedure by inverse formulation and regularization. Digests of the 2010 14th Biennial IEEE Conference on Electromagnetic Field Computation, Chicago, IL, USA, 2010. p. 1–1.
- Bizjaev A, Larionov V, Prokhorov E. Energetic characteristics of lightning channel. 20th International Conference on Lightning Protection, Switzerland, Interlaken, Switzerland, 1990. p. 1–1.
- Dubovoy E, Pryazhinsky V, Chitanava G. Calculation of energy dissipation in lightning channel. Meteorol Gidrol. 1991;2:40–45.
- Izadi M, Ab Kadir MZ, Gomes C, et al. Analytical expressions for electromagnetic fields associated with the inclined lightning channels in the time domain. Electr Power Compon Syst. 2012;40(4):414–438.
- Izadi M, Rahman MSA, Ab-Kadir MZA, et al. The influence of lightning induced voltage on the distribution power line polymer insulators. PLoS One. 2017;12(2):e0172118.
- Rachidi F, Tkachenko S. Electromagnetic field interaction with transmission lines: from classical theory to HF radiation effects. Boston: WIT Press; 2008.
- Izadi M, Ab Kadir MZA, Hajikhani M. On the lightning induced voltage along overhead power distribution line. J Elect Eng Technol. 2014;9(5):1694–1703.
- Du K-L, Swamy M. Particle swarm optimization. In: Search and optimization by metaheuristics. Basel: Springer; 2016. p. 153–173.
- Olsson AE. Particle swarm optimization: theory, techniques and applications. New York: Nova Science Publishers; 2010.