
 ?Mathematical formulae have been encoded as MathML and are displayed in this HTML version using MathJax in order to improve their display. Uncheck the box to turn MathJax off. This feature requires Javascript. Click on a formula to zoom.
Abstract
In structural health monitoring, the localization of impact is one of the most basic and challenging problems. However, existing technologies are only suitable for obtaining the impact position of plate structures, which hinder their engineering applications. Here, we propose a new method to study the impact position of complex box structures. The proposed method is based on modal parameters and k-means clustering. The modal parameters under different excitation are extracted by applying repeated impact to different positions of the structure, and then the modal constants are clustered to form the cluster centrrs. When the impact occurs at a certain location, the extracted modal constants can be compared with the clustering centres to determine the impact location. The effectiveness of this method is verified by the impact experiment of the gearbox.
1. Introduction
In recent years, the application of structural health monitoring technology has attracted noticeable attention in civil, marine, aerospace, and other industries. Localization of the impact source is an important problem in structural health monitoring [Citation1–3]. Many studies have been involved in these issues, and some fruitful results have been achieved about the simple structures such as plates and beams. However, for complex structures such as box structures, there is no good solution.
In localizing the impact force, the time of arrival (TOA) approach [Citation4–6] is one of the first techniques, which mainly focuses on beams and plates. The sensors are arranged reasonably on the structure, and the source positions are estimated according to the time difference when the waves arrive. However, the stress waves caused by impact are dispersive in complex structures, which will affect the accuracy of the impact location. Zhao et al. [Citation7] used the time–frequency analysis characteristics of wavelet transform to obtain the shortest path arrival time for different frequency contents of the signal. In Refs. [Citation8, Citation9], the impact imaging method based on time reversal focusing is used to estimate the impact location of composite structures. In addition, the development of artificial intelligence techniques has led to their application in the localization of impact forces. Hossain et al. [Citation10] presented a time-domain feature to identify impact locations using Multilayer Perceptron. This feature is based on the minimum arrival time (MAT) of surface wave at a particular location of an object due to impact. The minimum arrival time is invariant to ambient noises and variant to impact-sensor distance, which makes it become a effective feature for identifying impact locations. In [Citation11], a novel time of arrival extraction method was proposed. It is based on Normalised Smoothed Envelope Threshold (NSET) coupled with a high pass filter to remove vibration noise prior to TOA extraction. By using the proposed method for TOA extraction, the trained artificial neural network is able to better predict the location of impacts compared to an artificial neural network trained with data from common TOA extraction methods. The above methods are the combination of TOA and Artificial Neural Networks methods to achieve better accuracy, but they are not suitable for complicated structures because the determination of the exact propagation path of stress waves in structures with complex shapes is difficult. In addition, genetic algorithm [Citation12], and the particle swarm optimization method [Citation13] have been used to estimate the impact location. Although the positioning results are impressive, their research subjects are confined to one-dimensional or two-dimensional plate structures.
As the second kind of inverse problem in structural dynamics, the identification of impact force is still a challenging inverse problem, since the small noise in measurements can lead to a large fluctuation in the true solution. Tikhonov regularization method [Citation14,Citation15], truncated singular value decomposition method [Citation16,Citation17], and sparse regularization method [Citation18–20] can effectively reduce the ill-posed problem of load reconstruction and improve the accuracy of dynamic load identification. However, force location is extremely difficult to tackle by using inverse methods [Citation13]. To tackle both localization and time reconstruction problems simultaneously, Qiao et al. [Citation21] proposed a sparse regularization method based on minimizing l1-norm to identify the location and the time history of the impact-force acting on the rectangular plate and the shell structure. Besides, Aucejo et al. proposed the time–space regularization method [Citation22] and Bayesian regularization method [Citation23,Citation24] to address these issues, but the structures under tests are the plate.
The pattern matching technology is also used to determine the impact location. Shin et al. [Citation25] proposed a group delay based location template matching (G-LTM) method, which can accurately identify the impact force applied on a suspended aluminum plate even in the case of a small grid spacing (1 cm). Kalhori et al. [Citation26] proposed the cosine similarity searching (CSS) method to identify the impact force, which can automatically detect the most probable location. Qiao et al. [Citation27] used the discrete cosine transform method to accurately identify the position of unknown forces. Qiu et al. [Citation28] proposed a novel scheme based on the pattern recognition method combined with the similarity metric in the time domain to determine the position of unknown impact loads. Although the results are encouraging, it has not been seen that pattern matching method is used to estimate the impact location of complex structures. The pattern matching technology is an effective method to estimate the impact position, and reasonably establishing the relationship between the measured signal and the reference signal is the key factor for amethod.
The different modes of vibration can be excited by impact, so the use of modal characteristics is another research direction of impact location. Kawabata et al. [Citation29] optimized the position of the stress sensor based on low-order vibration modes, and determined the location and the time history of the impact force applied on the aluminum using the optimized modal displacement. Abdul et al. [Citation30] estimated the impact force on the perspex plate by using the operating deflection shape analysis, modal analysis, and the modal transformation method. Wang et al. [Citation31] adopted the method of modal assurance criterion to judge the impact position by judging and estimating the correlation between theoretical and practical modes. However, theoretical modal analysis of the structure is required, otherwise, some false predicted locations may occur. Briggs et al. [Citation32] proposed a method based on modal analysis and pattern matching to estimate the impact force of the hard disk drive. In the study, the position of the simple scale was connected with the vibration mode, and the modal constants are used as a database. The extracted modal constants are compared with the database to determine the position of the impact, and results show that the method can effectively estimate the impact position and impact force. The value of the method is that it uses pattern matching on the most appropriate variable (modal constants) to identify impact location. However, although the vibration mode of the structure depends on the structure itself and the boundary conditions, it should be noted that the modal constants extracted from the structure at the same impact position are often slightly different, which leads to the poor robustness of the method, especially when the structure is large and complex.
In the majority of the aforementioned methods, it is difficult to locate the impact force of complex structures. Hence, in this paper, we propose a method based on modal parameters extraction and K-means clustering to determine the impact position. Distinct from previous reports, we are committed to the study of the impact location of complex structures. The method is used to estimate the four impact locations of the gearbox, and the robustness of this method is shown by comparing it with the G-LTM method [Citation25] and the CSS method [Citation26]. This paper is structured as follows. Section 2 details the theory of our proposed method. The experimental verification is provided in Section 3. The discussion and conclusion are drawn in Sections 4 and 5, respectively.
2. Theory
Structures with many vibration modes can be modeled as a summation of different modes, i.e.
(1)
(1) where
is the frequency response function, and
is Fourier transform of the acceleration signal.
is Fourier transform of the impact force, and
represents the impact location. The structural vibration data obtained from the experiments can be fit to this form of the equation using curve-fitting procedures developed for modal testing. In the modal analysis, is usually replaced by the modal constants
, so the frequency response function of the system is determined by the modal constants
, the loss factor
, and the natural frequency
for each mode of vibration r. Converting the transfer function to the summation of modes can simplify the description of the structure at a large level. To identify the impact, it is necessary to establish the modal model of the structure to be measured. This means that it is necessary to determine all the variables in the frequency response function for each position k on the structure where the impact may occur.
When the input force is described as the impact force, the input identification problem is simplified. The force produced by impact can be reasonably expressed as the half-sine pulse or triangular pulse in the time domain. If the force input is a short duration pulse, i.e. an impact, then the force is nearly a constant in the frequency domain. [Citation32]
When f(ω) is a short-term impact force, it approaches a constant in the frequency domain. EquationEq. (1)(1)
(1) can be written as follows:
(2)
(2) here,
is the uncorrected modal constants, because they must be divided by force f(ω) to get the correct modal constants.
The modal constants form a pattern from the vibration signal which is dependent on the location of impact when the frequency of the impact force does not change greatly. It must be noted that the modal constants extracted from the structure at the same impact position are often slightly different, so we use the K-means clustering method to cluster the modal constants excited by repeated impact. The basic process is shown in Figure .
Figure 1. Outline of the proposed method.
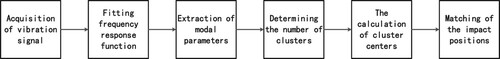
First, the acceleration signal is recorded and transformed into the frequency domain. The frequency response function is obtained by curve fitting. Then calculate the number of clustering centres. The K-means clustering method is used to cluster the modal constants excited by repeated impact, and multiple clustering centres are formed. Finally, the extracted modal constants are compared with each cluster centre. The pattern of the clustering centre, which is most similar to the extracted pattern, determines the most likely location of impact.
2.1 Extraction of modal parameters
2.1.1 Orthogonal polynomial curve fitting
In general, a linear system can be constructed for the mechanical structure under impact, as shown in Figure .
Figure 2. The linear system.
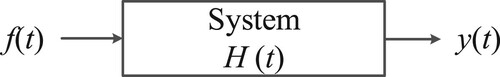
where is the input force, and
is the output.
is the transfer function.
The basic idea of the orthogonal polynomial curve fitting method is to use the estimated frequency response function to construct the error between the theoretical and measured frequency points. When the error value is minimum, we can get the polynomial coefficients and the fitted frequency response function.
For a complete set of modes, the transfer function of an N-degree of freedom system can be expressed as:
(3)
(3) where
and
denote the coefficients of orthogonal polynomials, and
denotes orthogonal polynomials. The uncorrected modal constants
, the loss factor
, and the natural frequency
can be obtained by curve fitting [Citation33] with the above model.
2.1.2 Determination of the model order
The frequency response function is estimated from the experimental signal, so it is necessary to extend the order of the model to improve the fitting accuracy in the process of recognition. If the model order is higher than the real model order of the system, false modes will appear. Herein, we use the least square total variance method to determine the appropriate order of the model. By determining the order of the model, false modes can be avoided in the analysis results.
(4)
(4) in which, n is model order,
is the frequency response function curve fitted by the n-order model, Ijkn(ω) is the estimated frequency response function curve, and K is the length of the frequency response function.
(5)
(5)
If there exists the order to make the EquationEq. (5)
(5)
(5) hold, then
is taken as the final model order.
2.2 Estimation of impact location
2.2.1. K-means clustering
K-means clustering [Citation34] is the famous partitioning clustering algorithm, which is widely used among all clustering algorithms due to its simplicity and efficiency. Different clustering centres represent different data characteristics, while the responses of different impact locations have different characteristics. Therefore, K-means clustering can be used to cluster the responses of different impact locations to determine the following impact locations. After extracting the appropriate vibrational modes of repeated impact, the modal constants are clustered. The modal constants have been proved to be an effective index in Ref. [Citation32], but the method is to match the newly extracted modal constants with the set reference modal constants, which may lead to wrong matching due to the accidental selection of reference samples. The improved method in this paper is to take the modal constants as the clustering sample Ji, and take the clustering centres as the reference of the impact location. Cluster samples are represented as:
(6)
(6) K-means clustering algorithm [Citation34] is an iterative clustering analysis algorithm. The steps are given as follows:
Random selection of k objects as the initial clustering centre
;
Calculate the Euclidean distance
For each sample assigned, the cluster centre will be recalculated according to the existing objects in the cluster;
Repeat the above process until no objects are reassigned to different clusters, the cluster centre does not change, and the sum of squares of errors is minimal locally.
2.2.2 Determination of the optimal clustering number
When the structure is subjected to repeated impact from different locations, it is necessary to obtain information about the number of impact locations, i.e. the initial number of clusters set in the clustering algorithm. Herein, the Davies-Bouldin index (DBI) [Citation35] is used as an index of the quantitative clustering number. The Davies-Bouldin index, also known as the classification accuracy index, is an index proposed by David and Bouldin to evaluate the clustering algorithm.
(8)
(8) Different numbers of classifications can lead to different DBI values. The smaller the DBI, the better the classification effect.
(9)
(9) where Si indicates the degree of scatter of data points in class
, Ai represents the centre of class
,
represents the number of data points in class
.
represents the distance between class
and class j, The formula is given as follows:
(10)
(10) where
represents the value of the k-th attribute of the centre point of class
.
2.2.3 Matching of the impact location
The pattern formed by the extracted modal constants can be compared with each pattern in the clustering centres to determine the impact location. A reasonable similarity index is the correlation coefficient, i.e.
(11)
(11) where JiN is the latest data sample, and CiN is the clustering centres.
is the covariance of *, and
is the variance of *. For the proposed method, the impact location is estimated by finding the maximum value r(JiN, CiN) among all the combinations of JiN and CiN.
3. Experimental validation
3.1 Experimental device and the impact points
It is obviously not feasible to describe the location of a single dimension for determining the impact locations of a complex structure. Since most of the impact loads come from a few key positions such as the bearing seat, the modal constants of the impact at key positions can be clustered and used as a reference to determine the impact at unknown locations. Taking the gearbox as the experiment object, the main material of the gearbox is gray cast iron. The maximum size of it is 1080mm485mm
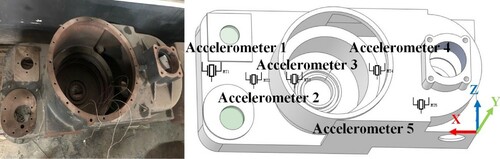
595 mm, and the weight is 274 kg. Five accelerometers are randomly distributed on the structure, and only one accelerometer is used to extract the modal parameters every time. Here we use the signal of accelerometer 5 to extract the modal parameters. The selection of this accelerometer will be givenin 3.3.2.
The vibration signal acquisition equipment includes the computer, B&K 3050-A-60 high-speed data acquisition card, B&K 4508B accelerometers, the impact hammer (Type 8206-002) with a stainless steel tip, and Labshop analysis software. The forcing frequency range is 0-1200 Hz. The sampling frequency is 5.12 kHz, and the frequency resolution is 0.625 Hz. During the experiment, four impact points on the gearbox are hammered by the impact hammer (B&K), as shown in Figure . The acquisition point of the vibration signal is shown in Figure .
Figure 3. The location of impact points.
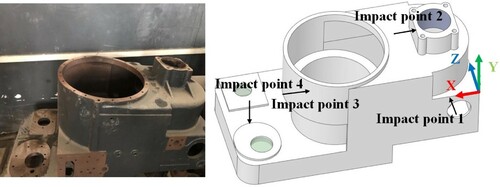
Figure 4. The location of the accelerometers.
3.2 Extraction of modal parameters
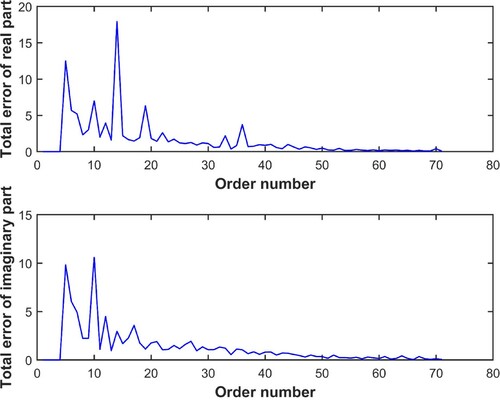
An impact hammer is used to impact the structure at the same position for 20 times, and the modal parameters are extracted from the frequency response function obtained by curve fitting. To improve the accuracy of curve fitting, the order of the model is extended. The order is calculated from 5, and the threshold value δ is set to 0.1. Since the amplitude of frequency response function in the high frequency part is small, and at the same time, 500 Hz is the 12th order frequency of the box. Considering the accuracy of orthogonal polynomial fitting, we use the frequency part less than 500 Hz for curve-fitting. According to Figure , we can see that with the increase of order, the fitting error of the real part and the imaginary part decreases until convergence. When the threshold value is 0.1, the convergence order is 71.
Figure 5. The error curve of the real part and the imaginary part of the frequency response function.
According to Figure , we can see the fitting results of the real part and the imaginary part of the frequency response function produced by hammering at four different points. It can be seen that the measured frequency response functions of different impact points have some differences, which verifies the basic principle of impact location in this paper. The fitting frequency response curve is basically consistent with the measured curve, which verifies the fitting accuracy of the orthogonal polynomial method. Through the above calculation, the modal constants are obtained, as shown in Figure .
Figure 6. Fitting results of the real part and the imaginary part of the frequency response function under different impact points.
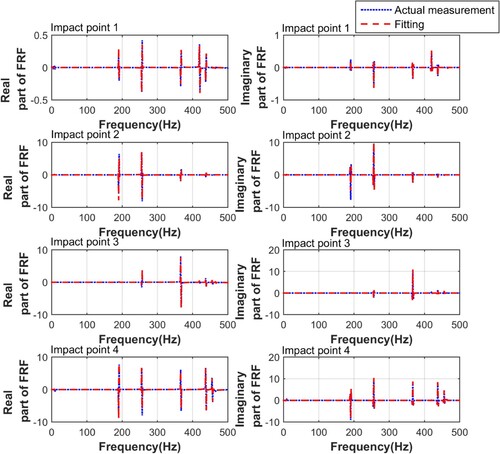
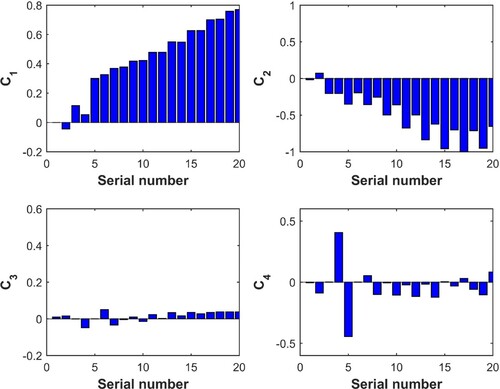
Figure 7. Modal constants of different impact locations.
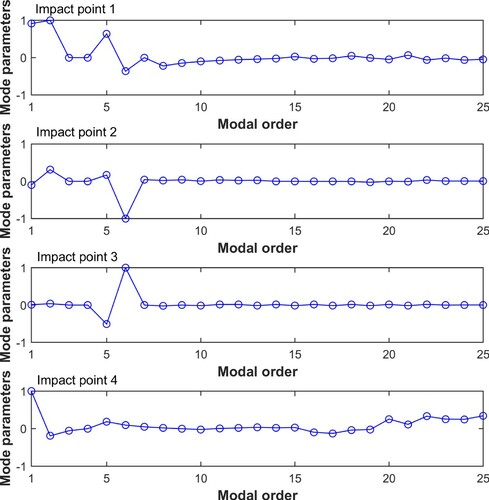
From Figure , we can see that modal constants are quite different, which can serve as the reference. To improve the computational efficiency, the first 20 order modal constants are taken as clustering samples.
3.3 Clustering of parameters
3.3.1 Determination of the optimal cluster number
For the four defined impact points, each point is impacted 20 times, a total of 80 groups of data. The DBI value of the sample data is calculated, the result is shown in Figure .
Figure 8. The DBI values for different cluster Numbers.
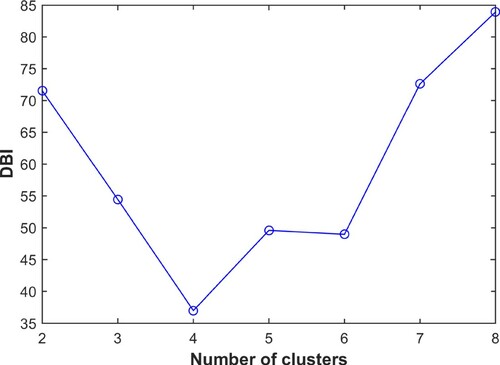
From the definition of DBI value, we can know that the smaller the DBI value is, the more reasonable the clustering number is. In Figure , the minimum DBI value is 4, which is consistent with the preset number of impact locations. Therefore, the DBI index value can be used as an effective method to determine the optimal number of clusters.
3.3.2 The results of K-means clustering
To make full use of all the information, four impact position categories {1,2,3,4} are set up. Modal constants are extracted from 5 accelerometers and input into the clustering algorithm to see whether each sample is at the pre-set impact position. The clustering results are shown in Figure .
Figure 9. Classification results of modal constants extracted from five groups of accelerometer signals.
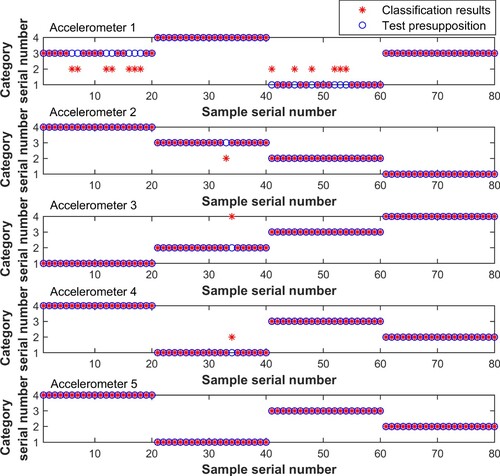
The results of 5 accelerometers can basically accurately classify the categories of pre-set impact position. The highest classification accuracy of the results collected by accelerometer 5 is 100%. In 80 groups of samples, the results collected by accelerometer 1 can accurately classify 67 groups, and the classification accuracy is the lowest (83.75%). The accuracy of other accelerometers is 98.75%, with only one sample error. It can be concluded that the positioning accuracy is related to the placement of accelerometers, and the optimal location needs to be determined based on experience or the placement of more accelerometers.
The clustering centres of four location categories are shown in Figure , and used as the reference sample for the subsequent impact location.
Figure 10. The clustering centres of modal constants.
3.4 Matching of impact location
To verify the validity of the above four clustering centres as the reference modes, the original four impact locations are hammered and the modal parameters are extracted. The correlation coefficients between the newly extracted modal constants and the clustering centres are calculated, as shown in Figure .
Figure 11. The correlation coefficients between the modal constants extracted by the latest impact and the clustering centres.
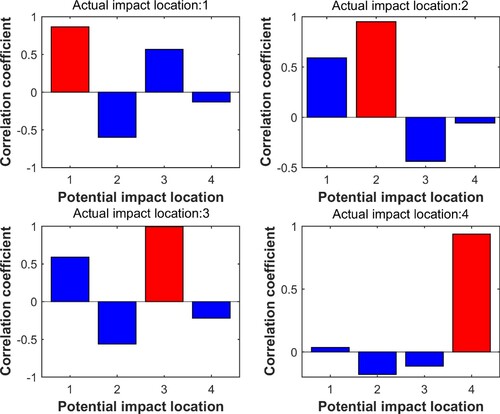
According to Figure , the correlation coefficients between the modal constants extracted from the four latest impact responses and the cluster centres at the corresponding locations are the largest, almost all close to 1. These results show that the similarity calculation is correct for the location matching of the new impact. For subsequent impact or change of impact location, the location can be identified according to the above method.
4. Discussion
The experimental results show that the method is effective in identifying the impact position of the gearbox. The value of this method is that it uses appropriate variables to cluster and form cluster centres, and then uses the pattern matching method to identify the impact location of complex structures.
We carried out the experiments to verify the performance of the proposed method by comparing it with the G-LTM method [Citation25] and the CSS method [Citation26]. G-LTM, CSS, and the proposed method belong to the database reference methods, which match the features of an impact wave to a database of previously known impact wave features measured at different impact points. At the same time, G-LTM and CSS are excellent methods in the database reference methods, which are more suitable for determining the impact position of complex structures. In Section 3.2, 4 impact points have been defined and each point was impacted 20 times, i.e. 80 sets of samples have been generated. In the comparison of various methods, we use these data as reference samples. For statistical convenience, the reference signals of each method are x1(t), x2(t), x3(t), x4(t), which correspond to the impact points 1, 2, 3, and 4, respectively. These predefined points are re-impacted and named as measured signals y1(t), y2(t), y3 (t), y4 (t).
First, we use the method of Ref. [Citation25] to determine the position of the above four impact points. The standard deviations of the group delays between reference signals xi (t) and measured signals yi(t) are summarized in Table . The impact location can be found by searching a pair of xi (t) and yi(t) that has the minimum variance of the group delay across the frequency axis. We found that the G-LTM method can only correctly identify two impact locations in four trials, and the correct identification locations are underlined (the standard deviation of group delay is the smallest). In the incorrect identification locations, the group delay between x4 (t) and y2(t) is 0.00664, which is the smallest across the second case (y2). The group delay between x1 (t) and y3(t) is 0.00881, which is the smallest across the third case (y3). In the correct identification positions, we also find that the variance of group delay difference between them is relatively small. For example, the minimum value of y1 is 0.00553, while the second minimum value is 0.00634, which is very close to the minimum value.
Table 1. Standard deviations of the group delays between the reference signals xi and the measured signals yi.
Although the impact force hits at the same impact point, the uncertainty of stress wave propagation in complex structures may lead to different response signals for each impact, which makes the G-LTM method has poor performance.
Besides, we use the SCC method to find the actual impact position based on measuring the cosine of the angle between the measured force vectors and the reference force vector. The value range of the cosine of the angle is [−1,1]. The largest value of cosine among all measured forces corresponds to the most probable impact location. Their results are listed in Figure .
Figure 12. The cosine similarity indices for all investigated cases.
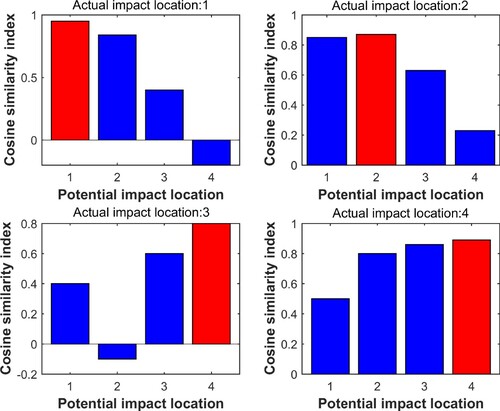
From Figure , we can see that this method is not very effective. One of the four positions is misjudged. Although the locations of the three impact forces are correctly identified, many potential cosine similarity indexes are bigger than 0.8.
According to Table , the impact location can be found by searching the maximum correlation coefficient between the clustering centres Ci and the newly extracted modal constants . we can see that the proposed method can correctly identify all the impact locations, which verifies the performance of this method in identifying complex structures. Moreover, compared with the above two methods, it can be found that the proposed method is less affected by the uncertainty factors. For example, the maximum correlation coefficient in each case is bigger than 0.86, while the correlation coefficient of the wrong impact location is less than 0.60. This proves the robustness of the proposed method.
Table 2. The correlation coefficients between the clustering centres Ci and the newly extracted modal constants .
To further check the accuracy of the proposed method, the same experiments are carried out several times. Nine sets of four measured signals, i.e. 36 trials, are investigated. The results are shown in Table . We find the proposed method perfectly identifies for all 36 trials, while 20 trials can be identified by the method of CSS. The number of successful of the G-LTM method is only 15 out of 36 trials.
Table 3. Comparison of three methods.
Although the impact trials of the gearbox show the advantages of the proposed method, the disadvantages also exist. First, the proposed method needs a lot of preliminary work to obtain the clustering centre of each impact position. However, once the reference sample is properly constructed, the process of estimating the impact location is simple and easy to implement in practice. Secondly, it is necessary to excite the appropriate vibrational modes. Finally, the proposed method can also identify the impact location far away from the pre-impacted point, but the accuracy is not high. The correlation coefficient between the newly extracted modal constants and the cluster centres will be low, but higher than that of other locations.
5. Conclusions
In this paper, a method based on modal parameters extraction and K-means clustering is proposed, which is not limited to the estimation of the impact position of beams and plates. The essence of this method is to cluster the modal constants extracted from repeated impact at different locations, and to use the cluster centres as the reference for the location of subsequent impact. The impact experiment of the gearbox is employed to validate the effectiveness of the proposed method by comparing it with two existing methods. By comparison, it can be concluded that the proposed method can identify the impact location for complex mechanical structures, and performs far better than two existing methods in terms of the accuracy of identifying the impact locations. Therefore, it is expected that the proposed method can be applied to the identification of the impact positions on the engineering structures.
Acknowledgments
This work was supported in part by the Science and Technology Base and Talents Special Project of Guangxi Province under Grant AD19259002, in part by the Natural Science Foundation of Guangxi under grant number2018GXNSFAA180206 and grant number2018GXNSFAA281312, and in part by the National Natural Science Foundation of China under Grant 51365006.
Disclosure statement
No potential conflict of interest was reported by the authors.
Additional information
Funding
References
- Yan G, Sun H, Büyüköztürk O. Impact load identification for composite structures using Bayesian regularization and unscented Kalman filter. Struct Control Heal Monit. 2017;24:e1910.
- Yan G. A Bayesian approach for impact load identification of stiffened composite panel. Inverse Probl Sci Eng. 2014;22:940–965.
- Atobe S, Nonami S, Hu N, et al. Identification of impact force acting on composite laminated plates using the radiated sound measured with microphones. J Sound Vib. 2017;405:251–268.
- Hajzargerbashi T, Kundu T, Bland S. An improved algorithm for detecting point of impact in anisotropic inhomogeneous plates. Ultrasonics. 2011;51:317–324.
- Atobe S, Hu N, Fukunaga H. Real-time identification of impact force on plates using experimental transfer matrices. Japan Soc Aeronaut Sp Sci. 2012;60:48–55.
- Thiene M, Galvanetto U. Impact location in composite plates using proper orthogonal decomposition. Mech Res Commun. 2015;64:1–7.
- Zhao G, Hu H, Li S, et al. Localization of impact on composite plates based on integrated wavelet transform and hybrid minimization algorithm. Compos Struct. 2017;176:234–243.
- Ciampa F, Meo M. Impact detection in anisotropic materials using a time reversal approach. Struct Heal Monit An Int J. 2012;11:43–49.
- Qiu L, Yuan S, Zhang X, et al. A time reversal focusing based impact imaging method and its evaluation on complex composite structures. Smart Mater Struct. 2011;20:105014.
- Hossain M S, Ong Z C, Ng S C, et al. Inverse identification of impact locations using multilayer perceptron with effective time-domain feature [J]. Inverse Probl Sci Eng. 2018;26:443–461.
- Seno A H, Khodaei Z S, Aliabadi M HF. Passive sensing method for impact localisation in composite plates under simulated environmental and operational conditions [J]. Mech Syst Signal Process. 2019;129(AUG.15):20–36.
- Yan G, Zhou L. Impact load identification of composite structure using genetic algorithms. J Sound Vib. 2009;319:869–884.
- El-Bakari A, Khamlichi A, Jacquelin E, et al. Assessing impact force localization by using a particle swarm optimization algorithm. J Sound Vib. 2014;333:1554–1561.
- Amiri A K, Bucher C. Derivation of a new parametric impulse response matrix utilized for nodal wind load identification by response measurement. J Sound Vib. 2015;344:101–113.
- Wang L, Cao H, Xie Y. An improved iterative Tikhonov regularization method for solving the dynamic load identification problem. Int J Comput Methods Eng Sci Mech. 2015;16:292–300.
- Dykes L, Reichel L. Simplified GSVD computations for the solution of linear discrete ill-posed problems. J Comput Appl Math. 2014;255:15–27.
- Chen Z, Chan THT. A truncated generalized singular value decomposition algorithm for moving force identification with ill-posed problems. J Sound Vib. 2017;401:297–310.
- Qiao B, Zhang X, Gao J, et al. Sparse deconvolution for the large-scale ill-posed inverse problem of impact force reconstruction. Mech Syst Signal Process. 2017;83:93–115.
- Qiao B, Liu J, Liu J, et al. An enhanced sparse regularization method for impact force identification. Mech Syst Signal Process. 2019;126:341–367.
- Qiao B, Mao Z, Liu J, et al. Group sparse regularization for impact force identification in time domain. J Sound Vib. 2019;445:44–63.
- Qiao B, Zhang X, Gao J, et al. Impact-force sparse reconstruction from highly incomplete and inaccurate measurements. J Sound Vib. 2016;376:72–94.
- Aucejo M, De Smet O, Deü J-F. On a space-time regularization for force reconstruction problems. Mech Syst Signal Process. 2019;118:549–567.
- Aucejo M, De Smet O. On a full Bayesian inference for force reconstruction problems. Mech Syst Signal Process. 2018;104:36–59.
- Aucejo M, De Smet O. An optimal Bayesian regularization for force reconstruction problems. Mech Syst Signal Process. 2019;126:98–115.
- Shin K, Yang H, Lee S-K, et al. Group delay based location template matching method for the identification of the impact location on a plate. J Sound Vib. 2013;332:2111–2117.
- Kalhori H, Alamdari MM, Ye L. Automated algorithm for impact force identification using cosine similarity searching. Measurement (Mahwah N J). 2018;122:648–657.
- Qiao B, Chen X, Luo X, et al. A novel method for force identification based on the discrete cosine transform. J Vib Acoust. 2015;137:051012–051012.
- Qiu B, Zhang M, Xie Y, et al. Localisation of unknown impact loads on a steel plate using a pattern recognition method combined with the similarity metric via structural stress responses in the time domain. Mech Syst Signal Process. 2019;128:429–445.
- Kawabata N, Hayata H, Hu N, et al. Modal measurements using strain sensors and application to impact force identification. In: Inverse problems in engineering mechanics IV. Nagano, Japan: Elsevier; 2003. p. 85–94.
- Abdul Rahman AG, Yee KS, Ismail Z, et al. Impact force identification using the modal transformation method in collocated and non-collocated cases. J Mech Eng Sci. 2014;6:968–974.
- Wang B-T, Chiu C-H. Determination of unknown impact force acting on a simply supported beam. Mech Syst Signal Process. 2003;17:683–704.
- Briggs JC, Tse M-K. Impact force identification using extracted modal parameters and pattern matching. Int J Impact Eng. 1992;12:361–372.
- Rossing TD. Modal analysis. In: Springer handbook of acoustics. New York, NY: Springer; 2014. p. 1165–1177.
- Hartigan JA, Wong MA. Algorithm AS 136: A K-means clustering algorithm. Appl Stat. 1979;28:100.
- Davies DL, Bouldin DW. A cluster separation measure. IEEE Trans Pattern Anal Mach Intell. 1979;PAMI-1:224–227.