
 ?Mathematical formulae have been encoded as MathML and are displayed in this HTML version using MathJax in order to improve their display. Uncheck the box to turn MathJax off. This feature requires Javascript. Click on a formula to zoom.
ABSTRACT
In advanced railway systems, electricity is supplied to train through sliding contact of pantograph and power-transmission catenary, which causes continuous wear of transmission wire in pantograph-catenary system (PCS). It is of crucial to monitor wear to ensure the safety and smooth operations of electric trains in terms of precision and efficiency in services. This work has developed a novel inverse procedure that uses measurable mechanical quantities to predict and monitor contact wire wear regardless of whether pantograph passes. The inverse technique is based on rigorous mechanics principle and verified by numerical simulation. Three-dimensional (3D) finite element models (FEM) of PCS is first established to simulate both static mechanics behavior and dynamic contact process during sliding. A useful relationship between wear-level and displacement or contact force has been established through static studies. Intensive nonlinear dynamic contact analysis of PCS is then performed and found that the wear-level relates strongly to displacement variation of collector head, so as to devise an inverse procedure between those two when the train is running. In addition, simple formulae are derived by curve-fitting to estimate wire-level based on either static or dynamic measurements, for easy real-time applications of the results from our 3D FEM study.
Introduction
Catenary is a system that is arranged above the rails along the railway to provide energy to the locomotives, and is the only power supply equipment to ensure the operation of trains in the electrified high-speed railway [Citation1]. It has been in service since it was put into use, inevitable performance changes such as mechanical damage, insulation aging, and excessive temperature rise [Citation2] have caused it to be more prone to failure than other equipment [Citation3]. Pantograph-Catenary system (PCS) is the most reliable power supply method for electric locomotives, the contact wire directly contacts the pantograph installed on the top of the moving train to supply power [Citation4]. This high-speed sliding contact will cause varying degrees of wear on contact wire and collect strip of pantograph, which brings hidden dangers to the operation of train [Citation5]. However, the wear of collect strip is usually easy to check and can be replaced in time [Citation6, Citation7]. The catenary has an amazing span distance and aspect ratio according to the track laying distance, and always maintains a high suspension height, making it extremely difficult to monitor its health status. Compared with the change of geometric parameters of catenary, the wear measurement of contact wire is more difficult, because the change of wear amount is quite small.
Some research has been reported on detection of the wear-level or extent of wear of the contact wire. By establishing a functional relationship model between the wear cross-sectional area and the law of temperature change, infrared technology can be used to detect the wear of the contact wire [Citation8–10]. However, temperature changes in the actual environment will have a greater impact on this method. Another method of establishing an artificial neural network model by measuring related parameters can also infer the wear of the contact wire, which has higher measurement accuracy and lower measurement difficulty [Citation11, Citation12]. In addition, the degree of contact wire wear can also be extracted from the analysis of a large amount of historical data [Citation13, Citation14]. However, this method is still in the stage of theoretical verification and requires a large amount of data to train the prediction model to improve the accuracy of the model.
The most commonly used detection methods are still image processing technology [Citation15–20] and laser reflection measurement [Citation21, Citation22]. Amongst MEDES [Citation23, Citation24] in Spain and ATON [Citation25] in the Netherlands are both based on image processing technology, and the ground surface width detection method based on image processing will be affected by environmental factors such as weather conditions and light. It requires light compensation, and due to the delay of image processing, real-time performance is low. Another laser detection method mainly uses the correlation between laser reflection duration and wear width, such as the laser measurement device used by Japanese railways [Citation26]. The wear of the contact wire can be calculated by the duration of laser reflection. The calculation of this method is relatively complicated, it requires more equipment to be installed on the roof of the vehicle and takes up a large space, and the stability of the laser emitting device will affect the accuracy of the result, so it has not been widely used.
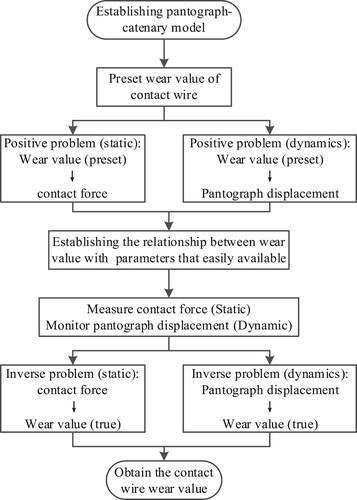
In summary, the existing detection methods have certain limitations. The rapid development of high-speed railways urgently needs a fast, high-precision, high-reliability, and low-cost high-speed railway contact wire detection method. This paper proposes a real-time method for prediction and monitoring wear-level of electric wires in PCS, the overall flow chart of the method is shown in Figure . By measuring the displacement or the forces in either static or dynamic situation, the wear-level can be accurately identified, through an inverse analysis procedure [Citation27, Citation28]. It provides an effective means for real-time monitoring of the wear-level without disruption of the train operations.
Figure 1. Overall flow diagram of the inverse calculation method to monitoring the wear value of contact wire.
The paper is organized as follows: Section 2 provides an updated overview of the pantograph-catenary system for power transmission. Section 3 deals with the finite element modelling of the pantograph-catenary system. Section 4 explores in detail the mechanical inversion study of the wear of the contact line when the train is in different states. Finally, Section 5 draws some conclusions and looks forward to needs for further research.
Pantograph-catenary system for power transmission
The PCS is a most basic, crucial and indispensable facility for power supply in electric railway systems, and is widely used in all advanced railway mass transportation systems in all most all countries. Pantograph is a power receiving device installed on the roof of the trains. It is designed to allow a steady sliding contact with the contact wire for the transmission of electrical current to the running train. The catenary is a solid frame structure supporting the contact forces from the wire in a well-designed with appropriate suspension to avoid extreme contact forces. Model of the mechanical behaviour of the PCS is the key to developing any technically viable devices that can monitor the working states of the system[Citation29]. Our study started with a careful field visit and examination on the actual implementation of such a PCS at a railways station near Tianjin, China.
The structure of the catenary
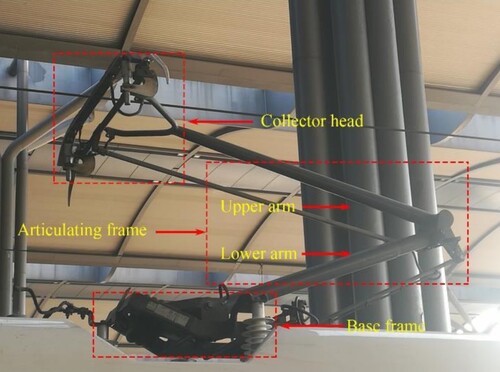
The overhead catenary system is fixed on land and installed along the railways (hence it is a rather expensive installation). It is a sophisticated interconnected system, consisting of a support structure and a cable section, as shown in a photo given in Figure . The support device suspends various types of cables at appropriate locations. The cable section is composed of messenger wire, contact wire and droppers. Messenger wire is fixed by the bracket, and the self-weight of the contact wire is sustained by the distributed droppers. The detailed structure of the catenary differs from system to system, but the major concept can components are largely the same. The catenary used in this study consists of cables of only messenger wire, contact wire and droppers. The detailed layout of the catenary for our computer models is shown in Figure . It is seen that the contact wire and messenger wire are purposely designed not in the same vertical plane, instead, the former is in a zigzag pattern along the track, so that the contact wire imposes pressure on the pantograph at various points to allow uniform wear of a collector strip on the pantograph [Citation30]. The contact wire has a specific cross section as shown in Figure to facilitate the proper suspension with droppers, while the cross sections of other cables are circular.
Figure 2. Overhead catenary system comprising of bracket, mast, registration arm, contact wire, dropper and messenger wire.
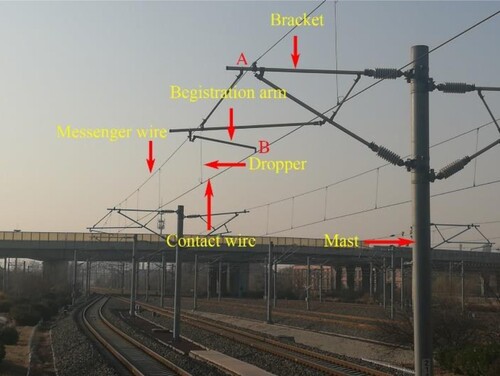
Figure 3. Schematic drawn of a typical catenary system. (a) Front view and (b) Top view.
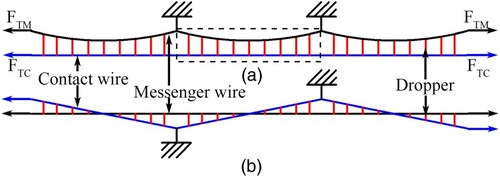
Figure 4. Cross section of the contact wire that sliding over the pantograph: (a) Intact cross section, (b) Shaded worn-off portion (Δh) of the cross section.
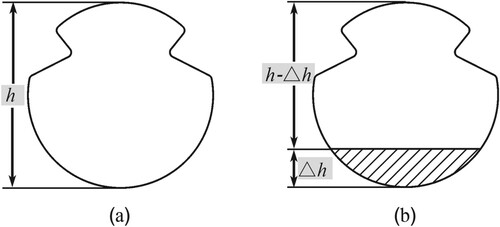
During the electric train operations, the collector head of the pantograph tends to slide to the relatively lower end of the contact wire, which results in wearing down on the wire. Figure shows the cross section of a typical contact wire. The height of the cross section of an un-worn (intact) wire is denoted as h as shown in Figure (a), and the worn-down portion of the wire is denoted as Δh (see Figure b). The objective of this study is to develop a method that allows us to quantify Δh in a precise and scientific manner, to conveniently calculate the residual height of h-Δh of the wire. By comparing the residual height with a wear conversion table of contact wire, the residual area and wear ratio of contact wire can be accurately calculated.
The structure of the pantograph
To start operation of the train, the pantograph is raised from the roof of the train, to come in touch with the contact wire for getting the power supply. Figure illustrates the structure of a typical pantograph. The upper arm and lower arm are integrated as an articulating frame, and collector head, base frame together form the pantograph.
Figure 5. Structure of a typical pantograph that consists of collector head, articulating frame and base frame.
FE modelling of the pantograph-catenary system
Modelling of the catenary
Computational modelling has become a very effective tool for all engineering designs [Citation31–33]. To save the expensive and time-consuming field experiments, numerical simulation is conducted in this study to reveal the complex mechanic’s interactions between pantograph with catenary. In this study, we use the well-established finite element (FE) method [Citation33, Citation34]. The pantograph and catenary models must be rigorous in mechanics to ensure the reliability of the simulation results[Citation35]. A critical factor is the appropriate approximation to the droppers for specification of its length, without affecting the mechanical behaviour of the system. The contact wire is suspended over the catenary to a specified height from track level. Because of the nonlinear mechanics nature involved in the system, the results of the simulation model are sensitive to the length of the droppers. A slight deviation of the length specification from the catenary configuration may affect the reliability of the simulation results. Hence care must be paid in these kinds of details. In this study, the following measurements are implemented in our FE models.
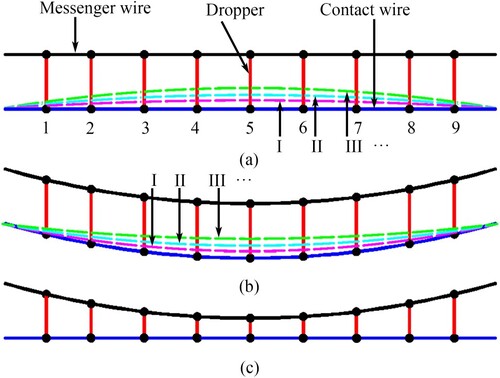
In the design specification, the length of droppers during the design of the catenary is usually calculated from the given parameters. This indispensable step for building the catenary is termed shape-finding analysis. For the given design parameters of the catenary, the length of each dropper is carefully adjusted to ensure that the suspension of the contact wire meets the operational requirements. Similarly, in our numerical modelling, this step is also implemented for mechanical simulation of catenary, to mimic the actual situation. In order to illustrate this point, the middle span of the catenary shown in Figure (a), a simplified catenary with a single messenger wire suspending the contact wire and droppers, is selected to describe the procedure of shape-finding analysis. The shape-finding analysis of catenary is performed using ANSYS APDL commercial software package and the detailed analysis procedure is shown in Figure :
Establishing the original model, which is shown in Figure (a). The length of each dropper is specified as the structure height of catenary.
Setting the precision of the contact wire, that is the vertical displacement of the contact wire concerning for to the original model. It is expressed by P and the value is set as 1 mm.
Applying the gravity load of the cable, which will cause the catenary structure to deform shown in Figure (b).
Calculating the maximum displacement D. We set the displacement of the connection nodes between the dropper and the contact wire as di (i = 1, 2, … , 9). And the di is the corresponding node displacement with respect to the configuration in step (1). The maximum value of di is called D.
Comparing the values of P in step (2) and D in step (4). If D is greater than P, the catenary model is re-constructed and repeat from step (3) to step (5). In re-constructing, the length of the dropper is equal to the length of the dropper in the previous re-constructed step minus di in this step. The shape of the contact wire is reshaped as an upward arch as indicated by the dashed line I in Figure (a). Then, apply the gravity load of the cable, the shape of the contact wire is shown as a downward arch in Figure (b). As the number of reconstructions increases, the arch curvature increases gradually, such as the dashed lines II and III in Figures (a and b).
Repeating step (5) until D meets the precision requirement of P. The final configuration of the catenary after shape-finding is shown in Figure (c).
Figure 6. Flow diagram for shape-finding of catenary.
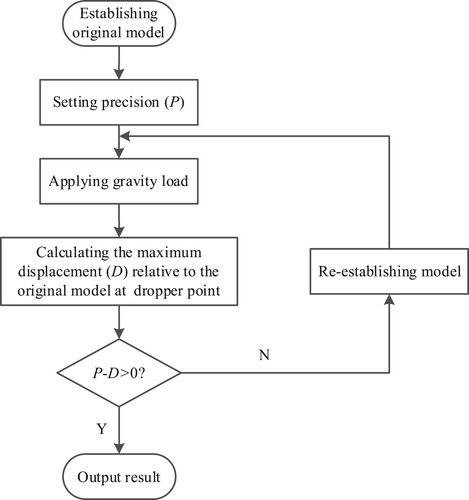
Figure 7. Structure changes process of the shape-finding analysis of catenary: (a) Original configuration, (b) Configuration after applying gravity, (c) Final configuration after shape-finding.
It should be mentioned that the parameters for the catenary model are specified according to standard EN 50318 [Citation36] with appropriate simplification of the structure. The structure data are given in Table . Material parameters of the cables are shown in Table . The unit length masses of the messenger wire and contact wire, according to the standard, are 1.07 and 1.35 kg/m, respectively. Thus, element types are determined to be respective JTMH120 and CTMH150. Figure shows the cross-sectional shape of the CTMH150 contact wire. Both the messenger wire and contact wire are simulated with the BEAM 188 element, which can customize the cross-sectional configuration. LINK 10 element is adopted for the dropper, which simulates rope behaviours of 0 N/m stiffness subjected to pressure. Figure shows the boundary conditions of the catenary. Between the messenger wire and bracket (position A), the contact wire and registration arm (position B) are fixed, except that the vertical freedom of the latter is released, so that it can be lifted up when the pantograph passes. Force FTM and FTC are applied to the left and right boundaries of catenary to approximate the tension complying to the practical suspension of the messenger wire and contact wire in operation the dropper length is thus calculated accordingly.
Table 1. Parameters for catenary of one span.
Table 2. Parameters of cables.
Modelling of the pantograph
In recent years, researches have been on the pantograph-catenary interaction mainly by simulation experiments and field tests. Many numerical pantograph models have been developed. Amongst, concentrated mass models and multi-body models are prevailing[Citation37, Citation38]. In this study, the pantograph is defined as a lumped mass model, or alternatively named as a discrete mass-spring-damping model, as shown in Figure . It shows the kinematic mechanism of the pantograph (see Figure a) and the finite element model (Figure b) approaches the geometric configuration of the pantograph. The mass, stiffness and damping of the various parts in the finite element model are respectively identical to those in the lumped mass model. The parameters of the mass, stiffness and damping are listed in Table . Constant static force F2 is applied to the lumped mass m2.
Figure 8. Pantograph models: (a) Lumped mass model including three springs (K0, K1, K2), three mass points (m1, m2 and collector head), static force F2, damping parameters r1 and r2; (b) Finite element model.
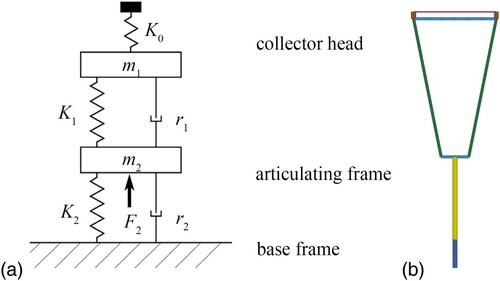
Table 3. Parameters of pantograph.
Inverse prediction of wear level of contact wire
After the aforementioned shape-finding analysis of catenary, static analysis is implemented to derive the wear of contact wire when the pantograph is not in action. In finite element analysis, the force and displacement are compatible quantities, implying specific force will produce definite displacement, and vice versa. The contact force of the pantograph acting on the contact wire will cause the contact wire to produce a displacement positively related to the force value when the train is stationary. Through static analysis, the relationship between wear and force or displacement will be derived to facilitate the detection of the contact wire wear.
Prediction based on static constant force
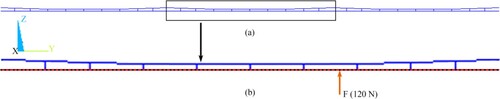
For simplicity of the analysis procedure, the catenary with three spans is selected as the analysis example. The boundary conditions imposed on both ends of messenger and contact wire are simplified to be completely fixed. The middle span is specifically studied to eliminate the influence of boundary conditions on the results. A constant force is applied to contact wire at the mid-span to deform the contact wire. For different wear Δh, the displacement in the contact wire is generally different. Variable wear Δh is adopted as input to derive concomitant displacement. As a result, a co-relationship function between the extent of wear and displacement can be constructed. Through this function, the wear of contact wire can thus be deduced with measured displacement by inversion.
The cross-sectional area of the contact wire CTMH150 is 150 mm2 and the height h is 14.4 mm. When the overall wear level of contact wire reaches 25%, the wire is considered not to fit for use and should be replaced. Therefore, the maximum extent of wear is set to 3.6 mm. To simulate the worn contact wire, the pre-set extent of wear Δh is increasing from 0 mm to 3.6 mm in increment of 0.1 mm, which is equal to the suggested minimum resolution [Citation39]. Establish different contact wire models with different wear amounts Δh, including the case where Δh is 0 mm, there are 37 groups of models in total. As shown in the enlarged view of Figure (b), the contact wire is meshed at a constant interval of 0.5 m [Citation40] to generate 119 nodes (exclusive of both ends) for the middle span. A constant force of 120N is applied to each node in turn according to the direction of the contact force applied by the pantograph to the contact line under actual conditions. The displacement at each node will be extracted for different Δh models.
Figure 9. Catenary structure after shape-finding. (a) Model with three spans. (b) Zoomed view of displacement constraint condition middle span, where the node is the location to apply load.
For the 37 sets of resultant data, the result for the case that Δh is 0 mm is applied as calibre to be subtracted from the results of other cases to derive the net-wear pertinent displacement. It can be understood that when the contact wire wear presents, the equilibrium state of the catenary system will be disturbed. The displacement by the contact force is then redistributed by the dislocation of wear. The profile of displacement at each node in the middle span with a variable extent of wear is shown in Figure . For brevity of display, only seven groups out of total 37 cases are presented.
Figure 10. Extent of wear with constant contact force: (a) Displacements at the nodes, (b) Relationship between the extent of wear Δh and relative displacement.
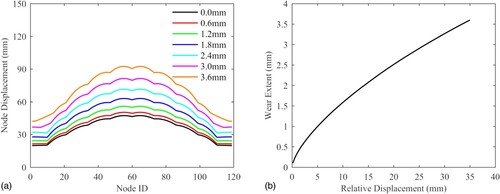
From Figure (a), the displacement increases with the increasing extent of wear. The relative change in the average displacement after wear occurs can be obtained by subtracting the displacement about concerning the intact contact wire. Relative displacement dr can be expressed by dr = di - d0, where di is the average displacement after wear, subscript i represents the different Δh, and d0 represent the average displacement when the Δh is 0 mm. The relationship between relative displacement and extent of wear is shown in Figure (b). It can be found that the relative displacement increases as the extent of wear increases. In other words, for given contact force, larger relative displacement indicates severer wear of the contact wire.
To obtain the wear severity of the contact wire more conveniently, the explicit expression for the relationship between the wear and displacement is derived through curve fitting. A tentative quadratic polynomial is initially applied to curve-fit the data in Figure (a). It can be seen that when the wear is minimal or near 3.6 mm, the fitting curve does not reflect effectively the simulation results indicating insufficiency of the parabolic formulae.
Figure 11. Fitting curve of extent of wear vs. relative displacement: (a) Quadratic polynomial, (b) Piecewise quadratic polynomial and liner fit.
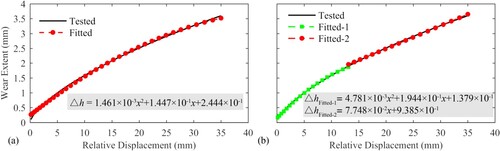
The loading condition and the geometrical configuration of the contact wire can be analogized to a simply supported beam subjected to a concentrated force. Accordingly, the inertia moment of the circular and rectangular sections of the beam can be respectively expressed as
(1)
(1)
(2)
(2) where D denotes the diameter of the circular section; b represents the width; h indicates the height of the rectangular section. Respective deflections are calculated by
(3)
(3)
(4)
(4) where F is concentrated force; E specifies Young’s modulus; l stands for the length of the beam; x indicates the location of F. The cross-section changes gradually from a circle to a rectangle with increasing wear. An intact contact wire can be approximated as a circular cross-section, especially the lower half is circular. With a gradual increase of wear, the section tends to change into a rectangle-like shape. Given that, the displacement-wear correlation may swerve in forms substantially according to Equations (3) and (4). To improve the proximity of the fitting formula, the fitting curve adopts a piecewise approximation. The first segment, with minimal wear and change in circular cross-section, quadratic polynomial still applies. For furthermore wear, the wear surface is roughly rectangular as shown in Figure (b) to render an approximately linear relationship between the wear and the displacement (see Figure b). Thus, a linear fitting curve is more appropriate.
Prediction based on constant displacement
In the previous section, the displacement is obtained by applying constant contact force to the contact wire. Correlation between wear and displacement is constructed to specify wear by inversion of measured displacement. Alternatively, for specific wear, the contact force and the compatible displacement are mutually exclusive with all the other conditions being definite. The contact force at nodes can also be used to estimate the wear extent. When a constant displacement of 50 mm is applied to the nodes in the middle span as shown in Figure (b). The contact force by the application of the displacement with variable Δh is shown in Figure .
Figure 12. Analysis results for constant displacement. (a) Contact force at these nodes. (b) Relationship between extent of wear Δh and relative contact force.
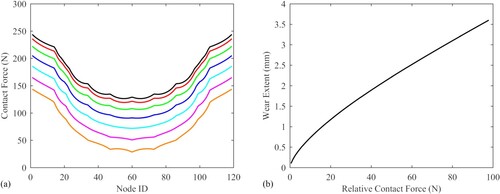
From Figure (a), at the initial stage of wear, the contact force by the displacement at the location of the dropper is greater than the counterpart by displacement at other positions of the contact wire. On the other hand, this trend is inversed after the extent of wear exceeds 2.4 mm. The contact force at the joint of the dropper with contact wire is smaller than those of the other sections. It is because the mass of the contact wire is reduced by the wear increasing. The hoisting force received by the messenger wire is thus reduced. The mid-span of the messenger wire will be lifted up and the tension applied by the messenger wire to the contact wire through the droppers will gradually increase the height of the contact wire. The change in the geometrical configuration of the catenary redistributes the forces.
As a result, the contact force decreases as the extent of wear increases, and the relationship between the contact force and the extent of wear is constructed, as shown in Figure (b), similarly as is for the relationship between displacement with the wear in the previous section. A similar trend is observed as that of Figure (b). The greater the relative contact force is, the more severe is the wear.
Similarly, an explicit expression for the relationship between relative contact force and extent of wear is curve fitted. Figure (a) shows a fitting quadratic function, while Figure (b) is piece-wise segments. It is observed that the latter is more approximating to the original relationship curve.
Figure 13. Fitting curve for the extent of wear with contact force: (a) Quadratic polynomial fitting, (b) Piecewise quadratic polynomial and a liner fitting.
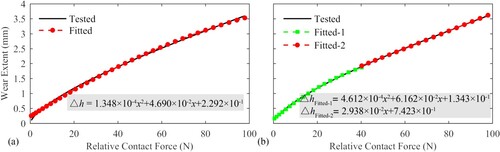
From Figure (a), not like the case of constant force, the tendency that the contact force changes with the wear is variable. The increase of wear changes the structural configuration of the catenary. Due to variable wear, for displacement load, the practical displacement of node has the discrepancy of wear to the specified displacement. On the other hand, it does not have an effect on the constant force case. Therefore, it is more proficient to derive the extent of wear of the contact wire by inversion of contact force.
Prediction based on dynamic displacement of the pantograph
To approach more proficiently the actual dynamic situation of the train running in high gear, based on the aforementioned static analysis, dynamic contact of PCS is numerically simulated to exploit underlying fundamentals of the wearing. Before starting the dynamic simulation, the current static coupling model is verified according to the standard EN 50318 [Citation36] of criteria for the reliability of PCS dynamic simulation. Following the specifications in the standard, the FE model is constructed to include a catenary and pantograph. The standard parameters from the criteria are adopted for the catenary.
The coupling system of the PCS is dynamically simulated with the train speed is specified as 250 and 300 km/h, respectively. It is understood that for dynamic finite element analysis, the element size sensitivity should be eliminated for the calculation of objective results. Figure shows the trend of contact force varies with time using the different element sizes 0.5 m, 0.25 m and 0.1 m for the contact wire[Citation41]. It is common practice to filter the numeric results using a high-pass digital filter (20 Hz) during post-processing [Citation36, Citation42]. Through filtering, the average interaction force remains unchanged, but the peaks and valleys are smoothed shown in Figure . The curve oscillates about the average contact force without large variations in local peak values, indicating that the simulation is stable. Table shows that the average contact force is almost the same under the different element sizes 0.5 m, 0.25 m and 0.1 m. When the train speed is 250 km/h, the variance error of the contact force under the element size 0.5 m is 2.92% compared with that of the element size 0.25 m. Moreover, the variance error of the contact force under the element size 0.1 m is 3.48% compared with that of the element size 0.25 m. When the train speed is 300 km/h, the variance error of the contact force under the element size 0.5 m is 10.45% compared with that of the element size 0.25 m. Moreover, the variance error of the contact force under the element size 0.1 m is 2.06% compared with that of the element size 0.25 m. However, from Figure (a), we can see that the time-contact force curve under the element size 0.5 m is different from that of the element size 0.25 m. Instead, the time-contact force curve under the element size 0.25 m is almost the same as that of the element size 0.1 m. Similarly, When the train speed is 300 km/h, Figure (b) shows that the time-contact force curve under the element size 0.5 m is different from that of the element size 0.25 m. Instead, the time-contact force curve under the element size 0.25 m is almost the same as that of the element size 0.1 m.
Figure 14. Contact force between pantograph and catenary with different element sizes: (a) Train speed of 250 km/h, (b) Train speed of 300km/h.
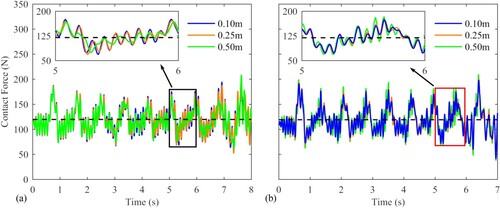
Table 4. Error analysis result of contact forces under different element sizes.
Based on the above analysis, we can obtain that when the element size of the contact wire is less than 0.25 m, the simulation results do not change significantly. Therefore, to ensure the calculation accuracy and save computing time, we use the mesh size of 0.25 m for the contact wire analysis. The calculation results at different train speeds 250 and 300 km/h are respectively shown in Table , in which FM and σ are the averages and standard deviation, statistical maximum and minimum are Smax and Smin that calculated by the Equation (5), Amax and Amin denote the actual maximum and minimum of contact force. Comparing the calculation results at different train speeds with the standard range, we can obtain that the calculation results are all within the standard ranges, which proves the correctness of the analytical model.
(5)
(5)
Table 5. Comparing the calculation results at different train speeds with the standard range.
Figure 15. The pantograph and catenary (10 spans) system for dynamic simulation.
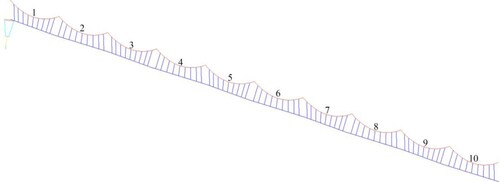
Figure 16. The extent of wear as a function of the relative displacement of the vertical position of the collector head at different speeds. (a) When the speed is 250 km/h. (b) When the speed is 300 km/h.
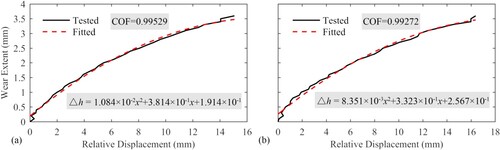
Because the electricity is supplied to the train through a power-transmission catenary to pantographs via sliding contact, while the train is travelling. In this process, the lifting force of the pantograph keeps constant to ensure good contact between the pantograph and wire. Since the pantograph is an articulated structure, the average displacement of the collector head will change along with vertically as the wear of contact wire. Therefore, when the pantograph slide on the catenary, the wear of the contact wire can be analyzed by collecting the vertical displacement of the pantograph collector head. To illustrate the phenomenon, we selected the wear of the contact line from 0 mm to 3.6 mm as examples. In the next simulation analysis, the middle two spans (5 and 6) of the catenary in Figure are selected as the study objects to eliminate the influence of the catenary boundary on the results. When the contact wire is not worn, we set the average of the vertical displacement of the collector head (D) as the datum, which is marked as Ds. Once the contact wire is worn out, we set the average of the vertical displacement of the collector head as Di (i represents a different amounts of wear). Furthermore, we call the Dr obtained by Di minus Ds as the relative displacement of the collector head. Figure shows the relationship between the relative displacement and wear extent at the two kinds of train speeds 250 km/h and 300 km/h (the black lines). It is found that the relative displacement increases gradually with the increase of wear of the contact wire, and the change in the relative displacement is proportional to the extent of wear. As shown in Figure , according to the curve characteristics, the curve between the relative displacement with the extent of wear at the two kinds of train speeds (250 and 300 km/h) is fitted using the method of least squares for better fitting. The corresponding resolved values after curve-fitting can be found in Figure (the red dotted lines). The coefficient of determination (COF), used to evaluate the quality of the fitting function, of the formulae are 0.99529 shown in Figure (a) and 0.99272 shown in Figure (b), respectively. The closer the value of the COF is to 1, the better the curve fits. So, through the fitting formula, the corresponding extent of wear can be conveniently calculated from the relative displacement.
Conclusions
Through finite element simulation, a novel inverse technique based strictly on mechanical principles was used to conduct a comprehensive study on the wear-level monitoring of the contact wire. Considering the accuracy of the FE model, the correct parameters of the catenary structure are determined by the shape-finding process. Considering the measurement of contact wire wear under static and dynamic conditions through inverse technology. Among them, the amount of wear can be obtained by inversion of force (load is displacement) or displacement (load is force) under static conditions, but force load is more suitable. When the pantograph slides along the contact wire, the vertical displacement of the collector head of the pantograph can be used as an input parameter to reverse the wear of the contact wire. This also makes it possible to monitor the wear level of the contact wire in real-time. We should also note that current work has focused on the inverse technology for seeking wear under ideal conditions. It is expected that actual problems such as locomotive vibration in the real environment, the external environment and calibration at the time will affect the accuracy of the reverse technology, which will be explored in our upcoming work.
Disclosure statement
No potential conflict of interest was reported by the author(s).
Additional information
Funding
References
- Zhai D, Pan Y, Li P, et al. Estimating the vigilance of high-speed rail drivers using a stacking ensemble learning method. IEEE Sens J. 2021;21(15):16826–16838.
- Wang Y, Liu Z, Fan F, et al. Review of research development of pantograph-catenary arc model and electrical characteristics. J China Railway Soc. 2013;35(8):35–43.
- Cho CJ, Park Y. New monitoring technologies for overhead contact line at 400 km· h− 1. Engineering. 2016;2(3):360–365.
- Xin T, Roberts C, Weston P, et al. Condition monitoring of railway pantographs to achieve fault detection and fault diagnosis. Proceedings of the Institution of Mechanical engineers. Part F: Journal of Rail and Rapid Transit. 2018;234(3):289–300.
- Bucca G, Collina A. A procedure for the wear prediction of collector strip and contact wire in pantograph–catenary system. Wear. 2009;266(1):46–59.
- Bucca G, Collina A. Electromechanical interaction between carbon-based pantograph strip and copper contact wire: A heuristic wear model. Tribol Int. 2015;92:47–56.
- Yamashita C, Sugahara A. Wear modes of contact wire and contact strip under electric current condition. Q Rep RTRI. 2014;55(2):67–72.
- Rogalski A. Infrared detectors: an overview. Infrared Phys Technol. 2002;43(3):187–210.
- Huda ASN, Taib S, Ghazali KH, et al. A new thermographic NDT for condition monitoring of electrical components using ANN with confidence level analysis. ISA Trans. 2014;53(3):717–724.
- Jaffery ZA, Dubey AK. Design of early fault detection technique for electrical assets using infrared thermograms. Int J Electr Power Energy Syst. 2014;63:753–759.
- Shebani A, Iwnicki S. Prediction of wheel and rail wear under different contact conditions using artificial neural networks. Wear. 2018 2018;406-407:173–184.
- Shing A, Miu F., editors Predicting the contact wire wear of a railway system using ANN. CORE 2012, Rail-the core of integrated transport, conference on railway engineering, Perth, Western Australia, 7-10 September 2012; 2012.
- Wang H, Núñez A, Liu Z, et al. Analysis of the evolvement of contact wire wear irregularity in railway catenary based on historical data. Veh Syst Dyn. 2018;56(8):1207–1232.
- Song Y, Wang H, Liu Z. An investigation on the current collection quality of railway pantograph-catenary systems with contact wire wear degradations. IEEE Trans Instrum Meas. 2021;70:1–11.
- Karakose E, Gencoglu MT, Karakose M, et al. A new experimental approach using image processing-based tracking for an efficient fault diagnosis in pantograph–catenary systems. IEEE Trans Ind Inf. 2017;13(2):635–643.
- Hayasaka T, Shimizu M, Nezu K. Development of contact-loss measuring system using ultraviolet ray detection. Q Rep RTRI. 2009;50(3):131–136.
- Koyama T, Ikeda M, Kobayashi S, et al. Measurement of the contact force of the pantograph by image processing technology. Q Rep RTRI. 2014;55(2):73–78.
- Chen P, Xu C, Li Z, et al. Design and implementation of non-contact detection system for catenary based on double linear array cameras. AIP Conf Proc. 2017;1834(1):020014.
- Fukai H, Watabe Y, Niwakawa M, et al., editors Automatic correction of measurement position using robust matching in contact wire inspection system. 2016 11th France-Japan & 9th Europe-Asia Congress on Mechatronics (MECATRONICS) /17th International Conference on Research and Education in Mechatronics (REM); 2016 15-17 June 2016.
- Lindner L, Sergiyenko O, Rodríguez-Quiñonez JC, et al., editors Continuous 3D scanning mode using servomotors instead of stepping motors in dynamic laser triangulation. 2015 IEEE 24th International Symposium on Industrial Electronics (ISIE); 2015 3-5 June 2015.
- Zhou J, Han Z, Wang L., editors A steady arm slope detection method based on 3D point cloud segmentation. 2018 IEEE 3rd International Conference on Image, Vision and Computing (ICIVC); 2018 27-29 June 2018.
- Yin W, Zhu E, Zhu X, et al., editors Landmark-based spectral clustering with local similarity representation. Theoretical Computer Science; 2017 2017//; Singapore: Springer Singapore.
- Borromeo S, Aparicio JL, Martinez PM. MEDES: contact wire wear measuring system used by the spanish national railway (RENFE). Proceedings of the Institution of Mechanical Engineers Part F Journal of Rail & Rapid Transit. 2003;217(3):167–175.
- Torroja Y, Garcia S, Aparicio JL, et al., editors An artificial vision system used for the measurement of the overhead wire in railway applications. Conference of the IEEE Industrial Electronics Society; 2002.
- Van Gigch JM, Smorenburg C, Benschop AW. Le système de mesure de l'épaisseur des fils de contact des chemins de fer néerlandais (NS); contact-wires thickness measurement system of Netherlands Railways (NS). Rail int (Ed fr. 1991;22(4):20–31. French.
- Kinoshita N, Himeno Y, Igata R, editors. Development of a high-speed overhead contact line measurement device for the Kyushu Shinkansen. WIT Transactions on The Built Environment; 2010;114:155–167.
- Liu GR, Ma WB, Han X. An inverse procedure for identification of loads on composite laminates. Composites Part B. 2002;33(6):425–432.
- Liu GR, Ma WB, Han X. An inverse procedure for determination of material constants of composite laminates using elastic waves. Comput Methods Appl Mech Eng. 2002;191(33):3543–3554.
- Seo J-H, Sugiyama H, Shabana AA. Three-dimensional large deformation analysis of the multibody pantograph/catenary systems. Nonlinear Dyn. 2005;42(2):199–215.
- Zhang W, Zhou N, Li R, et al. Pantograph and catenary system with double pantographs for high-speed trains at 350 km/h or higher. J Modern Transport. 2011;19(1):7–11.
- Liu G-R. Meshfree methods: moving beyond the finite element method. Boca Raton: CRC press; 2009.
- Liu G-R, Han X. Computational inverse techniques in nondestructive evaluation. Boca Raton: CRC press; 2003.
- Liu G-R, Quek SS. The finite element method: a practical course. Bristol: Butterworth-Heinemann; 2013.
- Collina A, Bruni S. Numerical simulation of pantograph-overhead equipment interaction. Veh Syst Dyn. 2002;38(4):261–291.
- Kulkarni S, Pappalardo CM, Shabana AA. Pantograph/catenary contact formulations. J Vib Acoust. 2016;139(1):011010.
- 50318 ECfESE. Railway applications–current collection systems–validation of simulation of the dynamic interaction between pantograph and overhead contact line. European Standards (EN) Brussels; 2002.
- Bruni S, Bucca G, Carnevale M, et al. Pantograph–catenary interaction: recent achievements and future research challenges. Int J Rail Transport. 2018;6(2):57–82. doi:10.1080/23248378.2017.1400156.
- Rauter FG, Pombo J, Ambrósio Jet al., editors. Multibody modeling of pantographs for pantograph-catenary interaction. IUTAM symposium on multiscale problems in multibody system contacts. Dordrecht: Springer Netherlands; 2007. p. 205–226.
- Nagasaka S, Aboshi M. Measurement and estimation of contact wire unevenness. Q Rep RTRI. 2004;45(2):86–91.
- Wang H, Núñez A, Liu Z, et al. Analysis of the evolvement of contact wire wear irregularity in railway catenary based on historical data. Veh Syst Dyn. 2017;153:1–26.
- Nåvik P, Rønnquist A, Stichel S. Variation in predicting pantograph–catenary interaction contact forces, numerical simulations and field measurements. Veh Syst Dyn. 2017;55(9):1265–1282.
- Bruni S, Ambrosio J, Carnicero A, et al. The results of the pantograph–catenary interaction benchmark. Veh Syst Dyn. 2015;53(3):412–435.