
Abstract
In this paper, the kinetic study of the reaction between substituted 1,4-benzoquinones (RBQs) and Na2SO3 (S(IV)) is presented in aqueous solutions at different pH values and reagent concentrations. The stoichiometry of the reaction is 1:2 RBQs:S(IV) and one equivalent of chloride ion was also detected as a product when using mono- (2-CBQ) or dichloro-benzoquinones (2,5-DCBQ; 2,6-DCBQ) as reactants. This shows that reductive dehalogenation occurs instead of simple reduction to the corresponding substituted 1,4-hydroquinones (RBQHs) and quinone bisulfites are formed, analogously to the addition of bisulfite ion to carbonyl compounds. Various sulfonated quinones have been identified as products by electrospray mass spectrometry. Kinetic traces at different wavelengths were obtained by the stopped-flow technique with spectrophotometric detection, a kinetic fitting program (ZiTa) was used to fit a multi-step model to the data. A detailed mathematical evaluation of the reaction scheme was carried out under non-pseudo-first order conditions showing that our model can be fitted with a double exponential function even when none of the reagents are in large excess.
GRAPHICAL ABSTRACT
Abbreviations
| 2-CBQ | = | 2-chloro-1,4-benzoquinone |
| 2-MBQ | = | 2-methyl-1,4-benzoquinone |
| 2-MBQH | = | 2-methyl-1,4-hydroquinone |
| 2-tBBQ | = | 2-tert-butyl-1,4-benzoquinone |
| 2,5-DCBQ | = | 2,5-dichloro-1,4-benzoquinone |
| 2,5-DCBQH | = | 2,5-dichloro-1,4-hydroquinone |
| 2,6-DCBQ | = | 2,6-dichloro-1,4-benzoquinone |
| 2,6-DMBQ | = | 2,6-dimethyl-1,4-benzoquinone |
| BQ | = | 1,4-benzoquinone |
| BQH | = | 1,4-hydroquinone |
| CBQs | = | chlorinated 1,4-benzoquinones |
| DBPs | = | disinfection by-products |
| HBQs | = | halogenated 1,4-benzoquinones |
| HRMS | = | high-resolution mass spectrometry |
| MRA | = | matrix rank analysis |
| NOM | = | natural organic matter |
| RBQHs | = | substituted 1,4-hydroquinones |
| RBQs | = | substituted 1,4-benzoquinones |
Introduction
The disinfection methods used in drinking and swimming pool water treatment technologies include chlorination, bromination, ozonization, UV irradiation and their combinations [Citation1–3]. Chlorination is commonly used due to its low cost and simplicity [Citation3]. However, the formation of chlorinated 1,4-benzoquinones (CBQs) as disinfection by-products (DBPs) is a main concern in this case, because of the carcinogenic and mutagenic effects of these compounds [Citation4–6].
Halogenated 1,4-benzoquinones (HBQs) are often metabolites of halogenated phenols in biological systems and are likely to contribute very significantly to the well-known toxicity of halophenols. It was shown that HBQs inhibit DNA methyltransferase more efficiently than the non-halogenated 1,4-benzoquinone (BQ) [Citation7]. This may be related to that the highly chlorinated 1,4-benzoquinones form adducts with DNA more readily than less substituted compounds or unsubstituted 1,4-benzoquinone [Citation8,Citation9]. The increased risk of toxicity due to the halogenation of the cysteinyl forms of quinones or semiquinone has been discussed before [Citation10,Citation11]. Epidemiological studies have shown that DBPs – such as CBQs – may have adverse effects and can contribute to the development of urinary cancer [Citation12–14]. Toxicity studies on HBQs found that their cytotoxicities was much, sometimes 1000 times greater than those of the non-chlorinated analogues or even its transformed products [Citation15,Citation16]. A structure-toxicity relationship study also suggests that HBQs contribute more significantly to cancer risk than their non-halogenated counterparts [Citation17]. In fact, among disinfection byproducts, these compounds are linked most directly to tumors [Citation8] even though the cytotoxicity of chlorinated 1,4-benzoquinones may systematically have been underestimated [Citation15]. Because of the antagonistic toxicological effects, understanding reductive or oxidative dehalogenation of CBQs and finding efficient methods for their removal from water is of primary importance.
CBQs are present at relatively low concentration levels in drinking and swimming pool waters [Citation5,Citation16,Citation18,Citation19].
Wang et al. have investigated the formation of different CBQs in swimming pool water by taking samples from ten different locations. In each sample, 2,6-dichloro-1,4-benzoquinone (2,6-DCBQ) was found at about two orders of magnitude larger concentration level (19–299 ng/L) than in a typical drinking water. This finding was explained by considering that various cosmetics (sunscreen, body lotion etc.) could be the precursor in the formation of CBQs [Citation7]. Because of their cytotoxicity [Citation20], the allowed maximum daily intake of these CBQs and their derivatives is 49 µg per kilogram of the human body [Citation21].
Qian et al. used UV light irradiation (254 nm, 1000 mJ cm–2) to degrade CBQs into less toxic products and confirmed the formation of various derivatives by TOF-MS [Citation18]. They proposed a mechanism which includes the formation of a hydroxy-quinone derivative upon irradiation and a subsequent dissociation step of the halide from the quinone ring. Wang and Diemert et al. have tested how the concentration of CBQs is reduced by using various methods for the removal of their precursors from water before chlorination in detail [Citation22,Citation23]. Nowadays, several research groups aim to remove all natural organic matters (NOMs) from water instead of dehalogenating only CBQs. Even if complete removal of NOM is often not feasible, this strategy may be efficient in minimizing the concentration of CBQs in the treated water [Citation24].
In this work, we investigate the possibility of the dechlorination of CBQs with sulfur(IV) in aqueous solution. It is well known that sulfur(IV) exists in different forms in water depending on the pH of the medium (H2O·SO2 under pH 1.5, HSO3− between pH 1.5–6.5 and SO32− above pH 6.5).Footnote1 Hydrogen sulfite ion has two isomers because a proton can bind either to the sulfur atom or alternatively to one of the oxygen atoms [Citation25–27]. At high sulfur(IV) concentrations pyrosulfite (S2O52–) is formed (S–S bond) from hydrogen sulfite in an equilibrium dimerization process [Citation28–30]. Earlier, the oxidation of sulfite ion was investigated in the presence and absence of catalysts [Citation31–46]. The photochemical oxidation of sulfur(IV) has also been investigated [Citation47,Citation48]. Due to the complexity of S(IV) chemistry, the dechlorination reactions of CBQs may be very sensitive to the applied experimental conditions. In order to avoid the noted side reactions, high sulfur(IV) concentration, high pH and high intensity light sources were not applied in our experiments.
The reactions of S(IV) and some quinones were investigated earlier [Citation49–55], but the exact compositions of the intermediates/products and the kinetics of these reactions were not described in detail. It was suggested that 1,4 reductive addition occurs in neutral aqueous solutions [Citation56,Citation57], while redox reactions producing hydroquinone and sulfate ion may be operative in acidic medium. The reactions of BQs and S(IV) was studied in a wide pH range by LuValle [Citation49]. While hydroquinone, sulfate ion and hydroquinone monosulfonate were identified as products below pH 4.0, only hydroquinone monosulfonate formation was reported in the pH range of 4.0-7.5. In alkaline medium (pH > 7.5), the formation of a greenish blue intermediate was observed.
Youngblood also suggested the formation of hydroquinone monosulfonate but proposed a different reaction sequence for the overall process [Citation50]. The reaction of 2-halo-3,5,6-trimethyl-1,4-benzoquinone with sulfur(IV) was studied by Bishop [Citation51]. In these systems, the nucleophilic attack of the sulfite ion induces the dissociation of the halide ion (iodide, bromide, chloride) from the quinone ring. It was assumed that a quinone – bisulfite adduct forms first in a fast equilibrium step.
The main goal of this work is to explore the inherent features of the reactions between RBQs and sulfur(IV). Detailed kinetic studies were performed, and the exact composition and structure of the intermediates and products were investigated by the ESI-MS method. The results serve as a basis for deeper understanding of the environmentally relevant dechlorination processes of CBQs.
Materials and methods
Materials
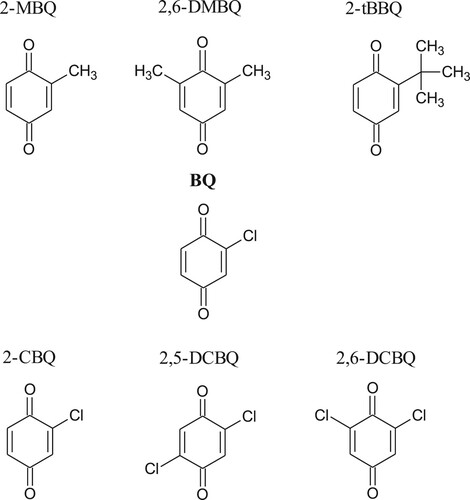
Analytical grade chemicals were used in this study. Solid 1,4-hydroquinone (BQH), 1,4-benzoquinone (BQ) and its derivatives (2-chloro-1,4-benzoquinone (2-CBQ), 2,5-dichloro-1,4-benzoquinone (2,5-DCBQ), 2,6-dichloro-1,4-benzoquinone (2,6-DCBQ), 2-methyl-1,4-benzoquinone (2-MBQ), 2,6-dimethyl-1,4-benzoquinone (2,6-DMBQ), 2-tert-butyl-1,4-benzoquinone (2-tBBQ) from Alfa Aesar Co., Inc.) (structures shown in Figure ) were dissolved in purified water (Elix-3, Millipore, Darmstadt, Germany).
Figure 1. Structures of the investigated RBQs.
In general, the concentration of the RBQ stock solution was 1.00 × 10⁻³ M. Higher concentrations could not be used because of the low solubility of these compounds in water. RBQs are highly photosensitive [Citation58]. Thus, an appropriate experimental protocol was used during the preparation of the stock solutions to avoid any photochemical side reaction. The solutions were always prepared freshly and handled, as well as stored in the dark.
The concentration of dilute hydrochloric acid solutions prepared from concentrated HCl solution (37 V/V%, Sigma Aldrich, St. Louis, MO, USA) was determined by potentiometric titration. Constant pH of the samples was maintained by using acetate, MES and HEPES buffers. The desired pH was set by adding appropriate amounts of sodium hydroxide and HCl solutions (Sigma Aldrich, St. Louis, MO, USA). The buffer was always added to the S(IV) stock solution prior to mixing the reactants. It was thoroughly tested that the buffer did not induce any side reaction with the reactants. To avoid the medium effect and to make the experimental results directly comparable, constant ionic strength was used (I = 1.0 M, NaCl) in the quantitative kinetic experiments. Each solution was prepared freshly on the day of the measurements.
Spectrophotometric and potentiometric techniques
A Mettler-Toledo T50 M titrator equipped with a Metrohm micro combined glass electrode (6.0234.110) was used for pH measurements and pH-potentiometric titrations. The read-out of the pH meter was transformed into pH = –log[H+] as described [Citation59].
Spectrophotometric experiments were made either with an AnalytikJena SPECORD S600 diode array spectrophotometer equipped with a JUMO dTRON 308 thermostat or a Shimadzu UV-1601 double-beam spectrophotometer using a Shimadzu TCC controller Peltier thermostat. The spectra were collected and evaluated by the built-in controlling software of the instruments: WinAspect and UV PROBE 2.2, respectively. The experiments were performed in standard stoppered 1.000 cm quartz cuvettes and at constant temperature (25.0 ± 0.1°C).
An Applied Photophysics DX-17 MV Sequential Stopped Flow Apparatus with Pro-Data SX v2.5.0 software was used for the fast kinetic studies maintaining constant temperature with a Julabo F12-ED thermostat. The dead time of the instrument, 1.51 ± 0.03 ms, was determined by utilizing the 2,6-dichlorophenolindophenol – ascorbic acid reaction [Citation60].
The chloride ion concentration in the reaction mixtures was measured with a Thermo Scientific ORION 9617BNWP chloride ion-selective combined electrode connected to a Radiometer ABU91 Autoburette potentiometer. The measured electrode potentials of the chloride ion selective electrode were converted to chloride ion concentrations by calibrating the electrode with standard KCl solutions.
ESI-MS measurements
High resolution MS measurements were carried out with a maXis II UHR ESI-QTOF MS instrument (Bruker) in negative ionization mode. The following parameters were applied for the electrospray ion source: capillary voltage: 2.5 kV; end plate offset: 500 V; nebulizer pressure: 0.5 bar; dry gas temperature: 200 °C and dry gas flow rate: 4.0 L/min. The MS method was tuned according to the examined mass range, which was 100-450 m/z. Constant background correction was applied for each spectrum. Na-formate calibrant was injected after each sample, which enabled internal m/z calibration during data evaluation (relative errors were < 2 ppm). Collision induced fragmentation (CID) was applied for MS/MS study of the reaction products. In these measurements, the collision energy was systematically varied between 10 and 60 eV. In order to show every possible fragment, each reported tandem mass spectrum is the average of spectra recorded at different collision energies. In these tandem measurements, the m/z range was expanded to 30-250 to detect smaller fragments. Mass spectra were recorded by otofControl version 4.1 (build: 3.5, Bruker) and processed by Compass DataAnalysis version 4.4 (build: 200.55.2969).
Since the examined reactions are fast, measurements in buffered media (both MS1 and tandem MS) were carried out by applying a special experimental protocol, as follows. A capillary electrophoresis (7100 CE System, Agilent, Waldbronn, Germany) instrument and a 1260 Infinity II isocratic pump (Agilent) was connected to the MS unit with a coaxial CE-ESI Sprayer interface (G1607B, Agilent). The S(IV) reagent solution was transferred towards the MS unit with the liquid pump and the solutions of quinone derivatives were transferred from the CE capillary (L: 75 cm; ID: 75 µm; fused silica) using external pressure (nitrogen gas, Linde). The two reagents met only at the end of the sprayer, thus, these fast reactions practically occurred in the electrospray chamber (MS inlet), which enabled extremely fast MS detection. The same system was used for detecting reaction products from unbuffered media (Figures S1–S3), however, in this case the reactants were premixed in various molar ratios and then injected into the MS. In this latter case, the CE instrument served as an autosampler, and no additional liquid was added from the liquid pump. The CE and the pump were operated by OpenLAB CDS Chemstation software.
Data analysis
Different software packages were used for matrix rank analysis calculations (Matlab) and to evaluate measured and simulated kinetic curves (MicroMath Scientist, ZiTa software). Simple non-linear least squares fitting of the experimental data was made with the MicroMath Scientist software [Citation61]. ZiTa is a comprehensive software package for fitting complex data sets on the basis of ordinary differential equation systems which represent a multi-step kinetic model [Citation62].
Results and discussion
In general, it was found that different RBQs show very similar behavior in the experiments. Thus, the common features are demonstrated in the figures by showing only the results obtained with 2,5-DCBQ throughout this paper. Experimental data for the other systems are reported in the Supplemental online material.
The photochemical stability of quinone derivatives
The studied RBQs are photosensitive compounds [Citation63–65]; therefore, the spectrophotometric measurements were carried out in a darkened laboratory. It is well documented that unwanted photochemical reactions may occur in diode array spectrophotometers [Citation66]. This is the consequence of the design of these instruments in which a relatively high intensity polychromatic light beam of typically 190–1100 nm spectral range enters the sample. To explore the photosensitivity of the RBQs, their solutions were illuminated for (minimum) 20 min in the SPECORD S600 diode array spectrophotometer. A photoinduced process was detected with all RBQs (Figure ). It was confirmed that the spectral changes are associated with the formation of hydroxy-quinone and hydroquinone.
Figure 2. Spectral changes in the photochemical decomposition of 2,5-DCBQ (λmax = 525 nm) recorded by the SPECORD S600 diode array spectrophotometer. The optical shutter was kept open during this experiment, i.e. the sample was continuously illuminated by the light source of the spectrophotometer. The absorption maxima at 525 and 345 nm are consistent with the formation of hydroxy-2,5-DCBQ and 2,5-DCBQH, respectively. c(2,5-DCBQ) = 0.50 mM.
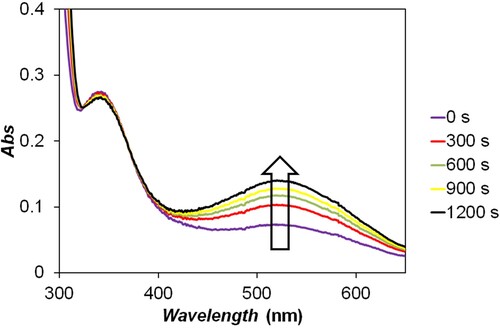
Such reactions (which could have corrupted the study of the title reaction) were not observed with the conventional double beam spectrophotometer and in the stopped-flow experiments when the samples were irradiated with low-intensity monochromatic light beam, so the reactions between quinones and sulfur(IV) could be studied without photochemical interference.
Identification of the chlorinated products
First, each reaction between RBQs and sulfur(IV) was carried out in unbuffered medium, however, these measurements led to very complex kinetic patterns. Time resolved UV/Vis spectra were evaluated by using matrix rank analysis (MRA) [Citation67], which proved the presence of six or seven light-absorbing molecules in each system.
Monitoring chloride ion formation
Before suggesting a model for the reaction, it was necessary to identify the structure of the end product(s). To justify the initial hypothesis, that the halide ion is removed from the quinone ring, the formation of Cl− was followed by potentiometry using a chloride ion selective electrode. In order to compensate the interference of low-level chloride ion contamination in the quinone solutions, KCl was added to the other reagent solution in appropriate amount to set the corresponding measured electrode potentials equal. With this arrangement, no change in the electrode potential is expected upon mixing the reactants unless the reaction itself produces chloride ion. The concentration of chloride ion increased immediately after the addition of S(IV) to a 2,5-DCBQ solution. Only a minor change was observed in the electrode potential upon the addition of further aliquots of S(IV) solution to the sample. It was confirmed that 1 equivalent chloride ion was released in the reaction when 2 equivalents of S(IV) was added to the 2,5-DCBQ solution. These observations suggest that reductive dehalogenation takes place in the reaction of 2,5-DCBQ and sulfur(IV). Similarly, chloride ion formation was also observed in the reactions of 2-CBQ and 2,6-DCBQ with sulfur(IV). This proves that sulfur(IV) is a suitable agent for removing chloride ion from CBQs.
ESI-MS measurements
ESI-MS was applied to identify products of the RBQs – S(IV) reaction. In the first experiments, the reaction was followed in buffered solutions in the pH range 3.8–8.5 (Figures S4–S7) according to the special experimental protocol (see Experimental chapter) to follow very fast reactions. The formulas for each base peak were calculated (188.9863: [C6H5O5S]–, 222.9473: [C6H4ClO5S]– and 256.9083: [C6H3Cl2O5S]–). Similar products were detected in each case. However, some less intense ions might not have been detected due to ion suppression caused by the buffer, too short reaction time and/or insufficient mixing.
The established formulas can be attributed to two alternative structures because an –SO3– group might be attached to one of the two oxygens (resulting in –SO4– group) or the RBQs ring (resulting in –SO3– group). These possibilities were evaluated on the basis of tandem mass spectra from the previously identified base peaks (Figures S8−S11). The detected fragments corresponding to an –SO3– group are considerably more intense than those of an -SO4– group (Table ). For example, when the mass of 222.9473 was fragmented (base peak in the 2-CBQ – S(IV) reaction), the relative intensities for m/z 79.9574 (SO3·−) and 80.9652 (HSO3−) were 100% and 63.4%, whilst for 95.9523 (SO4·−) and 96.9601 (HSO4−) they were 0.2% and 0.1% (Table , Figure S9). Similar results for the other products clearly proved that in the detected products the –SO3− group is bonded to the RBQs ring and not to the oxygen atom (Table , Figures S8, S10, S11).
Table 1. Relative intensity values of sulfite radical anion (SO3·–), hydrogensulfite ion (HSO3–), sulfate radical anion (SO4·–) and hydrogensulfate ion (HSO4–) in the tandem mass spectra of the base peak in the RBQs – S(IV) reaction.
To eliminate the effect of ion suppression, insufficient mixing, or too short reaction time under the special experimental setup, the unbuffered solutions of RBQs and S(IV) were mixed in various molar ratios (RBQs:S(IV) = 10:1–1:10). Mass spectra were recorded at each ratio and product formulas were calculated based on exact masses. In these experiments, the reaction time was not controlled, samples were injected directly into the MS shortly after mixing the solutions. The results confirmed that many species are formed in the reaction, mainly the products of the dehalogenation process. These compounds (Table ) are expected to show significant light absorption due to the aromatic structural motifs. This is in a good agreement with the expected large number of absorbing species based on MRA calculations.
Table . Identified chemical formulas, proposed structures, m/z values, molecule ion types and relative intensities of the products in the reactions of CBQs and sulfur(IV) in unbuffered medium on the basis of high resolution MS experiments.
Table shows that the products contained one or two –SO3– groups and zero, one or even two chloride ion was released (compared to the reactant RBQ). Dehalogenation products and two-fold sulfonated products were detected with higher intensities when the ratio of RBQ:S(IV) was 1:2. In addition, increasing the ratio of S(IV) resulted in monotonously decreasing peak intensities because Na2SO3 also caused ion suppression.
The (one-dimensional) mass spectra of the RBQ – S(IV) reactions contain a mass peak at 96.9601 m/z corresponding to HSO4- ion (Figures S8−S11). This species is the product of the oxidation of S(IV) to S(VI). The presence of S(VI) in the system suggests that the first step of the overall process is the reduction of RBQ to RBQH. In a subsequent reaction, RBQH may react with another S(IV) to form the detected products. To corroborate these considerations, the reaction mixture of 1,4-hydroquinone (BQH) and S(IV) was analyzed with tandem mass spectrometry (Figure S12). As expected, the same fragmentation pattern was observed as in the reaction of BQ – S(IV) (Figure S8), confirming the formation of the same product.
The absolute identifications of the molecular formulas shown in Table is possible using the high resolution masses determined in the experiments. Table provides comparisons of detected and calculated values for the m/z values of the most abundant ions for the proposed molecular formulas. In each case, agreement within 0.001 atomic mass units is observed, which positively confirms the proposed molecular formula. In addition, at least one of the positional isomers of the structures in Table is a known compound. Table also includes references for these known substances as PubChem compound identifiers (CID), and also in some cases as Chemical Abstract Services identification numbers (CAS #).
Table 3. Mass spectrometric identification information for the products in the reactions of CBQs and sulfur (IV) in unbuffered medium and data of relevant reference materials.
The stoichiometry and the kinetics of the RBQs – sulfur (IV) reactions
It is reasonable to assume that some of the intermediates and/or products are weak acids or bases and involved in protolytic equilibria. Thus, these equilibria may be shifted during the overall reaction and contribute to the absorbance change in unbuffered reaction mixtures. In order to eliminate this problem, detailed kinetic studies were made at constant pH maintained with acetate, MES, HEPES buffers. Under such conditions, the number of absorbing molecules dropped to 3.
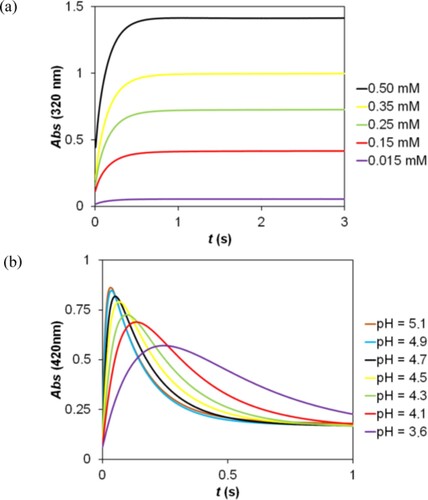
The reactions between S(IV) and RBQs were monitored at two detection wavelengths where the absorbance change is sufficiently large and corresponds to the formation of the product, and the formation and decomposition of the intermediate; 2-CBQ: 313, 348 nm, 2,6-DCBQ: 310, 355 nm, 2,5-DCBQ: 320, 420 nm, 2,6-DMBQ: 290, 325 nm, 2-tBBQ: 307, 340 nm. In the case of BQ and 2-MBQ, only the formation of the product could be followed at 300 and 310 nm, respectively. All of these reactive systems exhibit analogous properties, and the evaluation of the experimental data is demonstrated by discussing the results obtained in the 2,5-DCBQ – S(IV) reaction.
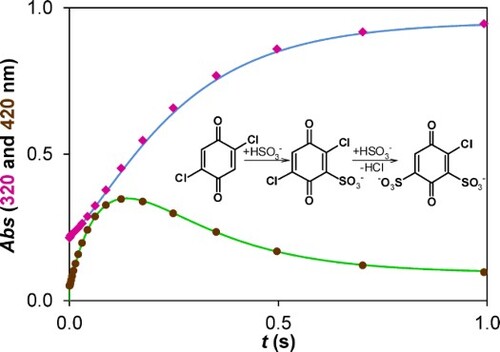
The kinetic traces are consistent with two consecutive reaction steps (Figure ). When the excess of S(IV) over the substrate is increased, the induction period in the formation of the product becomes less profound (320 nm) and the intermediate forms faster and in higher transient concentration (420 nm).
Figure 3. Characteristic kinetic traces for the reaction of 2,5-DCBQ with sulfur(IV) at two different wavelengths (320 and 420 nm). c(2,5-DCBQ) = 0.50 mM, c(S(IV)) = 0.15–5.00 mM (the individual concentrations are listed in the figures), pH = 3.8 (acetate buffer), I = 1.0 M, T = 298.2 K.
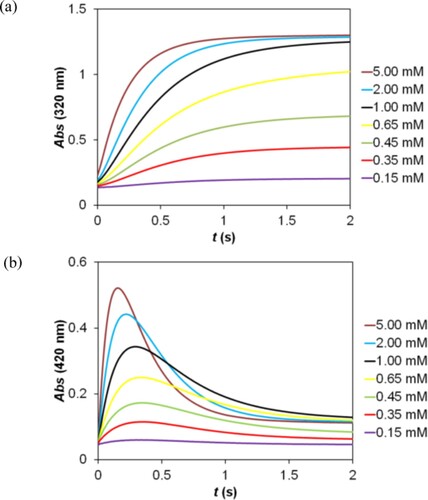
Kinetic traces recorded at various 2,5-DCBQ concentrations and pH are shown in Figure . In this system, the reactants and possibly the intermediates are involved in acid – base equilibria which are coupled with the formation of the sulfonated product and, therefore, the pH strongly influences the kinetics. The reaction becomes considerably faster by increasing the pH.
Figure 4. Kinetic traces recorded as a function of the 2,5-DCBQ concentration (a) and pH (b) in the reaction of 2,5-DCBQ with sulfur(IV). (a): c(2,5-DCBQ) = 0.015–0.50 mM, c(S(IV)) = 5.00 mM, (acetate buffer) pH = 4.5. (b): c(2,5-DCBQ) = 0.50 mM; c(S(IV)) = 5.00 mM, pH = 3.6–5.1 (acetate buffer), I = 1.0 M, T = 298.2 K.
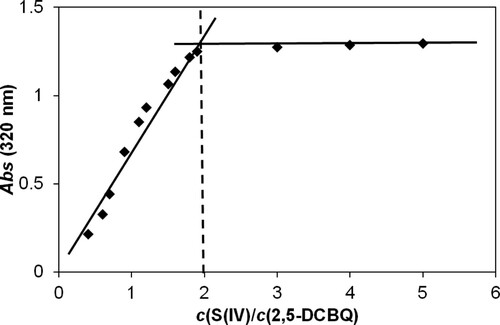
The stoichiometry of the reaction was determined by the Job method [Citation68,Citation69]. The final absorbance of the kinetic traces at 320 nm (Figure (a)) was plotted as the function of the sulfur(IV):RBQs concentration ratio Figure . The breakpoint at c(S(IV)):c(2,5-DCBQ) = 2 confirms that one mole of RBQs reacts with two moles of sulfur(IV).
Figure 5. Determination of the stoichiometry in the reaction of 2,5-DCBQ with S(IV) by the Job method. c(2,5-DCBQ) = 0.50 mM, c(S(IV)) = 0.20–30.00 mM, pH = 3.8 (acetate buffer), I = 1.0 M, T = 298.2 K.
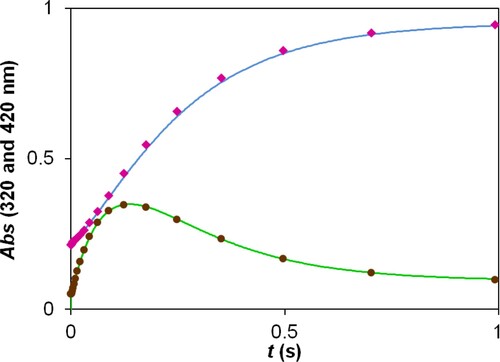
All experimental kinetic traces can be fitted with a double exponential function even (A1exp(−k1t) + A2exp(−k2t) + E) though non-pseudo-first order conditions (using close to equimolar reagent concentrations) were also applied. This feature is quite unexpected in a relatively complex system, which may be the consequence of fortuitous combination of the values of the rate constants and the characteristic molar absorbances. A detailed mathematical interpretation of this phenomenon was reported earlier [Citation70]. Kinetic experiments were performed at two different pH values and varying the concentrations of RBQs and sulfur(IV). The corresponding kinetic curves recorded at 320 and 420 nm were fitted either individually or together. These calculations yielded the same estimates for the pseudo-first-order rate constants. The goodness of the fit is illustrated in Figure .
Figure 6. Experimental kinetic traces of the reaction between 2,5-DCBQ and S(IV) at 420 nm (brown circles) and 320 nm (purple rectangles), together with the fitted double exponential curves. Only a small fraction of the measured points is shown for clarity. c(2,5-DCBQ) = 0.50 mM, c(S(IV)) = 1.0 mM, pH = 4.5 (acetate buffer), I = 1.0 M, T = 298.2 K.
The results are consistent with a simple kinetic model shown in Scheme 1. It postulates the formation of an intermediate in an equilibrium step between the reactants (k1, k−1). The next step is the dehalogenation of the intermediate (k2) followed by a very fast reaction with a second bisulfite ion (k3).
Scheme 1. Kinetic model for the reaction of 2,5-DCBQ with sulfur (IV).
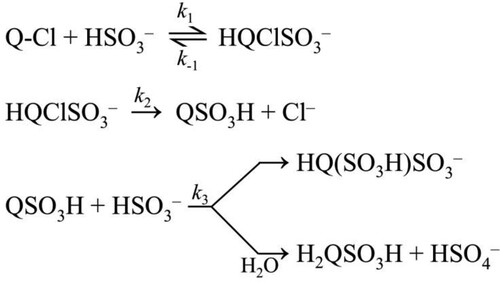
In the final evaluation, all kinetic traces recorded at constant pH and at the selected two wavelengths were fitted simultaneously with the ZITA software package. This program package makes it possible to fit large data sets obtained by varying the initial concentrations of the reactants. In this case, all the curves measured at pH 4.5 and all the curves measured at pH 3.8 were evaluated together at two wavelengths (420 and 320 nm) and the concentrations of the reactants were in the following ranges: c(2,5-DCBQ) = 0.25–1.00 mM, c(S(IV)) = 1.00–10.00 mM (pH 4.5) and c(2,5-DCBQ) = 0.25–1.00 mM, c(S(IV)) = 1.00–10.00 mM (pH 3.8). It was assumed that the last step in the kinetic model (Scheme 1) is fast and k3 was included with a large fixed, diffusion-controlled value in the calculations. The molar absorptivities of the intermediate and the final product were also estimated. The results of the parameter fitting are listed in Table and the goodness of the fit is demonstrated in Figure and Figure S13.
Figure 7. Experimental and fitted kinetic traces using the ZITA software. c(2,5-DCBQ) = 0.50 mM (A, B, C, D); c(S(IV)) = 10.00 mM (A, C), 2.00 mM (D), 1.00 mM (B); pH = 3.8 (A, B), 4.5 (C, D); acetate buffer; I = 1.0 M; T = 298.2 K. Only a selection (ca. 5%) of measured points is shown for clarity.
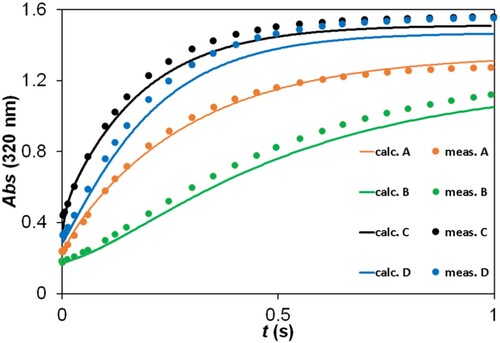
Table 4. Estimated parameters obtained by the ZITA software for the reaction of 2,5-DCBQ with sulfur(IV).
The graphs in Figure and Figure S13 illustrate that the model fits the measured kinetic traces with an acceptable precision. Table shows that the parameter values are in the expected range for every case. It is to be noted that almost all parameters significantly depend on the pH used (except the molar absorbance of the product at 420 nm). This is clearly caused by the fact that all of the species in the scheme have acid–base properties and are therefore present in a different protonation state at the two wavelengths. The different protonation states are expected to have different reactivities, too, which explains the differences between the rate constants fitted at the two different pH values. These fitting results are also in agreement with the independent matrix rank analysis of the UV/Vis spectra, which – as mentioned earlier – gave evidence for at least 6 absorbing species when all measurements were used together, but only 3 when spectral data collected at a single pH were analyzed. The findings of the ESI-MS measurements, which detected a large number of different species even in a single system, also support this qualitative interpretation.
Conclusions
By using HRMS technique to investigate the RBQ – S(IV) reaction we proved that the examined CBQs provided similar products (monosulfonated hydroquinones) in the examined pH range (3.8–8.7), under the special experimental conditions. It was also proved that in these products the SO3– group was attached to the hydroquinone ring and not to any of the two phenolic O atoms. At longer reaction times (1–10 min) and without the presence of buffer (ion suppression was omitted) several dehalogenation products were detected. The formation of multiply sulfonated and dehalogenated products was facilitated by increased S(IV) ratio (maximal intensity of these products reached at a ratio of 1 CBQ:2 S(IV)). It was also presumed that the first step of the reaction is the reduction of quinone to hydroquinone, from which sulfonated products can be formed.
Furthermore, this work has demonstrated that double exponential fitting can be well used to describe the kinetic traces of the RBQs – sulfur(IV) reaction in a wide concentration range. The rate constants of the kinetic model can be estimated based on the observed rate constants of the double exponential fitting.
In the case of CBQs, the organic compound undergoes reductive dehalogenation, which may be the basis of a practical process in the treatment of CBQ containing wastewater.
Supplemental Material
Download MS Word (1.1 MB)Acknowledgements
The authors wish to thank Gábor Lente for helpful discussions.
Disclosure statement
No potential conflict of interest was reported by the author(s).
Additional information
Funding
Notes
1 The terms sulfur(IV) or S(IV) refer to all forms being in fast equilibrium (H2O·SO2, HSO3−, and SO32−). Distinction is made between these species only when it is required by the clarity of the presentation. It needs to be emphasized that a form of S(IV) may be present in a small mole fraction still be more reactive than a dominant form at a given pH.
References
- Maddila S, Dasireddy VDBC, Jonnalagadda SB. Dechlorination of tetrachloro-o-benzoquinone by ozonation catalyzed by cesium loaded metal oxides. Appl Catal B Environ. 2013;138–139:149–160. DOI:10.1016/j.apcatb.2013.02.017.
- Zwiener C, Richardson SD, De Marini DM, et al. Drowning in disinfection byproducts? Assessing swimming pool water. Environ Sci Technol. 2007;41(2):363–372. DOI:10.1021/es062367v.
- LaKind JS, Richardson SD, Blount BC. The good: the bad, and the volatile: can we have both healthy pools and healthy people? Environ Sci Technol. 2010;44(9):3205–3210. DOI:10.1021/es903241k.
- Krasner SW, Weinberg HS, Richardson SD, et al. Occurrence of a new generation of disinfection byproducts. Environ Sci Technol. 2006;40(23):7175–7185. DOI:10.1021/es060353j.
- Zhao Y, Qin F, Boyd JM, et al. Characterization and determination of chloro- and bromo-benzoquinones as new chlorination disinfection byproducts in drinking water. Anal Chem. 2010;82(11):4599–4605. DOI:10.1021/ac100708u.
- Li J, Moe B, Vemula S, et al. Emerging disinfection byproducts, halobenzoquinones: effects of isomeric structure and halogen substitution on cytotoxicity, formation of reactive oxygen species, and genotoxicity. Environ Sci Technol. 2016;50(13):6744–6752. DOI:10.1021/acs.est.5b05585.
- Wang W, Qian Y, Boyd JM, et al. Halobenzoquinones in swimming pool waters and their formation from personal care products. Environ Sci Technol. 2013;47(7):3275–3282. DOI:10.1021/es304938x.
- Nguyen TNT, Bertagnolli AD, Villalta PW, et al. Characterization of a deoxyguanosine adduct of tetrachlorobenzoquinone: dichlorobenzoquinone-1,N2-etheno-2‘-deoxyguanosine. Chem Res Toxicol. 2005;18(11):1770–1776. DOI:10.1021/tx050204z.
- Anichina J, Zhao Y, Hrudey SE, et al. Electrospray ionization mass spectrometry characterization of interactions of newly identified water disinfection byproducts halobenzoquinones with oligodeoxynucleotides. Environ Sci Technol. 2010;44(24):9557–9563. DOI:10.1021/es1024492.
- Jeong JK, Wogan GN, Lau SS, et al. Quinol-glutathione conjugate-induced mutation spectra in the supF gene replicated in human AD293 cells and bacterial MBL50 cells. Cancer Res. 1999;59(15):3641–3645. https://cancerres.aacrjournals.org/content/59/15/3641.
- Bull RJ, Reckhow DA, Li X, et al. Potential carcinogenic hazards of non-regulated disinfection by-products: haloquinones,: halo-cyclopentene and cyclohexene derivatives, N-halamines, halonitriles, and heterocyclic amines. Toxicology. 2011;286(1–3):1–19. DOI:10.1016/j.tox.2011.05.004.
- Hrudey SE, Charrois JWA. Disinfection by-products: relevance to human health. London: IWA Publishing; 2012; https://www.iwapublishing.com/books/9781843395195/disinfection-products-and-human-health.
- Villanueva CM, Cantor KP, Grimalt JO, et al. Bladder cancer and exposure to water disinfection by-products through ingestion, bathing, showering, and swimming in pools. Am J Epidemiol. 2006;165(2):148–156. DOI:10.1093/aje/kwj364.
- Jemal A, Bray F, Center MM, et al. Global cancer statistics. CA Cancer J Clin. 2011;61:69–90. DOI:10.3322/caac.20107.
- Hung S, Mohan A, Reckhow DA, et al. Assessment of the in vitro toxicity of the disinfection byproduct 2,6-dichloro-1,4-benzoquinone and its transformed derivatives. Chemosphere. 2019;234:902–908. DOI:10.1016/j.chemosphere.2019.06.086.
- Wang W, Qian Y, Li J, et al. Analytical and toxicity characterization of halo-hydroxyl-benzoquinones as stable halobenzoquinone disinfection byproducts in treated water. Anal Chem. 2014;86(10):4982–4988. DOI:10.1021/ac5007238.
- Zhao Y, Anichina J, Lu X, et al. Occurrence and formation of chloro- and bromo-benzoquinones during drinking water disinfection. Water Res. 2012;46(14):4351–4360. DOI:10.1016/j.watres.2012.05.032.
- Qian Y, Wang W, Boyd JM, et al. UV-induced transformation of four halobenzoquinones in drinking water. Environ Sci Technol. 2013;47(9):4426–4433. DOI:10.1021/es305044k.
- Huang R, Wang W, Qian Y, et al. Ultra pressure liquid chromatography–negative electrospray ionization mass spectrometry determination of twelve halobenzoquinones at ng/L levels in drinking water. Anal Chem. 2013;85(9):4520–4529. DOI:10.1021/ac400160r.
- Du H, Li J, Moe B, et al. Cytotoxicity and oxidative damage induced by halobenzoquinones to T24 bladder cancer cells. Environ Sci Technol. 2013;47(6):2823–2830. DOI:10.1021/es303762p.
- Bull RJ, Reckhow DA, Rotello V, et al. Use of toxicological and chemical models to prioritize DBP research. Denver (CO): American Water Works Research Foundation. 2006. https://www.waterrf.org/research/projects/use-toxicological-and-chemical-models-prioritize-dbp-research.
- Wang W, Qian Y, Jmaiff LK, et al. Precursors of halobenzoquinones and their removal during drinking water treatment processes. Environ Sci Technol. 2015;49(16):9898–9904. DOI:10.1021/acs.est.5b02308.
- Diemert S, Wang W, Andrews RC, et al. Removal of halo-benzoquinone (emerging disinfection by-product) precursor material from three surface waters using coagulation. Water Res. 2013;47(5):1773–1782. DOI:10.1016/j.watres.2012.12.035.
- Zheng Q, Yang X, Deng W, et al. Characterization of natural organic matter in water for optimizing water treatment and minimizing disinfection by-product formation. J Environ Sci. 2016;42:1–5. DOI:10.1016/j.jes.2016.03.005.
- Guthrie JP. Tautomeric equilibria and pKa values for ‘sulfurous acid’ in aqueous solution: a thermodynamic analysis. Can J Chem. 1979;57:454–457. DOI:10.1139/v79-074.
- Horner DA, Connick RE. Equilibrium quotient for the isomerization of bisulfite ion from HSO3- to SO3H-. Inorg Chem. 1986;25(14):2414–2417. DOI:10.1021/ic00234a026.
- Horner DA, Connick RE. Kinetics of oxygen exchange between the two isomers of bisulfite ion, disulfite ion (S2O52-), and water as studied by oxygen-17 nuclear magnetic resonance spectroscopy. Inorg Chem. 2003;42(6):1884–1894. DOI:10.1021/ic020692n.
- Lindqvist I, Mörtsell M. The structure of potassium pyrosulfite and the nature of the pyrosulfite ion. Acta Crystallogr. 1957;10:406–409. DOI:10.1107/S0365110X57001322.
- Baggio S. The crystal structure of ammonium pyrosulphite. Acta Crystallogr Sect B. 1971;27:517–522. DOI:10.1107/S0567740871002486.
- Chen IC, Wang Y. Reinvestigation of potassium pyrosulfite, K2S2O5. Acta Crystallogr Sect C. 1984;40:1780–1781. DOI:10.1107/S0108270184009525.
- Larson TV, Horike NR, Harrison H. Oxidation of sulfur dioxide by oxygen and ozone in aqueous solution: a kinetic study with significance to atmospheric rate processes. Atmos Environ. 1978;12(8):1597–1611. DOI:10.1016/0004-6981(78)90308-6.
- Prasad DSN, Rani A, Madnawat PVS, et al. Kinetics of surface-catalyzed oxidation of sulphur(IV) by dioxygen in aqueous suspensions of cobalt(II) oxide. J Mol Catal. 1991;69(3):393–405. DOI:10.1016/0304-5102(91)80118-M.
- Wilkinson PM, Doldersum B, Cramers PHMR, et al. The kinetics of uncatalyzed sodium sulfite oxidation. Chem Eng Sci. 1993;48(5):933–941. DOI:10.1016/0009-2509(93)80331-J.
- Connick RE, Lee S, Adamic R. Kinetics and mechanism of the oxidation of bisulfite by peroxymonosulfate. Inorg Chem. 1993;32(5):565��571. DOI:10.1021/ic00057a013.
- Penkett SA. Oxidation of SO2 and other atmospheric gases by ozone in aqueous solution. Nat Phys Sci. 1972;240:105–106. DOI:10.1038/physci240105a0.
- Fung CS, Misra PK, Bloxam R, et al. A numerical experiment on the relative importance of H2O2 O3 in aqueous conversion of SO2 to SO42-. Atmos Environ Part A Gen Top. 1991;25(2):411–423. DOI:10.1016/0960-1686(91)90312-U.
- McArdle JV, Hoffmann MR. Kinetics and mechanism of the oxidation of aquated sulfur dioxide by hydrogen peroxide at low pH. J Phys Chem. 1983;87(26):5425–5429. DOI:10.1021/j150644a024.
- Brandt C, van Eldik R. Transition metal-catalyzed oxidation of sulfur(IV) oxides. Atmospheric-relevant processes and mechanisms. Chem Rev. 1995;95(1):119–190. DOI:10.1021/cr00033a006.
- Brandt C, Fábián I, van Eldik R. Kinetics and mechanism of the iron(III)-catalyzed autoxidation of sulfur(IV) oxides in aqueous solution. Evidence for the redox cycling of iron in the presence of oxygen and modeling of the overall reaction mechanism. Inorg Chem. 1994;33(4):687–701. DOI:10.1021/ic00082a012.
- Dóka É, Lente G, Fábián I. Kinetics of the autoxidation of sulfur(iv) co-catalyzed by peroxodisulfate and silver(i) ions. Dalton Trans. 2014;43(25):9596–9603. DOI:10.1039/C4DT00900B.
- Kerezsi I, Lente G, Fábián I. Highly efficient photoinitiation in the cerium(III)-catalyzed aqueous autoxidation of sulfur(IV). An example of comprehensive evaluation of photoinduced chain reactions. J Am Chem Soc. 2005;127(13):4785–4793. DOI:10.1021/ja0439120.
- Kerezsi I, Lente G, Fábián I. Kinetics of the light-driven aqueous autoxidation of sulfur(iv) in the absence and presence of iron(II). Dalton Trans. 2006;7:955–960. DOI:10.1039/B511363F.
- Kerezsi I, Lente G, Fábián I. Kinetics and mechanism of the photoinitiated autoxidation of sulfur(IV) in the presence of iodide ion. Inorg Chem. 2007;46(10):4230–4238. DOI:10.1021/ic061521b.
- Coichev N, Bal Reddy K, van Eldik R. The synergistic effect of manganese (II) in the sulfite-induced autoxidation of metal ions and complexes in aqueous solution. Atmos Environ Part A Gen Top. 1992;26(13):2295–2300. DOI:10.1016/0960-1686(92)90360-W.
- Dogliotti L, Hayon E. Flash photolysis study of sulfite: thiocyanate, and thiosulfate ions in solution. J Phys Chem. 1968;72(5):1800–1807. DOI:10.1021/j100851a073.
- Hayon E, Treinin A, Wilf J. Electronic spectra: photochemistry, and autoxidation mechanism of the sulfite-bisulfite-pyrosulfite systems. SO2-, SO3-, SO4-, and SO5- radicals. J Am Chem Soc. 1972;94(1):47–57. DOI:10.1021/ja00756a009.
- Avouris P, Demuth JE, Schmeisser D, et al. An electron energy loss study of the triplet states of SO2. J Chem Phys. 1982;77:1062–1063. DOI:10.1063/1.443918.
- Knappenberger KL, Castleman AW. Photodissociation of sulfur dioxide: the E state revisited. J Phys Chem A. 2004;108(1):9–14. DOI:10.1021/jp030786y.
- LuValle JE. The reaction of quinone and sulfite. I. intermediates. J Am Chem Soc. 1952;74(12):2970–2977. DOI:10.1021/ja01132a005.
- Youngblood MP. Kinetics and mechanism of the addition of sulfite to p-benzoquinone. J Org Chem. 1986;51(11):1981–1985. DOI:10.1021/jo00361a008.
- Bishop CA, Porter RF, Tong LKJ. The kinetics of displacement of halides from substituted quinones by sulfite. J Am Chem Soc. 1963;85(24):3991–3998. DOI:10.1021/ja00907a019.
- Kuo DTF, Kirk DW, Jia CQ. The chemistry of aqueous S(IV)-Fe-O2 system: state of the art. J Sulf Chem. 2006;27(5):461–530. DOI:10.1080/17415990600945153.
- Castillo A, Liebman JF, Greer A. Quinones: monoradicals and diradicals from 3- and 4-mercaptocatechol and 3,4-bismercaptocatechol: a computational study of a plausibly biomimetic reaction. J Sulf Chem. 2008;29(3–4):445–457. DOI:10.1080/17415990802146964.
- Ivanov VL, Lyashkevich SY. Photolysis of p-benzoquinone and p-chloranil in aqueous sodium sulfite solution. High Energy Chem. 2011;45:210–213. DOI:10.1134/S0018143911030064.
- Hoang HY, Akhmadullin RM, Karalin EA, et al. Aqueous sulfide oxidation catalyzed by hydrocarbon solution of 3,3′,5,5′-tetra-tert-butyl-stilbenequinone: a kinetics and mechanistic approach. J Sulf Chem. 2021;42(5):560–574. DOI:10.1080/17415993.2021.1933487.
- Brown HC, Park WS, Cho BT, et al. Selective reductions. 40. A critical examination of the relative effectiveness of various reducing agents for the asymmetric reduction of different classes of ketones. J Org Chem. 1987;52(24):5406–5412. DOI:10.1021/jo00233a019.
- Betterton EA, Erel Y, Hoffmann MR. Aldehyde-bisulfite adducts: prediction of some of their thermodynamic and kinetic properties. Environ Sci Technol. 1988;22(1):92–99. DOI:10.1021/es00166a010.
- Joschek HI, Miller SI. Photooxidation of phenol, cresols, and dihydroxybenzenes. J Am Chem Soc. 1966;88(14):3273–3281. DOI:10.1021/ja00966a019.
- Irving HM, Miles MG, Pettit LD. A study of some problems in determining the stoicheiometric proton dissociation constants of complexes by potentiometric titrations using a glass electrode. Anal Chim Acta. 1967;38:475–488. DOI:10.1016/S0003-2670(01)80616-4.
- Tonomura B, Nakatani H, Ohnishi M, et al. Test reactions for a stopped-flow apparatus: reduction of 2,6-dichlorophenolindophenol and potassium ferricyanide by l-ascorbic acid. Anal Biochem. 1978;84(2):370–383. DOI:10.1016/0003-2697(78)90054-4.
- Scientist 2.01 MicroMath Software. Salt Lake City (UT) 1995.
- Peintler G. Zita, version 5.0; a comprehensive program package for fitting parameters of chemical reaction mechanism. Hungary: University of Szeged; 1989.
- Lente G, Espenson JH. Photoreduction of 2,6-dichloroquinone in aqueous solution: use of a diode array spectrophotometer concurrently to drive and detect a photochemical reaction. J Photochem Photobiol A Chem. 2004;163(1–2):249–258. DOI:10.1016/j.jphotochem.2003.12.005.
- Józsa É, Kiss V, Ősz K. Photochemical processes of 1,4-benzoquinones in aqueous medium. J Photochem Photobiol A Chem. 2018;360:166–173. DOI:10.1016/j.jphotochem.2018.04.024.
- Kiss V, Lehoczki G, Ősz K. Mathematical description of pH-stat kinetic traces measured during photochemical quinone decomposition. Photochem Photobiol Sci. 2017;16:519–526. DOI:10.1039/C6PP00333H.
- Fábián I, Lente G. Light-induced multistep redox reactions: the diode-array spectrophotometer as a photoreactor. Pure Appl Chem. 2010;82(10):1957–1973. DOI:10.1351/PAC-CON-09-11-16.
- Katakis D. Matrix rank analysis of spectral of data. Anal Chem. 1965;37(7):876–878. DOI:10.1021/ac60226a023.
- Job P. Formation and stability of inorganic complexes in solution. Ann Chim. 1928;9:113–203.
- Huang CY. Determination of binding stoichiometry by the continuous variation method: the job plot. Methods Enzymol. 1982;87:509–525. DOI:10.1016/S0076-6879(82)87029-8.
- Kiss V, Ősz K. Double exponential evaluation under non-pseudo–first-order conditions: a mixed second-order process followed by a first-order reaction. Int J Chem Kinet. 2017;49:602–610. DOI:10.1002/kin.21100.