Abstract
This paper investigates the sensitivity of hedonic models of house prices to the spatial interpolation of measures of air quality. We consider three aspects of this question: the interpolation technique used, the inclusion of air quality as a continuous vs discrete variable in the model, and the estimation method. Using a sample of 115,732 individual house sales for 1999 in the South Coast Air Quality Management District of Southern California, we compare Thiessen polygons, inverse distance weighting, Kriging and splines to carry out spatial interpolation of point measures of ozone obtained at 27 air quality monitoring stations to the locations of the houses. We take a spatial econometric perspective and employ both maximum-likelihood and general method of moments techniques in the estimation of the hedonic. A high degree of residual spatial autocorrelation warrants the inclusion of a spatially lagged dependent variable in the regression model. We find significant differences across interpolators in the coefficients of ozone, as well as in the estimates of willingness to pay. Overall, the Kriging technique provides the best results in terms of estimates (signs), model fit and interpretation. There is some indication that the use of a categorical measure for ozone is superior to a continuous one.
RÉSUMÉ
Interpolation des Mesures de la Qualité de l'Air dans les Modèles Hédoniste de l'Estimation Immobilière: Aspects Spatiaux
Cet article examine la sensibilité de l’évaluation hédoniste des prix de l'immobilier à l'interpolation spatiale des mesures de la qualité de l'air. Nous avons envisagé la question sous trois aspects: la technique d'interpolation utilisée, l'introduction de la qualité de l'air comme variable continue ou discrète dans le modèle et la méthode d'estimation. Nous avons utilisé un échantillon de 115 732 ventes de maisons individuelles, en 1999, dans le district Côte Sud de la gestion de la Qualité de l'Air en Californie du Sud. Nous avons comparé les polygônes de Thiessen, la pondération inversement proportionnelle à la distance, le krigeage et les courbes splines pour mener l'interpolation des mesures ponctuelles de l'ozone, obtenues dans 27 stations de suivi de la qualité de l'air en fonction des lieux où étaient situées les maisons. Nous avons pris une perspective spatiale économétrique et employé aussi bien la probabilité maximale que la méthode générale des moments techniques dans l’évaluation de l'hédonique. Un degré élevé d'auto corrélation spatiale résiduelle garantie l'inclusion d'une variable dépendante spatialement décalée dans le modèle de régression. Nous avons trouvé des différences importantes parmi les interpolateurs dans les coefficients d'ozone, ainsi que parmi les indicateurs de la volonté de payer. Surtout, la technique de krigeage donne les meilleurs résultats pour les estimations (signes), l'ajustement du modèle et l'interprétation. L'utilisation d'une mesure nominale pour l'ozone est supérieure à une mesure continue, semble-t-il.
RESUMEN
Interpolación de las medidas de la calidad del aire en los modelos de los precios hedónicos de la vivienda: aspectos espaciales
En este ensayo investigamos la sensibilidad de los modelos de lo precios hedónicos de la vivienda para la interpolación espacial de medidas de la calidad del aire. Tenemos en cuenta tres aspectos al respecto: la técnica de interpolación utilizada, la inclusión de la calidad del aire como variable continua, en vez de discreta, en el modelo, y el método de cálculo. Con una muestra de 115.732 ventas de viviendas individuales durante 1999 en el Distrito de Gestión de Calidad del Aire de la Costa Sur en California, comparamos los polígonos de Thiessen, la ponderación de la distancia inversa, métodos geoestadísticos o Kriging y métodos basados en splines para llevar a cabo la interpolación espacial de las mediciones puntuales de ozono obtenidas en 27 estaciones de control de calidad del aire en los lugares donde están situadas las viviendas. Desde la perspectiva econométrica espacial empleamos las técnicas de la probabilidad máxima del método general de momentos en el cálculo de precios hedónicos. Debido a un alto grado de autocorrelación espacial residual debemos incluir una variable dependiente espacialmente rezagada en el modelo de regresión. Se observan diferencias importantes entre los interpoladores en los coeficientes del ozono y en los cálculos de la disposición a pagar. En general, la técnica Kriging da los mejores resultados en cuanto a los cálculos (señales), la idoneidad del modelo y la interpretación. Hay indicios de que es mejor usar una medida categórica para el ozono en vez de una continua.
This paper is part of a joint research effort with James Murdoch (University of Texas, Dallas) and Mark Thayer (San Diego State University). Earlier versions were presented at the 51st North American Meeting of the Regional Science Association International, Seattle, WA, November 2004, the Spatial Econometrics Workshop, Kiel, Germany, April 2005, and at departmental seminars at the University of Illinois, Ohio State University, the University of California, Davis, and the University of Pennsylvania. Comments by participants are greatly appreciated. The usual disclaimer holds.
Introduction
The valuation of the economic benefits of improvements in environmental quality is a well-studied topic in economics and policy analysis (e.g. Freeman III, Citation2003). In this context, the estimation of a hedonic model of house prices that includes a measure of ambient air quality has become an established methodology (e.g. Palmquist, Citation1991). The rationale behind this approach is that, ceteris paribus, houses in areas with less pollution will have this benefit capitalized into their value, which should be reflected in a higher sales price.
The theoretical, methodological and empirical literature dealing with this topic is extensive, going back to the classic studies of Ridker & Henning (Citation1967) and Harrison & Rubinfeld (Citation1978). Extensive recent reviews are provided in Smith & Huang (Citation1993 Citation1995), Boyle & Kiel (Citation2001), and Chay & Greenstone (Citation2005), among others. In the empirical literature, an explicit accounting for spatial effects (spatial autocorrelation and spatial heterogeneity) using the methodology of spatial econometrics has only recently become evident, e.g. in Kim et al. (Citation2003), Beron et al. (Citation2004), and Brasington & Hite (Citation2005). This coincides with a greater acceptance of spatial econometrics in empirical studies of housing and real estate in general, e.g. as reviewed in Anselin (Citation1998), Basu & Thibodeau (Citation1998), Pace et al. (Citation1998), Dubin et al. (Citation1999), Gillen et al. (Citation2001), and Pace & LeSage (Citation2004), among others.
In this paper, we focus on a methodological aspect pertaining to the inclusion of an ambient air quality variable in hedonic house price models that has received little attention to date: the interpolation of pollution values to the location of the house sales transaction. Since measurement of pollution is based on regular sampling at a few monitoring stations, but house sales transactions are spatially distributed throughout the region, there is a mismatch between the spatial ‘support’ of the explanatory variable (e.g. ozone) and the support for the dependent variable (sales price). This change of support problem (Gotway & Young, Citation2002), or misaligned regression problem (Banerjee et al., Citation2004, Ch. 6), has been considered extensively in the spatial statistical literature. In hedonic house price models that include air quality, however, this is typically treated in a rather ad hoc manner, and one of several procedures is used that are readily available in commercial GIS software packages.
We consider the extent to which the selection of a particular interpolation method affects the parameter estimates in the hedonic function and the derived economic valuation of willingness to pay for improved air quality. Specifically, we compare Thiessen polygons, inverse distance weighting (IDW), Kriging and splines—techniques that are easy to implement and that have seen application in hedonic house price studies to varying degrees. For example, Thiessen polygons were used by Chattopadhyay (Citation1999), Palmquist & Israngkura (Citation1999), and Zabel & Kiel (Citation2000), Kriging in Beron et al. (Citation1999 Citation2001 Citation2004), and spline interpolation in Kim et al. (Citation2003).Footnote1
We are also interested in the sensitivity of the results to the way in which the pollution variable is quantified, either as a continuous measure of ambient air quality or as a set of discrete categories. It is often argued that the latter conforms more closely to the perception of the buyers and sellers in a sales transaction, who may not be aware of subtle continuous changes in the concentration of a given pollutant.
We pursue this assessment by means of an empirical investigation of a sample of 115,732 house sales in the South Coast Air Quality Management District of Southern California, for which we have detailed characteristics, as well as neighbourhood measures and observations on ozone.Footnote2 We take an explicit spatial econometric approach to this problem, and, in the process, apply specialized methods for the estimation of spatial regression specifications by means of maximum likelihood (ML) that can be implemented for very large data sets. To our knowledge, ours is the largest actual house sales data set to date for which both ML estimation of the parameters in a spatial regression and inference by means of asymptotic t-values have been obtained.
In the remainder of the paper, we first provide a brief discussion of data sources and methods and give some methodological background on the four interpolators we consider. We next review three aspects of the empirical results: the spatial distribution of the interpolated ozone measures and their conversion to spatial regimes; the parameter estimates in the hedonic house price model; and the valuation of air quality in the form of marginal willingness to pay. We close with some concluding remarks.
2 Data and Estimation Methods
2.1 Data Sources
The data used in this paper come from three different sources: Experian Company (formerly TRW) for the individual house sales prices and characteristics, the 2000 US Census of Population and Housing for the neighbourhood characteristics (at the census tract level), and the South Coast Air Quality Management District for the ozone measures. The house prices and characteristics are from 115,732 sales transactions of owner-occupied single family homes that occurred during 1999 in the region, which covers four counties, namely Los Angeles, Riverside, San Bernardino and Orange. The data were geocoded, which allows for the assignment of each house to any spatially aggregate administrative district (such as a census tract or zip code zone). Geocoding is also needed for the computation of an interpolated ozone value at the location of each transaction. These ozone values are taken for the year preceding the transaction, rather than simultaneous with the transaction. In order to obtain sufficient variability (ozone measures are highly seasonal as well as spatially heterogeneous), we chose the average of the daily maximum for the worst quarter in 1998, derived from the hourly readings for 27 stations.Footnote3
Apart from the interpolated ozone values, the variables used in the hedonic specification are essentially the same as in the earlier work of Beron et al. For a detailed discussion of sources and measurement issues we therefore refer the reader to Beron et al. (Citation2004, pp. 279–281). A list and brief description of the socio-economic explanatory variables used in the analysis (house characteristics and census variables) are given in .
Table 1 . Variable names and description
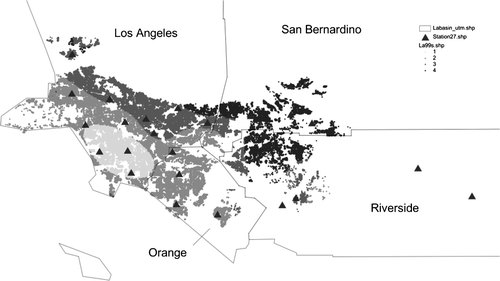
The 115,732 house sales are made up of 70,357 transactions in Los Angeles County (61% of the total), 12,523 in Riverside County (11%), 14,409 in San Bernardino County (12%), and 18,443 in Orange County (16%). The observed sales prices range from $20,000 to $5,345,455, with an overall mean of $239,518. This overall mean hides considerable variability across counties, with the values for Orange ($270,924) and Los Angeles ($267,455) Counties considerably higher than for San Bernardino ($151,249) and Riverside ($137,867) Counties. A general impression of the spatial distribution of prices (in $/m2) can be gained from , which also shows the county boundaries and the locations of the air quality monitoring stations. Note the reasonable coverage of the spatial range of sales transactions by 25 of the monitoring stations. Two stations are somewhat to the east. They will essentially be ignored in the Thiessen and IDW interpolators. Since the inclusion of these stations may provide a better fit for the Kriging and spline procedures, they have been retained in the sample.
Figure 1. Spatial distribution of price ($/m2) and location of monitoring stations.
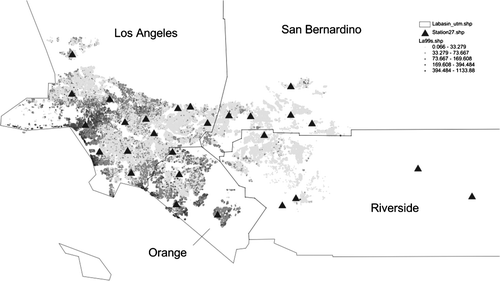
The spatial distribution of house prices (with darker colours representing higher prices) shows some concentration of higher values in the coastal area of Los Angeles and Orange Counties, as well as in the north-west edge of the basin. However, the distribution is quite heterogeneous, with small groupings of high values in both of the other counties as well.
The average of the daily maxima of the ozone values during the worst quarter of 1998, observed at the 27 monitoring stations, ranged from a low of 4.7 ppb to a high of 13.5 ppb, with an average of 8.9 ppb. We interpolate these values from the point locations of the stations to the point locations of the house transactions. In the empirical analysis, we use both the interpolated value as such, as well as indicator variables that result from a transformation of the continuous value into four discrete categories, which we refer to as ‘regimes’. The categories were inspired by the breakpoints for O3 used by the US Environmental Protection Agency to establish national ambient air quality standards (NAAQS) in effect in 1999. We label the four resulting indicators as Good (0.0–6.4 ppb), Moderate (6.5–8.4 ppb), Unhealthy1 (8.5–10.4 ppb), and Unhealthy2 (>10.4 ppb). We evaluate each interpolation method for both the continuous ozone value and the discrete categories.
2.2 Econometric Issues
We estimate a hedonic function in log-linear form, with three types of explanatory variables: house-specific characteristics, neighbourhood characteristics (measured at the census tract level), and air quality in the form of ozone (O3). We take an explicit spatial econometric approach, which includes testing for the presence of spatial autocorrelation and estimating specifications that incorporate spatial dependence. For a general overview of methodological issues involved in the specification, estimation and diagnostic testing of spatial econometric models, we refer the reader to Anselin (Citation1988), Anselin & Bera (Citation1998), and, more recently, Anselin (Citation2006). In this section, we limit our remarks to the specific test statistics and estimation methods employed in the empirical exercise. We refer the reader to the literature for detailed technical treatments.Footnote4
We follow Anselin (Citation1988) and distinguish between spatial dependence in a specification that incorporates a spatially lagged dependent variable, and a model with a spatial autoregressive error term. We refer to these as spatial lag and spatial error models. Formally, a spatial lag model is expressed as:
By means of the spatial weights matrix W, a neighbour set is specified for each location. The positive elements w ij of W are non-zero when observations i and j are neighbours, and zero otherwise. By convention, self-neighbours are excluded, such that the diagonal elements of W are zero. In addition, in practice, the weights matrix is typically row-standardized, such that ∑ j w ij =1. Many different definitions of the neighbour relation are possible, and there is little formal guidance in the choice of the ‘correct’ spatial weights.Footnote5 The term Wy in equation (Equation1) is referred to as a spatially lagged dependent variable, or spatial lag. For a row-standardized weights matrix, it consists of a weighted average of the values of y in neighbouring locations, with weights w ij .
In our application, we obtain the spatial weights matrix by first constructing a Thiessen polygon tessellation for the house locations, which turns the spatial representation of the sample from points into polygons. We next use simple contiguity (common boundaries) as the criterion to define neighbours. The resulting weights matrix is extremely sparse (0.005% non-zero weights) and contains on average six neighbours for each location (ranging from a minimum of 3 neighbours to a maximum of 35 neighbours for one observation). The weights are used in row-standardized form.
For each model specification, we first obtain ordinary least squares (OLS) estimates and assess the presence of spatial autocorrelation using the Lagrange Multiplier test statistics for error and lag dependence (Anselin, Citation1988), as well as their robust forms (Anselin et al., Citation1996).Footnote6 The results consistently show very strong evidence of positive residual spatial autocorrelation, with a slight edge in favour of the spatial lag alternative (see Section 5). In addition to considering the estimates for this specification, we also estimated the spatial error model, to further assess the sensitivity of the results to the way spatial effects are incorporated in the regression.
We use two types of estimation approaches. First, we apply the classical ML method (Ord, Citation1975; Anselin, Citation1988), but use the characteristic polynomial technique to allow the estimation in very large data sets (Smirnov & Anselin, Citation2001). We also exploit a sparse conjugate gradient method to obtain the inverse of the asymptotic information matrix (Smirnov, Citation2005). These estimation techniques and the regression diagnostics are carried out using GeoDa statistical software (Anselin et al., Citation2006). For the spatial lag model, to avoid reliance on the assumption of Gaussian errors, we also use a robust estimation technique in the form of instrumental variables (IV) estimation, or spatial two-stage least squares (Anselin, Citation1988; Kelejian & Robinson, Citation1993; Kelejian & Prucha, Citation1998). In addition, to account for the considerable remaining heteroskedasticity, we implement a heteroskedastically robust form of spatial 2SLS, which is a special case of the recently suggested HAC estimator of Kelejian & Prucha (Citation2005). Finally, for the spatial error model, we apply the generalized moments (GM) estimator of Kelejian and Prucha (Citation1999), which does not require an assumption of Gaussian error terms. The robust estimation methods were programmed as custom functions in R statistical software.
One final methodological note pertains to the assessment of model fit. In spatial models, the use of the standard R 2 measure is no longer appropriate (see Anselin, Citation1988, Ch. 14). When ML is used as the estimation method, a useful alternative measure is the value of the maximized log-likelihood, possibly adjusted for the number of parameters in the model in an Akaike Information Critesion (AIC) or other information criterion. However, for the models estimated by IV or GM, there is no corresponding measure. In order to provide for an informal comparison of the fit of the various specifications, we also report a pseudo-R 2, in the form of the squared correlation between observed and predicted values of the dependent variable. In the classical linear regression model, this is equivalent to the R 2, but in the spatial models the use of this measure is purely informal and should be interpreted with caution.
For the spatial error model, the pseudo-R
2 is simply the squared correlation between y and , where
is the estimated coefficient vector. However, in the spatial lag model the situation is slightly more complex. Since the spatially lagged dependent variable Wy is endogenous to the model, we obtain the predicted value from the expression for the conditional expectation of the reduced form:
2.3 Remaining Issues
Our main focus is on the sensitivity of estimation results to the spatial interpolation method for the ozone measure. In order to keep this investigation tractable, there are several methodological aspects that we control for and do not pursue at this stage. These include a range of issues traditionally raised in the context of hedonic model estimation, such as the sensitivity of the results to functional form, variable selection, measurement error, identification, distributional assumptions, etc.
We include ozone as a single pollutant, given its visibility (as a major cause of smog) and extensive reporting in the popular media. We do not consider other potentially relevant criteria pollutants, such as particulate matter (PM 2.5 and PM 10). We use the same functional specification in all analyses, taking the dependent variable in log-linear form and including the site-specific and neighbourhood variables used in the studies by Beron et al. (Citation2001 Citation2004). We dropped neighbourhood variables that were consistently not significant (such as a crime indicator). Arguably, more refined specifications could be considered, but this is relevant in the current context only to the extent that these would affect the estimates of the spatially interpolated ozone values differentially, which is doubtful.
We also consider only one spatial weights matrix, which implies that any interaction effect between the properties of the spatial interpolation methods and the specification of spatial weights has been ruled out. Since these are two very different approaches to dealing with spatial effects (one based on discrete locations and the other on a continuous surface), this seems a reasonable assumption.
More important is the potential effect of spatial heterogeneity, in the form of coefficient instability and the presence of spatial market segmentation. We leave this as a topic for further investigation.Footnote8 Other potentially important methodological aspects that we do not consider at this time are the possible joint determination of location choice, house purchases and environmental quality. Apart from this source of endogeneity, there is also a potential errors in variables problem in the interpolated values. Since these values are treated as ‘observations’, any error associated with them is ignored. To the extent that such error patterns may be correlated with the regression error, this may result in biased estimates (Anselin, Citation2001b).
We maintain that while these issues are important in and of themselves, they are less relevant in the current context, where the sensitivity to the different interpolation methods is our main concern. Our implicit assumption is therefore that the relative performance of the interpolation methods will not be affected by ignoring these other methodological aspects. We intend to investigate this further in future work.
3 Spatial Interpolation of Point Measures of Air Quality
In our empirical analysis, we need to allocate ozone measures obtained at the location of 27 monitoring stations to the locations of 115,732 sales transactions. This ‘point-to-point interpolation’ is the simplest among the change-of-support problems, and is well understood. The four techniques that we consider are readily available in commercial GIS software, such as ESRI's ArcGIS and its Spatial Analyst and Geostatistical Analyst extensions.
Thiessen polygons or proximity polygons (also known as Delaunay triangulation or Voronoi diagrams) are obtained by assigning to each house the value measured at the nearest monitoring station. This results in the partitioning of space into a tessellation, which corresponds to the simple notion of a spatial market area in the situation where only transportation costs matter.Footnote9 Consequently, the value for ozone follows a step function, taking on only as many different values as observed at the monitoring stations.
Inverse distance weighting is a weighted average of the values observed at the different monitors in the sample, with greater weight assigned to closer stations. In practice, due to the distance decay effect, the average only includes values observed for a few nearest neighbours. Formally, the interpolated value at j is obtained as:
Kriging is an optimal linear predictor based on a variogram model of spatial autocorrelation. This is grounded in geostatistical theory and has an established tradition in natural resource modelling. A detailed discussion of the statistical principles behind Kriging is beyond the scope of this paper, and we refer the reader to extensive treatments in Cressie (Citation1993, Ch. 3), Burrough & McDonnell (Citation1998, Ch. 6), and Schabenberger & Gotway (Citation2005, Ch. 5), among others. In our study, we used ordinary Kriging (i.e. the interpolation was based on the ozone value itself, without additional explanatory variables in the model) and allowed for directional effects in a spherical model.Footnote11
Spline interpolators are based on fitting a surface through a set of points while minimizing a smoothness functional, i.e. a function of the coordinates that represents a continuous measure of fit subject to constraints on the curvature of the surface. Parameters can be set to specify the ‘stiffness’ of the surface through a tension parameter, which can be interpreted as a measure of the extent to which any given point influences the fitted surface.Footnote12 We applied a regularized spline with the weight set at 0.1.
4 Spatial Interpolation and Air Quality Regimes
We begin with a comparison of descriptive statistics for the ozone values assigned to the house locations using each of the four interpolation procedures. summarizes the main results. While the overall averages for the four methods are very similar, the large number of observations means that standard tests on equality of means or medians strongly reject these null hypotheses.Footnote13
Table 2 . Descriptive statistics: interpolated ozone values
It is important to note the difference in variance between the interpolated measures, as well as the different range. By design, both Thiessen and IDW methods respect the range of the original observations (for the 27 monitoring stations), whereas the Kriging and spline methods do not. While the results for Kriging stay within the observed range, the spline method yields interpolated values both below as well as above the observed range. Of the four methods, Thiessen has the highest overall average (8.28) and Kriging the lowest (8.23), while Thiessen also has the highest standard deviation (2.03), due to its being a step function rather than a continuous smoother. The non-spatial correlations between the four interpolated values are extremely high, with the lowest observed between Thiessen and Kriging (0.933) and the highest between Thiessen and IDW (0.980).
The allocation of the interpolated values to the four categories of Good, Moderate, Unhealthy1 and Unhealthy2 is shown in . Interesting differences occur both at the low end and at the high end. In the best category, the largest share is obtained for the Kriging method, with 23.6%, compared to values below 20% for the others. The Thiessen method yields the largest share of houses in the worst group (20.5%), but when the two worst categories are taken together, the greatest share is for Kriging (48.6%).
Table 3 . Observations by air quality regime
The resulting spatial distributions are quite distinct as well, as illustrated in Figures . Note in particular the qualitative difference between the edges of regimes for the Thiessen and IDW interpolations, which are centred on the monitoring stations, and the much smoother patterns for Kriging and spline. Both of these show roughly parallel zones of decreasing air quality moving away from the coast. Also note the peculiar elliptical shape of the Good zone for the spline interpolator, in contrast to a region that includes most of the coastal properties in Los Angeles County and north-west Orange County for Kriging.
Figure 2. Spatial regimes for Thiessen interpolation.
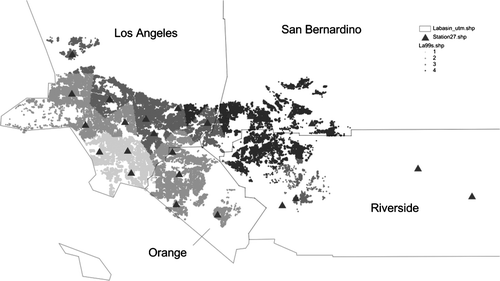
Figure 3. Spatial regimes for IDW interpolation.
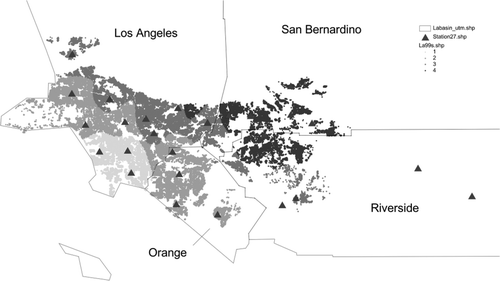
Figure 4. Spatial regimes for Kriging interpolation.
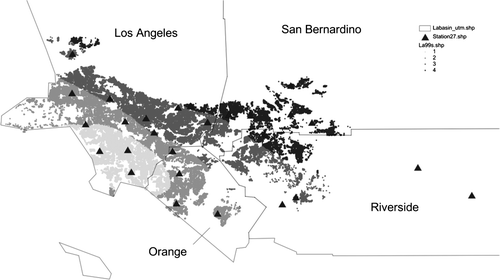
Figure 5. Spatial regimes for spline interpolation.
5 Spatial Interpolation and Parameter Estimates in Hedonic Models
We start first with a broad overview of the results before focusing more specifically on the estimates of the spatial coefficients and the parameters of the ozone variable. We estimated the hedonic model using six different methods with both a continuous and discrete (regimes) ozone variable, and for each of the four interpolators, for a total of 48 specifications. The detailed results are not listed here, and only the salient characteristics are summarized.Footnote14
The point of departure is the OLS estimation of the familiar log-linear hedonic model, which achieves a reasonable fit, ranging from an adjusted R 2 of 0.769 (Thiessen, continuous) to 0.774 (Kriging, regimes). For example, this fit is comparable to the results reported in Beron et al. (Citation2001), where the R 2 values are around 0.70 but ours is a considerably larger dataset.
There is also strong evidence of very significant positive residual spatial autocorrelation, supported by both LM-Error and LM-Lag test statistics, with a slight edge in favour of the latter alternative.Footnote15 This is not surprising, given the fine spatial grain at which we have observations on the sales transactions and the lack of such spatial detail for the neighbourhood characteristics. If we maintain the spatial lag model as the proper alternative, the OLS estimates are biased and should be interpreted with caution.
For each interpolator, and in both the continuous and discrete instances, the spatial lag specification obtains the best fit, and all spatial models fit the data considerably better than the non-spatial OLS. This is a further indication that the latter may yield biased estimates. To illustrate the improvement in fit, consider the best interpolator, Kriging, for which the log-likelihood improves in the continuous case from −16,927 in the standard regression model to −7,119 in the spatial lag model (the R 2 value goes from 0.772 to a pseudo-R 2 of 0.814). Similar improvements are obtained for the other specifications.
Interestingly, the relative fit of the four interpolators is consistent across all estimation methods and for both the continuous and regimes ozone variable. In each case, Kriging is best, followed by spline and IDW, with Thiessen as worst. Also, in all but one instance (Thiessen, Lag-ML), the regimes model fits the data better than the continuous one.
For OLS, the coefficient estimates for the house and neighbourhood characteristics are significant and with the expected sign, except for Elevation and AC, which were both found to be negative. The Elevation coefficient may in part capture an interaction effect with air quality, but the negative value for AC does not have an obvious explanation. The base case for the counties is Los Angeles, with negative dummies in increasing order of absolute value for Orange, San Bernardino and Riverside.
The main difference between OLS and the spatial lag models lies in the absolute magnitude of the estimates, with consistently much smaller values in the spatial lag specification, as is to be expected. However, note that the OLS estimates may be suspect, given the strong indication in favour of the lag specification.Footnote16 The signs and significance are maintained for all but the coefficient of Income, which becomes negative in Lag-ML. However, this is only significant for Thiessen and IDW under ML estimation, but not for the other two methods. Also, the significance disappears for the IV and IV-Robust estimates (in the latter the coefficient is positive, but not significant).
A closer look at the estimates for the spatial autoregressive parameter is provided in . All estimated coefficients are highly significant, with slightly higher magnitudes for the spatial autoregressive error parameter (but note that the spatial error model is inferior in terms of fit relative to the spatial lag model). The spatial autoregressive lag coefficient ranges from 0.376 (Kriging, Lag-IV) to 0.446 (Thiessen, Lag-ML). The largest estimates are consistently for the Thiessen interpolator, and the smallest for Kriging. The ranking between estimation methods is consistent as well, with the estimate for Lag-IVR between the higher Lag-ML and the lower Lag-IV. As is to be expected, the estimated standard error is largest for the robust estimator. Relative to the continuous results, the Lag-ML estimates are smaller for the regimes models, but slightly larger for both IV estimators. However, when taking into account the standard errors of the estimates, there is little indication of a significant effect of the interpolator on the estimate of the spatial parameter. For example, consider the two estimates for the lag parameter using IVR for Kriging + 2 standard errors, or, 0.3988 + 0.0148 = 0.4136 for continuous ozone, and 0.4039 + 0.0148 = 0.4187 for the regimes. In each case, the point estimates for the other interpolators are included in this interval, suggesting they do not differ significantly.
Table 4 . Estimates for spatial autoregressive parametera
The situation is quite different for the ozone parameters, where we find a distinct and significant effect of the interpolator. The details are summarized in for the continuous measure, and for the regimes.
Table 5 . Estimates for ozone parameter (continuous model)a
Table 6 . Estimates for ozone regime parametersa
As shown in , all the estimates for the continuous ozone variable are highly significant and have the expected negative sign. Relative to OLS and the spatial error models, the absolute values are considerably smaller in the spatial lag model, for example, going from −0.0270 for OLS Kriging to −0.0179 for Lag-ML Kriging. Interestingly, this is less the case for the Thiessen interpolator. The Kriging value is consistently the largest in absolute value, and exceeds the others by more than 2 standard errors. The Thiessen value is consistently the smallest in absolute value. IDW and spline are not significantly different from each other and are in between these two extremes.
The differences between the interpolators are accentuated in the regimes results (). For OLS, the estimates for the Moderate category are counterintuitive, being positive and significant. This is also the case for the Unhealthy1 category using the Thiessen and IDW interpolators. In contrast, the corresponding estimates for Kriging and spline are significant and negative. Only for the worst category (Unhealthy2) are the estimates negative across all interpolators, with the value for Kriging significantly larger in absolute value than the others (again, with Thiessen yielding the smallest value). These results are essentially the same in the spatial error models, only with larger standard errors.
The main difference occurs for the spatial lag specifications. Here, the Kriging interpolator yields results consistent with expectations. Even though the estimate for Moderate is positive, it is not significant, and both Unhealthy categories are highly significant and negative, with a larger absolute value for the worst category. The three other interpolators maintain a positive and significant value for Moderate. For Thiessen and IDW, Unhealthy1 is positive as well, although no longer significant for the latter. Spline has negative and significant values for Unhealthy1.
Overall, these results would suggest that the Kriging interpolator in a spatial lag specification is the only one that yields estimates for a categorical air quality variable consistent with expectations. This confirms earlier indications that this model also obtained the best fit.
6 The Valuation of Air Quality
We conclude this empirical exercise by comparing the valuation of air quality as computed from the parameter estimates for the different interpolators. Theory suggests that the partial derivative of the hedonic price equation with respect to each explanatory variable yields its implicit price. Assuming that the housing market is in equilibrium, this can be interpreted as the marginal willingness to pay (MWTP) for a non-traded good such as air quality.Footnote17 Since our specification is log-linear, this yields:
We begin by comparing the ‘analytical’ MWTP estimates for each of the interpolators between OLS and the spatial lag model that result from a 1 ppb decrease in the value of the ozone variable. This change is assumed to apply uniformly throughout the sample and amounts, on average, to a 12% decrease. For the standard case (OLS), we apply equation (Equation6), with a value of $239,518 for the average house price in the sample. The results are reported in , where both the dollar amounts and the corresponding percentage of the house price are listed. Also, an approximate measure of the precision of the point estimate is given, obtained by computing the value for the parameter estimate ±2 standard errors. For the spatial lag model we use equation (Equation7), with the estimates for and the corresponding standard errors from the IVR method. Note that our reported ‘standard errors’ in the spatial lag case are an underestimate of uncertainty, since the spatial parameter is assumed fixed (only the parameter values for ozone are changed). This provides a reasonable approximation of the relative precision, but does not correspond to an analytical estimate of the overall standard error (e.g. as yielded by the delta method).
Table 7 . Analytical marginal willingness to pay, by interpolatora
Before comparing the MWTP estimates between the non-spatial OLS results and the spatial lag model, note that the absolute value of the parameter estimate for ozone in the latter is considerably smaller than for OLS. As illustrated in , this is more than compensated for by the spatial multiplier effect. In all instances, the estimated MWTP for the spatial lag model is considerably larger than for the matching OLS case.
There are also considerable differences between interpolators. The largest MWTP estimate is for Kriging in the spatial lag model. This value of $7,444 exceeds that of all the other interpolators by some $1,500. In the OLS case also, the Kriging estimate of $6,468 is much higher than the others. The smallest estimate is for Thiessen, as low as $3,028 for OLS and $4,087 for the spatial lag model. In percentage terms, this ranges from 1.26% for Thiessen OLS to 3.11% for Kriging spatial lag.
The analytical approach breaks down for the categorical measures of air quality. Also, the uniform decrease of the ozone value throughout the sample does not fully account for a possible differential effect of the interpolation methods. To assess this more closely we introduce a simulation approach, based on re-interpolating values from the locations of the monitoring stations to the house locations. We lower the value observed at each station by 1 ppb and obtain new measures for each house location by interpolating. Note that, except for the Thiessen method, this does not result in a uniform decrease for each house, since the interpolators are non-linear. Finally, we compute the predicted price for each house using the new ozone value (holding the other parameters and observed characteristics constant) and compare this to the original sales price. In this process, we need to take account of the spatial multiplier to obtain the predicted value in the spatial lag model. Since the change in the variable is not uniform across space, the simplifying result used in equation (Equation7) no longer holds. Instead, we must use the reduced form explicitly, as in equation (Equation4). As before, we obtain an approximate measure of precision by carrying out the calculation for the parameter value ±2 standard errors.
In contrast to the analytical approach, this method can be used for both the continuous and categorical ozone models, since the newly interpolated ozone value can be reallocated to one of the four regimes. Also, since the predicted price is computed for each individual house, the results can be presented for any degree of spatial aggregation.
The new relative distribution of observations that results from the allocation of the interpolated values to the four regimes is given in . This should be compared to the percentages in . The new interpolation results in a drastic shift of observations out of the Unhealthy2 category.
Table 8 . Reallocation of observations by air quality regime
The simulated MWTP values for the continuous ozone model are reported in as an average for the full sample. Relative to the analytical results (), the estimates are similar in magnitude, although uniformly somewhat smaller, ranging from a low of $2,895 for Thiessen OLS to a high of $6,961 for Kriging spatial lag. As before, the values differ greatly across interpolators, with Kriging yielding the highest estimates and Thiessen the lowest. Also, again the values are greater for the spatial lag model relative to OLS, although to a lesser extent than in the analytical approach.
Table 9 . Simulated marginal willingness to pay, continuous modela
A final assessment is presented in , where the estimated MWTP is given for both continuous and regimes models, and reported for the complete sample as well as for each county. Two major features stand out. First, considering the totals only, the values for the regime models are clearly deficient in the OLS case, a direct result of the wrong signs obtained for the parameter estimates. Only for the Kriging interpolator are they comparable to previous results.
Table 10 . Simulated marginal willingness to pay, by countya
Second, the aggregate values mask considerable spatial heterogeneity, especially for the regime models. For example, taking the Lag-IVR results for Kriging (i.e. using the estimates with the best fit), the impact ranges from a low of $266 for Orange County to a high of $14,013 (9.7%) for San Bernardino County. This pattern contrasts with the results for the continuous measure, where the highest dollar impact (for Kriging) is for Orange County ($7,413), although the highest percentage impact remains for San Bernardino County (4.15%). In addition, even with the Lag-IVR results, negative impacts are obtained in Orange County for the three other interpolators. This suggests that spatial heterogeneity may need to be taken into account by more than a county indicator variable. It also highlights the fact that a sole focus on spatially aggregate indicators of valuation (such as the average across the region) may be misleading.
7 Conclusion
Our empirical analysis re-emphasizes the importance of the need to explicitly account for spatial autocorrelation and spatial heterogeneity in the estimation of hedonic house price models: space matters. There was very strong evidence of the presence of positive spatial autocorrelation, even after controlling for the same house characteristics and neighbourhood variables used in previous empirical analyses of this housing market. In our (dense) sample of transactions, a spatial lag model yielded the best results. Consequently, ignoring this aspect, as is the case in a traditional OLS estimation, would yield estimates that are most likely biased. This is important in the current context, since the parameter estimates are directly linked to an economic interpretation, such as the valuation of air quality. In addition to spatial autocorrelation, a high degree of heteroskedasticity warranted the use of a heteroskedastically robust estimator. There is some indication that simply including indicator variables for the counties (as submarkets) may not be sufficient to address spatial heterogeneity.
More importantly, we found that the manner in which ozone measures are spatially interpolated to the locations of house sales transactions has a significant effect on the estimate of the air quality parameter in the hedonic equation and on the associated estimate of marginal willingness to pay. Simple solutions, such as Thiessen polygons, may lead to nonsensical results for the economic implications of the model. While the coefficients of the other variables did not change much across interpolators, this was not the case for the ozone parameter.
Of the four methods, the Kriging interpolator consistently yielded the best fit, as well as the most reasonable parameter signs and magnitudes, and related measures of marginal willingness to pay. In addition, there was some indication that the use of categorical variables rather than a continuous ozone measure was superior. In order to deal with the lack of continuity of such variables, we employed a simulation method to estimate the change in house value associated with a decrease in ozone levels. This revealed the importance of spatial scale, and results at the county level that were vastly different from the regional aggregate.
While several methodological issues remain to be addressed, our findings suggest that the quality of the spatial interpolation deserves the same type of attention in the specification and estimation of hedonic house price models as more traditional concerns. In future work, we intend to further investigate the role of spatial heterogeneity and the potential endogeneity of the air quality measure.
Acknowledgments
Their valuable input is gratefully acknowledged. The research was supported in part by NSF Grant BCS-9978058 to the Center for Spatially Integrated Social Science (CSISS), and by NSF/EPA Grant SES-0084213. Julie Le Gallo also gratefully acknowledges financial support from Programme APR S3E 2002, directed by H. Jayet, entitled ‘The economic value of landscapes in periurban cities’ (Ministère de l'Ecologie et du Développement Durable, France).
Notes
This paper is part of a joint research effort with James Murdoch (University of Texas, Dallas) and Mark Thayer (San Diego State University). Earlier versions were presented at the 51st North American Meeting of the Regional Science Association International, Seattle, WA, November 2004, the Spatial Econometrics Workshop, Kiel, Germany, April 2005, and at departmental seminars at the University of Illinois, Ohio State University, the University of California, Davis, and the University of Pennsylvania. Comments by participants are greatly appreciated. The usual disclaimer holds.
1. For an extensive empirical assessment of spatial interpolation methods applied to ozone mapping, see, for example, Phillips et al. (Citation1997) and Diem (Citation2003).
2. Other studies of the relation between house prices and air quality in this region can be found in Graves et al. (Citation1988) and Beron et al. (Citation1999, Citation2001, Citation2004), although only Beron et al. (2004) takes an explicitly spatial econometric approach. Also of interest is a general equilibrium analysis of ozone abatement in the same region, using a hierarchical locational equilibrium model, outlined in Smith et al. (Citation2004).
3. Owing to missing values, some stations had to be dropped from the complete set of stations available in the region during that time period.
4. For recent collections reviewing the state of the art, see also Florax & van der Vlist (Citation2003), Anselin et al. (Citation2004), Getis et al. (Citation2004), LeSage et al. (Citation2004), LeSage & Pace (Citation2004) and Pace & LeSage (Citation2004).
5. For a more extensive discussion, see Anselin (Citation2002, pp. 256–260), and Anselin (Citation2006, pp. 909–910).
6. See Anselin (Citation2001a), for an extensive review of statistical issues.
7. This is implemented in the Python language-based PySAL library of spatial analytical routines; see http://sal.uiuc.edu/projects_pysal.php
8. This is in addition to potential problems caused by the use of aggregate (census-tract level) variables in the explanation of individual house prices (see Moulton, Citation1990).
9. For an extensive technical treatment of tessellations, see Okabe et al. (Citation1992).
10. For further discussion of IDW, see, for example, Longley et al. (Citation2001, pp. 296–297).
11. The estimated parameter values were 302 and 7 for the direction (angle), 6 and 192 for the partial sill, 199,490 for the major range and 67,334 for the minor range. All Kriging interpolations were carried out with the ESRI ArcGIS Geostatistical Analyst extension.
12. For a technical discussion, see, for example, Mitasova & Mitas (Citation1993) and Mitas & Mitasova (Citation1999).
13. The detailed results are not reported here, but available from the authors.
14. The detailed results are available from the authors and are included in an earlier Working Paper version.
15. The detailed test statistics are not reported, but are available from the authors. All test statistics are significant with a p-value of less than 0.0000001 (the greatest precision reported by the software).
16. Since the spatial error model is consistently inferior in fit relative to the lag specification, we will not discuss it in detail here. The main distinguishing characteristic of the findings is the difference in estimated standard errors between OLS and the spatial error model. As a result, the coefficient of AC and of Poverty is no longer significant in the spatial error model.
17. In addition to the equilibrium assumption, this interpretation is further complicated by the fact that the estimated marginal benefits represent the capitalized rather than the annual value of the benefits of air quality improvement. Therefore, other considerations, such as the length of time the buyer expects to reside in the house, the discount rate and projected time path for air quality should all be taken into account (see also Kim et al., Citation2003, pp. 34–37, for further discussion).
Related Research Data
References
- Anselin , L. 1988 . Spatial Econometrics: Methods and Models , Dordrecht : Kluwer .
- Anselin , L. 1998 . GIS research infrastructure for spatial analysis of real estate markets . Journal of Housing Research , 9 ( 1 ) : 113 – 133 .
- Anselin , L. 2001a . Rao's score test in spatial econometrics . Journal of Statistical Planning and Inference , 97 : 113 – 139 .
- Anselin , L. 2001b . Spatial effects in econometric practice in environmental and resource economics . American Journal of Agricultural Economics , 83 ( 3 ) : 705 – 710 .
- Anselin , L. 2002 . Under the hood. Issues in the specification and interpretation of spatial regression models . Agricultural Economics , 27 ( 3 ) : 247 – 267 .
- Anselin , L. 2006 . “ Spatial econometrics ” . In Palgrave Handbook of Econometrics. Vol. 1: Econometric Theory , Edited by: Mills , T. and Patterson , K. 901 – 969 . Basingstoke : Palgrave Macmillan .
- Anselin , L. and Bera , A. 1998 . “ Spatial dependence in linear regression models with an introduction to spatial econometrics ” . In Handbook of Applied Economic Statistics , Edited by: Ullah , A. and Giles , D. E. 237 – 289 . New York : Marcel Dekker .
- Anselin , L. , Bera , A. , Florax , R. J. and Yoon , M. 1996 . Simple diagnostic tests for spatial dependence . Regional Science and Urban Economics , 26 : 77 – 104 .
- Anselin , L. , Florax , R. J. and Rey , S. J. 2004 . Advances in Spatial Econometrics. Methodology, Tools and Applications , Berlin : Springer .
- Anselin , L. , Syabri , I. and Kho , Y. 2006 . GeoDa, an introduction to spatial data analysis . Geographical Analysis , 38 : 5 – 22 .
- Banerjee , S. , Carlin , B. P. and Gelfand , A. E. 2004 . Hierarchical Modeling and Analysis for Spatial Data , Boca Raton, FL : Chapman & Hall/CRC .
- Basu , S. and Thibodeau , T. G. 1998 . Analysis of spatial autocorrelation in housing prices . Journal of Real Estate Finance and Economics , 17 : 61 – 85 .
- Beron , K. J. , Hanson , Y. , Murdoch , J. C. and Thayer , M. A. 2004 . “ Hedonic price functions and spatial dependence: implications for the demand for urban air quality ” . In Advances in Spatial Econometrics: Methodology, Tools and Applications , Edited by: Anselin , L. , Florax , R. J. and Rey , S. J. 267 – 281 . Berlin : Springer .
- Beron , K. J. , Murdoch , J. C. and Thayer , M. A. 1999 . Hierarchical linear models with application to air pollution in the South Coast Air Basin . American Journal of Agricultural Economics , 81 : 1123 – 1127 .
- Beron , K. , Murdoch , J. and Thayer , M. 2001 . The benefits of visibility improvement: new evidence from the Los Angeles metropolitan area . Journal of Real Estate Finance and Economics , 22 ( 2–3 ) : 319 – 337 .
- Boyle , M. A. and Kiel , K. A. 2001 . A survey of house price hedonic studies of the impact of environmental externalities . Journal of Real Estate Literature , 9 : 117 – 144 .
- Brasington , D. M. and Hite , D. 2005 . Demand for environmental quality: a spatial hedonic analysis . Regional Science and Urban Economics , 35 : 57 – 82 .
- Burrough , P. A. and McDonnell , R. A. 1998 . Principles of Geographical Information Systems , Oxford : Oxford University Press .
- Chattopadhyay , S. 1999 . Estimating the demand for air quality: new evidence based on the Chicago housing market . Land Economics , 75 : 22 – 38 .
- Chay , K. Y. and Greenstone , M. 2005 . Does air quality matter? Evidence from the housing market . Journal of Political Economy , 113 ( 2 ) : 376 – 424 .
- Cressie , N. 1993 . Statistics for Spatial Data , New York : John Wiley .
- Diem , J. E. 2003 . A critical examination of ozone mapping from a spatial-scale perspective . Environmental Pollution , 125 : 369 – 383 .
- Dubin , R. , Pace , R. K. and Thibodeau , T. G. 1999 . Spatial autoregression techniques for real estate data . Journal of Real Estate Literature , 7 : 79 – 95 .
- Florax , R. J. G. M. and van der Vlist , A. 2003 . Spatial econometric data analysis: moving beyond traditional models . International Regional Science Review , 26 ( 3 ) : 223 – 243 .
- Freeman III , A. M. 2003 . The Measurement of Environmental and Resource Values, Theory and Methods , 2nd edn , Washington, DC : Resources for the Future Press .
- Getis , A. , Mur , J. and Zoller , H. G. 2004 . Spatial Econometrics and Spatial Statistics , London : Palgrave Macmillan .
- Gillen , K. , Thibodeau , T. G. and Wachter , S. 2001 . Anisotropic autocorrelation in house prices . Journal of Real Estate Finance and Economics , 23 ( 1 ) : 5 – 30 .
- Gotway , C. A. and Young , L. J. 2002 . Combining incompatible spatial data . Journal of the American Statistical Association , 97 : 632 – 648 .
- Graves , P. , Murdoch , J. C. , Thayer , M. A. and Waldman , D. 1988 . The robustness of hedonic price estimation: urban air quality . Land Economics , 64 : 220 – 233 .
- Harrison , D. and Rubinfeld , D. L. 1978 . Hedonic housing prices and the demand for clean air . Journal of Environmental Economics and Management , 5 : 81 – 102 .
- Kelejian , H. H. and Prucha , I. 1998 . A generalized spatial two stage least squares procedures for estimating a spatial autoregressive model with autoregressive disturbances . Journal of Real Estate Finance and Economics , 17 : 99 – 121 .
- Kelejian , H. H. and Prucha , I. 1999 . A generalized moments estimator for the autoregressive parameter in a spatial model . International Economic Review , 40 : 509 – 533 .
- Kelejian , H. H. & Prucha , I. R. (2005) HAC Estimation in a Spatial Framework , Working paper, Department of Economics, University of Maryland, College Park, MD .
- Kelejian , H. H. and Robinson , D. P. 1993 . A suggested method of estimation for spatial interdependent models with autocorrelated errors, and an application to a county expenditure model . Papers in Regional Science , 72 : 297 – 312 .
- Kim , C.-W. , Phipps , T. T. and Anselin , L. 2003 . Measuring the benefits of air quality improvement: a spatial hedonic approach . Journal of Environmental Economics and Management , 45 : 24 – 39 .
- LeSage , J. P. and Pace , R. K. 2004 . Advances in Econometrics: Spatial and Spatiotemporal Econometrics , Oxford : Elsevier Science .
- LeSage , J. P. , Pace , R. K. and Tiefelsdorf , M. 2004 . Methodological developments in spatial econometrics and statistics . Geographical Analysis , 36 : 87 – 89 .
- Longley , P. A. , Goodchild , M. F. , Maguire , D. J. and Rhind , D. W. 2001 . Geographic Information Systems and Science , Chichester : John Wiley .
- Mitas , L. and Mitasova , H. 1999 . “ Spatial interpolation ” . In Geographical Information Systems: Principles, Techniques, Management and Applications , Edited by: Longley , P. A. , Goodchild , M. F. , Maguire , D. J. and Rhind , D. W. 481 – 492 . New York : Wiley .
- Mitasova , H. and Mitas , L. 1993 . Interpolation by regularized spline with tension: I, theory and implementation . Mathematical Geology , 25 : 641 – 655 .
- Moulton , B. R. 1990 . An illustration of a pitfall in estimating the effects of aggregate variables on micro units . Review of Economics and Statistics , 72 : 334 – 338 .
- Okabe , A. , Boots , B. and Sugihara , K. 1992 . Spatial Tessellations: Concepts and Applications of Voronoi Diagrams , Chichester : John Wiley .
- Ord , J. K. 1975 . Estimation methods for models of spatial interaction . Journal of the American Statistical Association , 70 : 120 – 126 .
- Pace , R. K. , Barry , R. and Sirmans , C. 1998 . Spatial statistics and real estate . Journal of Real Estate Finance and Economics , 17 : 5 – 13 .
- Pace , R. K. and LeSage , J. P. 2004 . Spatial statistics and real estate . Journal of Real Estate Finance and Economics , 29 : 147 – 148 .
- Palmquist , R. B. 1991 . “ Hedonic methods ” . In Measuring the Demand for Environmental Quality , Edited by: Braden , J. B. and Kolstad , C. D. 77 – 120 . Amsterdam : North-Holland .
- Palmquist , R. B. and Israngkura , A. 1999 . Valuing air quality with hedonic and discrete choice models . American Journal of Agricultural Economics , 81 : 1128 – 1133 .
- Phillips , D. L. , Lee , E. H. , Herstrom , A. A. , Hogsett , W. E. and Tingey , D. T. 1997 . Use of auxiliary data for spatial interpolation of ozone exposure in southeastern forests . Environmetrics , 8 : 43 – 61 .
- Ridker , R. and Henning , J. 1967 . The determinants of residential property values with special reference to air pollution . Review of Economics and Statistics , 49 : 246 – 257 .
- Schabenberger , O. and Gotway , C. A. 2005 . Statistical Methods for Spatial Data Analysis , Boca Raton, FL : Chapman & Hall/CRC .
- Smirnov , O. 2005 . Computation of the information matrix for models with spatial interaction on a lattice . Journal of Computational and Graphical Statistics , 14 : 910 – 927 .
- Smirnov , O. and Anselin , L. 2001 . Fast maximum likelihood estimation of very large spatial autoregressive models: a characteristic polynomial approach . Computational Statistics and Data Analysis , 35 : 301 – 319 .
- Smith , V. K. and Huang , J.-C. 1993 . Hedonic models and air pollution: 25 years and counting . Environmental and Resource Economics , 3 : 381 – 394 .
- Smith , V. K. and Huang , J.-C. 1995 . Can markets value air quality? A meta-analysis of hedonic property value models . Journal of Political Economy , 103 : 209 – 227 .
- Smith , V. K. , Sieg , H. , Banzhaf , H. S. and Walsh , R. P. 2004 . General equilibrium benefits for environmental improvements: projected ozone reductions under EPA's Prospective Analysis for the Los Angeles air basin . Journal of Environmental Economics and Management , 47 : 559 – 584 .
- Zabel , J. and Kiel , K. 2000 . Estimating the demand for air quality in four U.S. cities . Land Economics , 76 : 174 – 194 .