Abstract
With the 2004 enlargement to the East, the EU regional growth process can no longer be seen in the frame of the traditional core–periphery pattern. This is why this article proposes an innovative methodology to endogenously detect convergence clubs while accounting for spatial autocorrelation across regions. Our model is estimated on 244 EU25 regions over 1991–2003. Our results indicate that four distinctive clubs are present in our sample. In addition, the model we use does not rely on the traditional neoclassical model but on Verdoorn's law, which allows us to account for the presence of increasing returns to scale. Our conclusions give new insights for policy makers interested in convergence and regional policies developed to promote it.
Abstract
Le processus de la croissance régionale européenne revisité
Avec son élargissement vers les pays de l'Est, le processus de croissance régionale de l'Union européenne ne peut plus être pris en considération dans le cadre d'un modèle traditionnel de périphérie du cœur. C'est la raison pour laquelle cet article propose une méthodologie novatrice afin de détecter de façon endogène les clubs de convergence tout en comptant l'autocorrélation spatiale sur toutes les régions. Notre modèle a été estimé sur 25 régions de l'Union européenne entre 1991 et 2003. Nos résultats indiquent que 4 clubs distinctifs sont présents dans notre échantillon. En outre, le modèle que nous utilisons ne dépend pas du modèle néoclassique traditionnel, mais de la loi de Verdoorn, qui nous permet de compter la présence d'un nombre croissant de rendements d’échelle. Nos conclusions donnent un nouvel aperçu aux responsables politiques qui s'intéressent à la convergence et aux politiques régionales développées pour sa promotion.
Abstract
El proceso de crecimiento regional europeo revisado
Con la expansión hacia el Este en el 2004, el proceso de crecimiento regional de la Unión Europea no puede ser visto dentro del marco del patrón centro-periferia tradicional nunca más. Por esta razón, este artículo propone una metodología innovadora para detectar endogenamente los clubes de convergencia, mientras se cuenta la autocorrelación espacial a través de las regiones. Nuestro modelo se basa en 244 regiones de los 25 países de la Unión Europea entre 1991 y 2003. Nuestros resultados revelan la presencia de 4 clubes distintivos en nuestra muestra. Además, el modelo que usamos no se basa en el modelo tradicional neoclásico, sino en la ley de Verdoorn que nos permite contar con la presencia de rendimiento creciente a escala. Nuestras conclusiones aportan nuevas perspectivas a las autoridades responsables de redactar políticas de exterior interesadas en la convergencia y las políticas regionales desarrolladas para promoverla.
Introduction
Since Solow's 1956 famous article, economic growth and its empirics have been some of the most debated issues in economics. Accordingly, regional scientists have spent much effort in finding the sources and the characteristics of the regional growth process. While there is no consolidated agreement on which factor should be considered as a significant source of economic growth (with the sole exception of investment in private and human capital), the literature has shown convincingly that space does matter in shaping regional growth (see, for instance, Abreu et al., Citation2005, for a literature review). In particular, it has been proved repeatedly that both spatial autocorrelation and spatial heterogeneity are undoubtedly important factors in the European convergence process (see, for instance, Ertur et al., Citation2006; Le Gallo & Dall'erba, Citation2006). Indeed, while the growth rate of a region seems to be positively and significantly correlated with the growth rate of neighbouring regions (i.e. spatial autocorrelation), the dualism of the European development process (i.e. spatial heterogeneity) is so striking that the idea of convergence clubs has attracted much attention (see Krugman, Citation1991; Fujita et al., Citation1999 for a theoretical approach and Neven & Gouyette, Citation1995; Le Gallo et al., Citation2003; Canova, Citation2004; Corrado et al., Citation2005; Dall'erba, Citation2005 for empirical works).
This article proposes to treat spatial heterogeneity in a very innovative way compared to previous contributions. This is true for two reasons: first, we focus on the regional growth process of the EU25. Because of the important development gap of the new member countries compared to the old ones, it does not make sense to think about the core–periphery pattern which has so often been described for the EU12 or 15. At the same time, many regions of the EU15 peripheral countries are still lagging behind compared to the core regions. Spatial heterogeneity at the regional level has therefore increased tremendously with the 2004 enlargement to the East. Although there is an extensive literature on the economics of East European transition and on the economic geography of European enlargement at a national level (see, inter alia, Baldwin et al., Citation1997; Sachs, Citation1997), there are still few studies which point out the relevance of the regional dimension of those processes. Exceptions are Petrakos (Citation1996), Blomstrom & Kokko (Citation1997), Bachtler & Downes (Citation1999), Traistaru & Wolff (Citation2002) and Boldrin & Canova (Citation2003).
The second novelty is on the detection of spatial heterogeneity. Various methodologies have been developed in the literature to consider and detect convergence clubs (i.e. Durlauf & Johnson, Citation1995; Berthelemy & Varoudakis, Citation1996; Desdoigts, Citation1999; Canova, Citation2004; Corrado et al., Citation2005). However, these methodologies do not take into consideration spatial effects in detecting the clubs of convergence. Indeed, because of the important geographical component of the data upon which these types of analysis are based, we believe that an appropriate methodology should take spatial effects into account. The applications published so far that include spatial autocorrelation in the detection of spatial heterogeneity among EU regions rely on the tools of exploratory spatial data analysis (Le Gallo et al., Citation2003; Dall'erba, Citation2005). However, their approach is limited in the sense that it cannot determine more than two clubs. As stated above, the assumption of only two regimes is extremely restrictive in the cases of big and heterogeneous samples. Hence, the present paper attempts to fill this gap and proposes a methodology which relies on the endogenous club detection approach proposed by Berthelemy and Varoudakis (Citation1996). The basic idea is to avoid the a priori exogenous choice of the number of clubs (as in Durlauf & Johnson, Citation1995) and use the model itself to determine the clubs. We perform successive F-tests on coefficient stability (Chow tests) between two successive clubs of which the break point moves forward by one observation each time. We improve the strategy of Berthelemy & Varoudakis (Citation1996) in two different ways. First, we estimate a spatial error specification so that spatial autocorrelation is directly accounted for in the club identification procedure. Second, we do not stop the process once the first club has been detected. In fact, the same procedure is repeated on the remaining sample to verify whether it is also composed of two (or more) other sub-groups.
In addition to the club selection methodology, our article distinguishes itself from previous works because of the convergence model we use. Indeed, in the European context, most of the literature focusing on convergence (in a spatial framework or not) relies on some form of the famous beta-convergence developed by Solow (Citation1956).Footnote1 However, this model has proved to present many drawbacks such as the Galton's fallacy and doubts about the relevance of the assumption of constant returns to scale, upon which it relies, have been raised (Friedman, Citation1992; Quah, Citation1993; Durlauf & Quah, Citation1999; Temple, Citation1999). As a result, an interesting alternative to (or at least part of) the weaknesses of the neoclassical theory is Verdoorn's law (Citation1949) the nucleus of which consists in accounting for the presence of increasing returns. First proposed by Kaldor (Citation1957) and successively extended by Kaldor (Citation1970) and Dixon & Thirlwall (Citation1975), the law states that a pattern of cumulative causation growth rises from a linear relationship between labour productivity growth and output growth in the manufacturing sector. The model is thus characterized by the presence of multiple steady states, or, put another way, each region potentially converges to a different constant output growth rate (McCombie & Thirlwall, Citation1994). The second advantage of focusing on regional disparities in productivity levels (instead of differences in per capita levels) is to allow for changes in the living standards of an economy since they are dependent in the long run upon labour productivity increases (Melachroinos & Spence, Citation1999). In addition, productivity dynamics have often been analysed at the national level (Baumol, Citation1986; Dollar & Wolff, Citation1993; Doyle & O'Leary, Citation1999) but much less at the regional level. Finally, regional policies implemented in backward regions (transportation infrastructures, subsidies to firms, human capital improvement) act directly on the production function of firms and thus may favour the productivity levels in the poor regions but not necessarily their per capita income levels (Lopez-Bazo et al., Citation1999).
The paper is organized as follow. In Section 2 we present the European enlargement process and its consequences on regional disparities. We also draw the characteristics of the model we use. The data set and the weight matrix are described in Section 3. Cross-sectional estimates and the methodology we develop to endogenously define spatial heterogeneity are presented in Section 4. The final section discusses the results and adds some concluding remarks.
2 Regional Growth and EU Enlargement
The enlargement of the EU to Central and Eastern countries as well as to Cyprus and Malta is broadly recognized as a source of political concern because of the widening of economic disparities. In fact, according to the Second and Third Reports on Socio-economic Cohesion (European Commission, Citation2003, Citation2004), the enlargement has resulted in a 21% increase in the European area, a 19% increase in the total population, but only a 10% increase in the total GDP, which led to an 8% decrease in per capita GDP.Footnote2
The process of accession of new countries is likely to have resulted in deep changes in the geography of European development by shifting from the historical North/South dualism to the North-west/East disparities in terms of per capita GDP (Ertur & Koch, Citation2005).
As argued convincingly by several authors (see Abreu et al., Citation2005 and Rey & Janikas, Citation2005 for literature reviews), spatial interaction can be regarded as a significant determinant of the processes of growth and convergence in the European context. This effect manifests itself both in terms of spatial autocorrelation and heterogeneity. Positive (negative) spatial autocorrelation is defined as the coincidence of value similarities (dissimilarities) in neighbour locations (Anselin, Citation1988). In other words, this effect is meant to capture the source of dependence of a variable over space. Spatial dependence can also be thought of as a measure of spatial spillovers among areal units. On the other hand, spatial heterogeneity measures the stability of variables across space. It can be reflected by varying coefficients (structural instability) and/or by varying error variances across observations (groupwise heteroskedasticity).
In the spirit of a number of papers claiming the central role played by space in the determination of the process of economic growth in the EU (see, for instance, Le Gallo et al., Citation2003), a change in the geography of development is likely to affect growth and its transmission mechanisms over space. The magnitude and the sign of the impact of the enlargement on regional growth are not known a priori. As pointed out in the economics literature, the growth process induced by enlargement is likely to be driven by foreign direct investment flows from West to East (Altomonte & Resmini, Citation2002; Markusen & Venables, Citation1999), an increase in international trade flows (Resmini & Traistaru, Citation2003), a modified allocation of regional policy instruments (structural funds and cohesion funds—see Dall'erba & Le Gallo, Citation2007) and inter-regional as well as international migration flows (Boldrin & Canova, Citation2003).
However, in this paper we are interested in investigating the link between the spatial structure of development and its impact on the economic growth of the EU regions over the last decade.Footnote3 At the heart of this approach lies Verdoorn's law as developed by Kaldor (Citation1957, Citation1970), which aims at explaining the link between productivity and output growth rates and explicitly tests for the presence of increasing returns.Footnote4 A former contribution based on this approach can be found in Fingleton (Citation2001) where the dynamic Verdoorn's law is written as:
In order to extend equation (Equation1), let us consider a Cobb–Douglas production function of the form:
Unfortunately extension at the regional level is not feasible because of the absence of capital stock data at this spatial level. As an alternative, we could have used the net investment–output ratio and assumed a constant capital–output ratio. However, regional data on capital depreciation are not available either. The only data at hand relate to regional gross investment. If this assumption of constant capital–output ratio were relaxed, so that k=γq, where k is the capital growth rate, then γ should be at least 2 for Verdoorn's law not to hold (Fingleton, Citation2001). In fact, in our case, we have b 1=(γα+β−1) or, rearranging, β=(γα−1)/(b 1−1). By assuming that α = 0.333 and b 1=0.5, Verdoorn's law holds for γ < 2 or, in other words, Verdoorn's law does not hold if the growth rate of capital is twice the output growth rate. This is a rather unlikely condition.
At this point, a difference between this approach and the class of neoclassical growth models should be made clear. In models à la Solow, assuming production technology is uniform across space, regional economies grow at the same rate of technological progress in the long run, while differences in the levels of per capita GDP are explained in terms of differences in depreciation rate of capital, saving rate, the initial level of technology and population growth.
The approach we decided to follow assumes that the growth rate of technical progress evolves according to spatial interactions due to regional spillover effects, technology diffusion and the level of human capital within the regions, that is:
After some algebra, Fingleton (Citation2001) proposes a different specification for Verdoorn's law to take into account the reduced form for λ*, that is:
The urbanization rate (u) is measured in terms of population density and is meant to proxy the density of economic activity in the spirit of Ciccone & Hall (Citation1996). These authors found that by estimating two models—one considering geographical externalities and the other the diversity of services to industry—for US counties, a great part of the variability of the productivity across states is explained by the variance in the density of economic activity. In (5) we assume that economic activity density can be approximated by population density. We thus expect the coefficient b 3 to be positive and significant.
Finally, l measures the geographical distance of a given region from Luxembourg, which is thought to be the central location of Europe. While the core–periphery pattern has often been documented in the case of the EU12 or 15, we want to test whether this pattern is still relevant for an EU enlarged to 25 members.
At this point the aforementioned difference with Solow's model should be clear: while in the model obtained by the simple estimation of (2) the growth rate of technology is completely exogenous, in our approach we assume it to be dependent on the labour productivity growth and on its spatial structure.
The first aspatial model we estimate takes the following form:
3 Data and the Spatial Weight Matrix
The data on manufacturing productivity, manufacturing output, the initial productivity level gap (which is used as a proxy for the initial technology gap) and density come from the most recent version of the Cambridge Econometrics database (2004). They cover the period 1991–2003. In 1991, Groningen was the region with the highest level of hourly productivity. Regional productivity ratios range between 0.26% for Latvia to 40.5% for Drenthe (the Netherlands). Data are in 1995 euro prices. Data expressed in euros (as opposed to data in purchasing power parity) allow us to consider differences in the capacity to produce goods. The peripherality measure is the distance from Luxembourg. However, we do not use the pure geographical distance but rather the transportation time by road from Luxembourg to the most populated city of each region. We believe that it is a better way to define peripherality. Information on the most populated town comes from www.citypopulation.de/Europe.html. Data on travel time come from the Michelin website (www.viamichelin.com). We adopt travel time instead of distance by road because the existence of islands in our sample forces us to include the time spent to load and unload trucks on boats. This information would not have been taken into account if we had considered the pure geographical distance or distance by road only. The difference between both definitions of peripherality is pretty big because of islands and the characteristics of the transportation network. Indeed, new transportation infrastructures improve accessibility among core regions relatively faster than among peripheral regions, because this is where the transport demand is the highest (Vickerman et al., Citation1999). In addition, with hub-and-spoke interconnections dominating the European highway system, accessibility to the hub from a spoke location may be greater than accessibility from any spoke location to another (Puga & Venables, Citation1997).
Our sample is composed of 244 regions at NUTS II level. NUTS (Nomenclature of Territorial Units for Statistics) is the spatial classification established by Eurostat on the basis of national administrative units. It is used by the Commission as a regional statistical concept. In addition to the regions of the EU15 members, we include those of Poland (16 regions), of the Czech Republic (eight regions) and of Hungary (seven regions), Estonia (one region), Lithuania (one region), Latvia (one region), Slovenia (one region), Slovakia (four regions), Cyprus (one region) and Malta (one region).Footnote7 To our knowledge, the present study is the first to assess growth at the regional level for the whole EU25.
The existence of islands does not allow us to consider simple contiguity matrices; otherwise, the weight matrix would include rows and columns with only zeros for these islands. Since unconnected observations are eliminated from the results of the global statistics, this would change the sample size and the interpretation of the statistical inference. As a result, the matrices are based on the great circle distribution of geographical distance. Each matrix is row standardized so that it is relative and not absolute distance which matters. They can be written as follows:
4 Cross-section Estimations
In the present section, we will proceed stepwise. First, the OLS version of the model without spatial effects is considered. Then we will move forward to considering the issues deriving from spatial autocorrelation. The new methodology developed for the identification of the clusters is presented in subsection 4.2. Finally, we will consider spatial heterogeneity into the model both in the form of spatial regimes and groupwise heteroskedasticity.
4.1 Spatial Autocorrelation
We start with the OLS estimation of model (6). Estimation results displayed in column 1 of show that all the variables have the expected sign. All the variables are significant. The coefficient of manufacturing output growth is 0.842, which corroborates the presence of increasing returns to scale. Density and peripherality are significant and have the expected signs, but their extent is very small. Looking at the diagnostic tests, the Jarque–Bera test rejects the assumption of normality of the residuals (p-value = 0.000). This is due to the presence of spatial effects which will be identified below. We note also that the White test clearly rejects homoskedasticity (p-value = 0.000) as well as the Koenker–Bassett test (p-value = 0.000).
Table 1 . Estimation results of models (6) by OLS and (7) by ML with spatial weight matrix W(D1)
We use Anselin (Citation1988) and Anselin et al. (Citation1996) tests to detect the presence of spatial effects. In order to identify the form of the spatial dependence (spatial error model or spatial lag), the Lagrange Multiplier tests (resp. LMERR and LMLAG) and their robust version are performed. The decision is subject to the Anselin & Florax (Citation1995) rule: if LMLAG (resp. LMERR) is more significant than LMERR (resp. LMLAG) and R-LMLAG (resp. R-LMERR) is significant whereas R-LMERR (resp. R-LMLAG) is not, then the most appropriate model is the spatial lag model (resp. the spatial error model).
Since R-LMERR is significant while R-LMLAG is not, we adopt a spatial error model. While the choice above relies on the spatial weight matrix W(D1) for which the cut-off distance is 508 miles, we tested the results with the other two weight matrices (the median and the upper quartile of the great circle distance distribution, for which the respective cut-offs are 844 and 1,249 miles). Both matrices confirm a spatial error specification.
The spatial error version of our model can be written as follows:
The second column in shows the estimation results of model (7) by ML (those results are confirmed by GMM-two steps). In this case, again, all the coefficients are significant. The presence of significant increasing returns to scale is confirmed in this specification too. The coefficient of the spatial error term is 0.530 and is highly significant, indicating the presence of positive spatial autocorrelation. The two tests against heteroskedasticity (the unadjusted and spatially adjusted Breusch–Pagan statistics) are significant (p-value = 0.000), indicating the presence of remaining heteroskedasticity. This issue is taken into account in the following section. The LR test on the spatial autoregressive coefficient is highly significant (p-value = 0.000) and the Wald test and LR test on the common factor hypothesis are not significant, indicating that the spatial error model is indeed the appropriate specification.
4.2 Determination of Regional Clusters
The significant results of the Breusch–Pagan tests (BP) against heteroskedasticity in may come from the presence of structural instability, groupwise heteroskedasticity or both. In order to define the regimes or convergence clubs (also called clusters) that are at the basis of heterogeneity in our sample, we propose first a short review of former contributions defining and treating spatial heterogeneity. Then we describe our methodology and apply it to the case under study.
Various methodologies have been developed in the literature to consider and detect convergence clubs. The reader interested in these issues can, for instance, refer to the contributions of Durlauf & Johnson (Citation1995), Berthelemy & Varoudakis (Citation1996), Desdoigts (Citation1999), Liu & Stengos (Citation1999), Feve & Le Pen (Citation2000), Hobijn & Franses (Citation2000) and Bloom et al. (Citation2003). In the case of the European regions, the methodologies that have been used are not unanimous either. Neven & Gouyette (Citation1995) choose to define convergence clubs arbitrarily. Corrado et al. (Citation2005) use a methodology that allows for endogenous selection of regional clusters using a multivariate test for stationarity, where the number and composition of clusters are determined by the application of pairwise tests of regional differences in per capita output over time. Canova (Citation2004) proposes a technique based on the predictive density of the data and conditional on the parameters of the model to jointly test for the number of convergence clubs and to estimate the parameters of each of them.
The reason why we do not follow any of the previous methodologies relates to their lack of consideration of spatial effects, as described in Section 2. Indeed, because of the important geographical component of the data upon which our analysis is based, we want the methodology we use for the detection of spatial heterogeneity (convergence clubs) to take spatial dependence into account. This is because former empirical evidence (see references in Section 1) clearly indicates the presence of spatial dependence in the growth dynamics of European regions.
The methodology that has been used so far to include spatial autocorrelation in the detection of spatial heterogeneity among EU regions relies on the tools of exploratory spatial data analysis (Le Gallo et al., Citation2003; Dall'erba, Citation2005). However, this approach is limited in the sense that it cannot determine more than two clubs. For our sample, the usual North–South polarization pattern that is relevant for the EU15 would be replaced by a North-west–East pattern because the new member states are included in the sample (see Ertur & Koch, Citation2005). This is mostly due to the significant decrease in the European mean per capita income (upon which most spatial analysis tools rely) because of the membership of the new entrants. Their per capita GDP is so low that the former poor countries of the EU15 (Spain, Portugal, Greece) now have a per capita GDP above the EU25 average.
The methodology we use here combines a spatial approach with an endogenous club detection based on Berthelemy & Varoudakis (Citation1996). In order to avoid the a priori exogenous choice of the number of clubs as in Durlauf & Johnson (Citation1995), Berthelemy & Varoudakis (Citation1996) perform successive F-tests on coefficients stability (Chow tests) on the entire sample by moving the sample break point forward by one observation each time. However, when the first club has been detected, they should repeat their process on the remaining sample to verify whether it is also composed of two sub-groups. In our opinion, the degree of homogeneity between the first and the third group remains to be analysed. This is what we propose in our methodology, successive steps of which are described as follows:
-
We sort the entire sample in increasing order according to the growth rate of manufacturing output, q, and change the rows and columns of the W matrix accordingly.
-
We estimate model (7) with spatial regimes (structural instability treated with dummy variables per regime in model 7) defined as follows: regime 1 comprises the five regions with the smallest q (in order to have a sufficient degree of freedom); regime 2 comprises the other regions.
-
We perform the F-test on stability (with the spatial Chow–Wald test—Anselin (Citation1995)) as well as the test on individual stability of the coefficients. We add one more region in regime 1 if the tests reveal stability between regimes (at the 10% significance level).
-
As soon as the Chow–Wald test and the test on individual stability reveal instability, the regime 1 regions are eliminated from the sample and steps (2)–(4) are repeated on the remaining sample. A new weight matrix is built in order to match the size of the remaining sample.
-
If multiple regimes are found (say regimes 1, 2 and 3), we need to test how the coefficients of regime 3 are similar to those of regime 1.
reports the results of the Chow–Wald test of overall stability and the tests on individual stability for different break points. We are aware that the process we describe here must be viewed with caution because the recursive properties of this test are unknown at finite distance. The right-hand column provides the description of the weight matrix which has been used for the calculation. All of them are based on the inverse of the great circle distance between centroids. For each sample, the cut-off that has been chosen corresponds to the first quartile of the great circle distribution for the sample under study. Since the sample changes after a regime has been found, the cut-off distance changes as well.Footnote9
Table 2 . P-values of the spatial Chow–Wald test and individual stability tests for different break points
The results of the Chow–Wald tests above indicate the presence of four regimes in our sample: regime 1 comprises 44 regions, regime 2 has 160 regions, regime 3 has 29 regions, and regime 4 has eight regions. However, as indicated in step (5) above, one needs to test how the coefficients of each regime are different from one another. The results of these tests are displayed in . All the spatial Chow–Wald results indicate that the regimes defined above are statistically different one from another. The weight matrices that have been used for the calculation correspond to the first quartile of the great circle distribution. Just as in , the cut-off distance changes with the sample under study.
Table 3 . Spatial Chow–Wald test results for the regimes defined in the text
The four regimes defined above are represented in . The regions with the lowest growth rate in manufacturing output are shown in a light tint. These include some Spanish and Greek regions, former East Germany and some other Eastern peripheral regions. The most productive regions (regime 3 and 4) are spread over the territory. We note that they often include the capital city of the country. Three new member countries belong to this category, namely Latvia, Lithuania and Estonia, as well as two Hungarian regions.
Figure 1. Distribution of the regions by regime.
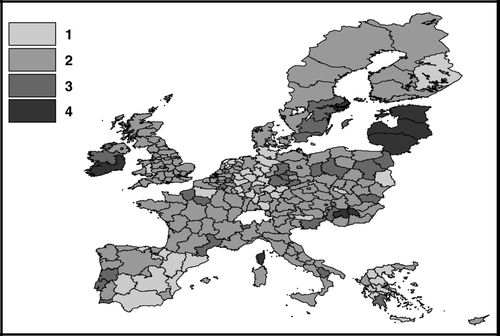
It is obvious from that the regions that belong to one particular regime are not always contiguous. This indicates that some regions may have similar dynamics even if they are not geographically clustered. In the methodology used above, space is controlled for in the determination of the clubs, but it is not the only factor at the origin of the clubs.
4.3 Convergence with Regional Clusters
Now that we have clearly defined the clubs that are present in our sample, we turn to a cross-section estimation of model (7) to which we add spatial heterogeneity. Indeed, the significance of the Breusch–Pagan and spatial Breusch–Pagan tests in clearly indicates the presence of spatial heterogeneity. This may take the form of spatial regime, groupwise heteroskedasticity or both. Let us start with the estimation of the presence of spatial regimes. The model we estimate can be written as follows:
Table 4 . Estimation results with spatial regimes (ML estimation) and the spatial weight matrix W(D1)
Significant coefficients are shown in bold. Immediately, it can be noticed that the coefficient for spatial error autocorrelation is still significant. Furthermore, regimes 1, 2 and 4 display the significant presence of increasing returns to scale. These are greater in group 4 than groups 2 and 1. It may explain why group 4 comprises the most productive regions: an increase in production results in a greater increase in productivity than in the other regions. The impact of peripherality and density measures is very small. We note that the sign of peripherality changes with the regime (negative for regime 1 and positive for regime 4). The Chow–Wald test and the individual stability tests indicate the relevance of using these for groups. However, the Breusch–Pagan and spatial Breusch–Pagan tests indicate that all the heterogeneity has not been taken into account. This is why we test also for the presence of groupwise heteroskedasticity.
4.4 Convergence with Regional Clusters and Groupwise Heteroskedasticity
This model can be written as follows:
The results in confirm those of the previous table: increasing returns are significantly present in groups 1, 2 and 4. This last group displays the greatest extent of increasing returns compared to other groups. Density and peripherality are significant for half of the groups. Peripherality is now positive for both groups 1 and 4. The spatial autocorrelation coefficient is still positive and significant, but its extent is much smaller than in previous specifications. GMM estimations do not display the LR test on groupwise heteroskedasticity, but all the coefficients of the variances are significant.
Table 5 . Estimation results with spatial regimes and groupwise heteroskedasticity (GMM estimation) with spatial weight matrix W(D1)
5 Discussion and Conclusions
This paper has shed some light on two important issues while estimating the European regional growth process. First, we decided to adopt a Verdoorn's law specification that includes the spatial dimension of the process and takes the presence of increasing returns explicitly into account. This has been missing in most of the previous empirical contributions since the neoclassical framework (beta-convergence) is still by far the most popular model used. Second, while the presence of heterogeneity in the European convergence process has been documented many times in the case of the EU12 or EU15, there is no doubt that the recent enlargement has brought even more disparity. In order to detect convergence clubs we use an endogenous methodology to which spatial effects are added. This is the first time this methodology has been proposed and applied. It allows us to reject previous methodologies that are considering only one aspect (space or endogenous detection), but not both.
Our results, based on a cross-sectional estimation, indicate that increasing returns are significant in determining the level of growth at the regional level. This is clear evidence that the neoclassical approach is not always relevant. It appears that three new member countries, namely Estonia, Lithuania and Latvia, as well as two Hungarian regions, belong to the club of regions where increasing returns are estimated to be the highest in the European territory. This last finding has some interesting implications for the development of these countries. Indeed, it means that investing there guarantees much higher returns than in any other place in Europe. In addition, because of the significant presence of spatial effects, future public investments could contribute to their neighbours also. Two other explanatory variables (density and peripherality) have proved to be significant in half of the groups, but their extent is very small. The technological gap is almost never significant.
The groups that we detected using the spatial endogenous methodology are significant in all our estimations. This methodology improves traditional methodologies based on exploratory spatial data analysis, which cannot split a sample in more than two groups, and traditional endogenous detection which does not consider spatial autocorrelation. We hope this methodology opens the way to many more empirical works willing to consider both aspects in the detection of data heterogeneity. Finally, our analysis relies so far on the manufacturing sector only, because we decided to stay as close as possible to the original Verdoorn's law. It would be interesting to measure externalities and the extent of increasing returns in the services sector since this is the main source of activity and employment in most Western European countries.
Acknowledgements
The authors would like to thank Bernard Fingleton, Paul Cheshire, Cem Ertur, Wilfried Koch, Jean Paelinck, Art Getis, Eckhardt Bode, Brigitte Waldorf, Julie Le Gallo and participants at conferences in Amsterdam (ERSA), Dijon (ASDRLF), Naples (AISRe), Santa Fe (WRSA) and Toronto (RSAI) for very useful comments on earlier drafts of the paper. The usual disclaimers apply. Percoco and Dall'erba gratefully acknowledge financial support from Bocconi University (Ricerca di base) and the European Commission (Marie Curie fellowship), respectively.
Notes
1. See, for instance, Ertur et al. (Citation2006), Dall'erba (Citation2005), Bivand & Brunstad (Citation2003) and Lopez-Bazo et al. (Citation1999).
2. With the 2007 enlargement to Bulgaria and Romania, the EU area has increased by 8%, the population by 6.5%, and GDP by only 2%, leading to a 4% decrease of the EU mean per capita GDP.
3. A natural framework for such analysis is given by the New Economic Geography (NEG) models as proposed by Krugman (Citation1991).
4. Kennedy & Thirlwall (Citation1973) put Verdoorn's law at the centre of the well-known model of cumulative causation growth which should be considered as the basis for successive models à la Krugman.
5. For a review of the different approaches to the estimation of Verdoorn's law see Leon-Ledesma (Citation2000).
6. By making use of estimates of the capital/output ratio at national level made available by Kamps (Citation2006) and considering countries in the EU12 over the period 1990–2001, we have estimated a panel equation in the form of: log(Capital/output ratio t ) = constant + βlog(Capital/output ratio t-1) + e. We have found that =0.973 at a 99% confidence level, and hence the capital/output ratio is constant over our time period. McCombie & Thirlwall (Citation1994) found similar results for developed countries.
7. We are aware that our empirical results could be affected by the choice of the spatial aggregation which influences the magnitude of various measures of association. This problem is referred to as the modifiable area unit problem (Openshaw & Taylor, Citation1979), and is also called the problem of ecological fallacy (Anselin & Cho, Citation2000). However, the choice of this disaggregation level is driven by the preference of the European Commission while assessing convergence in its official reports.
8. The robustness of the results is also tested by using other weight matrices based on the k-nearest neighbours, with k=5, 10, 15, 20 neighbours. The results are available from the authors upon request.
9. The results are consistent when the median and the upper quartile of the great circle distance distribution are used for each sample. Complete results are available from the authors upon request.
References
- Abramovitz , M. 1986 . Catching up, forging ahead, and falling behind . Journal of Economic History , 43 : 385 – 406 .
- Abreu , M. , de Groot , H. L. F. and Florax , R. J. G. M. 2005 . Space and growth: a survey of empirical evidence and methods . Région et Développement , 21 : 13 – 44 .
- Altomonte , C. and Resmini , L. 2002 . Multinational corporations as a catalyst for local industrial development: the case of Poland . SR—Italian Journal of Regional Science , 2 : 29 – 57 .
- Anselin , L. 1988 . Spatial Econometrics: Methods and Models , Dordrecht : Kluwer .
- Anselin , L. (1995) SpaceStat . A software program for the analysis of spatial data (version 1.8) .
- Anselin , L. , Bera , A. , Florax , R. J. G. M. and Yoon , M. 1996 . Simple diagnostic tests for spatial dependence . Regional Science and Urban Economics , 26 : 77 – 104 .
- Anselin , L. and Cho , W. K. T. 2000 . Spatial effects and ecological inference . Political Analysis , 10 : 276 – 297 .
- Anselin , L. and Florax , R. J. G. M. 1995 . “ Small sample properties of tests for spatial dependence in regression models ” . In New Directions in Spatial Econometrics , Edited by: Anselin , L. and Florax , R. J. G. M. 21 – 74 . Berlin : Springer .
- Bachtler , J. and Downes , R. 1999 . Regional policy in the transition countries: a comparative assessment . European Planning Studies , 7 : 793 – 808 .
- Baldwin , R. , François , J. and Porter , R. 1997 . EU-enlargement—small cost for the West, big gains for the East . Economic Policy , 12 : 125 – 176 .
- Baumol , W. J. 1986 . Productivity growth, convergence, and welfare: what the long-run data show . American Economic Review , 76 : 1072 – 1085 .
- Berthelemy , J. and Varoudakis , A. 1996 . Economic growth, convergence clubs, and the role of financial development . Oxford Economic Papers , 48 : 300 – 328 .
- Bivand , R. S. and Brunstad , R. J. 2003 . “ Regional growth in Western Europe: an empirical exploration of interactions with agriculture and agricultural policy ” . In European Regional Growth , Edited by: Fingleton , B. Berlin : Springer .
- Blomstrom , M. & Kokko , A. (1997) Regional Integration and Foreign Direct Investment , NBER Working Paper 6019, NBER, Cambridge, MA .
- Bloom , D. , Canning , D. and Sevilla , J. 2003 . Geography and poverty trap . Journal of Economic Growth , 8 : 355 – 378 .
- Boldrin , M. and Canova , F. 2003 . “ Regional policies and EU enlargement ” . In European Integration, Regional Policy, and Growth , Edited by: Funck , B. and Pizzati , L. Washington, DC : World Bank .
- Candelon , B. and Lütkepohl , H. 2001 . On the reliability of Chow-type tests for parameter constancy in multivariate dynamic models . Economics Letters , 73 : 155 – 160 .
- Canova , F. 2004 . Testing for convergence clubs in income per capita: a predictive density approach . International Economics Review , 45 ( 1 ) : 49 – 77 .
- Ciccone , A. and Hall , R. E. 1996 . Productivity and the density of economic activity . American Economic Review , 86 ( 1 ) : 54 – 70 .
- Corrado , L. , Martin , R. and Weeks , M. 2005 . Identifying and interpreting regional convergence clusters across Europe . The Economic Journal , 115 : C133 – C160 .
- Dall'erba , S. 2005 . Productivity convergence and spatial dependence among Spanish regions . Journal of Geographical Systems , 7 : 207 – 227 .
- Dall'erba , S. & Le Gallo , J. (2007) Regional convergence and the impact of structural funds over 1989–1999: a spatial econometric analysis , Papers in Regional Science (forthcoming) .
- Desdoigts , A. 1999 . Patterns of economic development and the formation of clubs . Journal of Economic Growth , 4 : 305 – 330 .
- Dixon , R. J. and Thirlwall , A. P. 1975 . A model of regional growth rate differences on Kaldorian lines . Oxford Economic Papers , 101 : 445 – 502 .
- Dollar , D. and Wolff , E. N. 1993 . Competitiveness, Convergence and International Specialization , Cambridge, MA : MIT Press .
- Doyle , E. and O'Leary , E. 1999 . The role of structural change in labour productivity convergence among European Union countries: 1970 to 1990 . Journal of Economic Studies , 26 : 106 – 120 .
- Durlauf , S. N. and Johnson , P. 1995 . Multiple regimes and cross-country growth behavior . Journal of Applied Econometrics , 10 : 365 – 384 .
- Durlauf , S. N. and Quah , D. 1999 . “ The new empirics of economic growth ” . In Handbook of Macroeconomics , Edited by: Taylor , J. and Woodford , M. Amsterdam : Elsevier Science .
- Ertur , C. and Koch , W. 2005 . Une analyse exploratoire des disparités régionales dans l'Europe élargie . Région et Développement , 21 : 65 – 92 .
- Ertur , C. , Le Gallo , J. and Baumont , C. 2006 . The European regional convergence process, 1980–1995: do spatial regimes and spatial dependence matter? . International Regional Science Review , 29 : 3 – 34 .
- European Commission (2003) Second Progress Report on Socio-economic Cohesion , Office for Official Publications , Luxemburg .
- European Commission (2004) Third Report on Socio-economic Cohesion , Luxemburg : Office for Official Publications .
- Feve , P. and Le Pen , Y. 2000 . On modelling convergence clubs . Applied Economics Letters , 7 : 311 – 314 .
- Fingleton , B. 2001 . Equilibrium and economic growth: spatial econometric models and simulations . Journal of Regional Science , 41 : 117 – 147 .
- Fingleton , B. and McCombie , J. S. L. 1998 . Increasing returns and economic growth: some evidence for manufacturing from the European Union regions . Oxford Economic Papers , 50 : 89 – 105 .
- Friedman , M. 1992 . Do old fallacies ever die? . Journal of Economic Literature , 30 : 2129 – 2132 .
- Fujita , M. , Krugman , P. and Venables , A. J. 1999 . The Spatial Economy , Cambridge : MIT Press .
- Gomulka , S. 1983 . Industrialization and the rate of growth: Eastern Europe 1955–75 . Journal of Post Keynesian Economics , 5 : 388 – 396 .
- Hobijn , B. and Franses , P. H. 2000 . Asymptotically perfect and relative convergence of productivity . Journal of Applied Econometrics , 15 : 59 – 81 .
- Kaldor , N. 1957 . A model of economic growth . Economic Journal , 67 : 591 – 624 .
- Kaldor , N. 1970 . The case for regional policies . Scottish Journal of Political Economy , 17 : 37 – 48 .
- Kamps , C. 2005 . New estimates of government net capital stocks in 22 OECD countries 1960–2001 . IMF Staff Papers , 53 ( 1 ) : 120 – 151 .
- Kelejian , H. H. and Prucha , I. R. 1999 . A generalized moments estimator for the autoregressive parameter in a spatial model . International Economic Review , 40 : 509 – 534 .
- Kennedy , C. and Thirlwall , A. P. 1973 . Technological change and the distribution of income: A belated comment . International Economic Review , 14 ( 3 ) : 780 – 784 .
- Krugman , P. 1991 . Increasing returns and economic geography . Journal of Political Economy , 99 ( 3 ) : 483 – 499 .
- Le Gallo , J. and Dall'erba , S. 2006 . Evaluating the temporal and spatial heterogeneity of the European convergence process, 1980–1999 . Journal of Regional Science , 46 ( 2 ) : 269 – 288 .
- Le Gallo , J. , Ertur , C. and Baumont , C. 2003 . “ A spatial econometric analysis of convergence across European regions, 1980–1995 ” . In European Regional Growth , Edited by: Fingleton , B. 99 – 129 . Berlin : Springer .
- Leon-Ledesma , M. 2000 . Economic growth and Verdoorn's law in the Spanish regions: 1962–1991 . International Review of Applied Economics , 14 ( 1 ) : 55 – 69 .
- Leon-Ledesma , M. 2002 . Accumulation, innovation and catching-up: an extended cumulative growth model . Cambridge Journal of Economics , 26 : 201 – 216 .
- Liu , Z. and Stengos , T. 1999 . Non-linearities in cross-country growth regressions: a semi-parametric approach . Journal of Applied Econometrics , 14 ( 5 ) : 527 – 538 .
- Lopez-Bazo , E. , Vayà , E. , Mora , A. J. and Suriñach , J. 1999 . Regional economic dynamics and convergence in the European Union . Annals of Regional Science , 33 : 343 – 370 .
- Markusen , J. and Venables , A. J. 1999 . Foreign direct investment as a catalyst for industrial development . European Economic Review , 43 : 335 – 356 .
- McCombie , J. S. and de Ridder , J. P. 1984 . The Verdoorn law controversy: some new empirical evidence using the US state data . Oxford Economic Papers , 36 : 268 – 284 .
- McCombie , J. S. and Thirlwall , A. P. 1994 . Economic Growth and the Balance of Payment Constraint , Basingstoke : Macmillan .
- Melachroinos , K. A. and Spence , N. 1999 . “ Capital and labour productivity convergence of manufacturing industry in the regions of Greece ” . In Spatial Dynamics of European Integration , Edited by: Fischer , M. M. and Nijkamp , P. Berlin : Springer .
- Neven , D. and Gouyette , C. 1995 . Regional convergence in the European Community . Journal of Common Market Studies , 33 : 47 – 65 .
- Openshaw , S. and Taylor , P. 1979 . “ A million or so correlation coefficient: three experiments on the modifiable areal unit problem ” . In Statistical Applications in the Spatial Sciences , Edited by: Wrigley , N. 127 – 144 . London : Pion .
- Petrakos , G. 1996 . The regional dimension of transition in Eastern and Central European countries: an assessment . Eastern European Economics , 34 : 5 – 38 .
- Pieper , U. 2003 . Sectoral regularities of productivity growth in developing countries—a Kaldorian interpretation . Cambridge Journal of Economics , 6 : 831 – 850 .
- Puga , D. and Venables , A. J. 1997 . Preferential trading arrangements and industrial location . Journal of International Economics , 43 : 347 – 368 .
- Quah , D. 1993 . Galton's fallacy and tests of the convergence hypothesis . Scandinavian Journal of Economics , 94 : 427 – 443 .
- Resmini , L. and Traistaru , I. 2003 . “ Spatial implications of economic integration in EU accession countries ” . In The Emerging Economic Geography in EU Accession Countries , Edited by: Traistaru , I. , Nijkamp , P. and Resmini , L. Burlington : VA, Ashgate .
- Rey , S. J. and Janikas , M. J. 2005 . Regional convergence, inequality, and space . Journal of Economic Geography , 5 : 155 – 176 .
- Sachs , J. 1997 . Geography and Economic Transition , Cambridge, MA : Mimeo, Center for International Development, Harvard University .
- Solow , R. 1956 . A contribution to the theory of economic growth . Quarterly Journal of Economics , 70 : 65 – 94 .
- Temple , J. 1999 . The new growth evidence . Journal of Economic Literature , 37 : 112 – 156 .
- Traistaru , I. & Wolff , G. B. (2002) Regional Specialization and Employment Dynamics in Transition Countries , ZEI Working Paper No. B18-2002, Center for European Integration Studies, Bonn
- Verdoorn , B. 1949 . Fattori che regolano la produttività del lavoro, l . Industria , 1 : 3 – 10 .
- Vickerman , R. , Spiekermann , K. and Wegener , M. 1999 . Accessibility and economic development in Europe . Regional Studies , 33 : 1 – 15 .