
 ?Mathematical formulae have been encoded as MathML and are displayed in this HTML version using MathJax in order to improve their display. Uncheck the box to turn MathJax off. This feature requires Javascript. Click on a formula to zoom.
ABSTRACT
Recent empirical findings highlight how economic geography is important in understanding various political outcomes. However, these results are typically based on single elections or referendums. This article overcomes the weaknesses of such data by identifying and analysing the long-term structure and evolution of fundamental political ideologies in Switzerland. The results assess the existence of significant political ideology divides among Swiss municipalities and indicate that these divides are associated with inequalities in local economic welfare, migration flows and urbanity. Overall, this article suggests that linkages between economic geography and political preferences are not restricted to specific issues or elections; rather, they also involve the more profound structure of political ideologies.
INTRODUCTION
Recent political outcomes, such as the UK Brexit vote and the US presidential election in 2016 (among others), have revealed clear geographical patterns highlighting how regions characterized by similar local economic conditions tended to exhibit similar voting behaviour and voting preferences (Hooghe & Marks, Citation2018; Jennings & Stoker, Citation2016; Lee et al., Citation2018; Los et al., Citation2017; McCann, Citation2018; Rodríguez-Pose, Citation2018). This has led to the term the ‘geography of discontent’ (McCann, Citation2020), referring to the spatial distribution of discontent in relation to the current political and economic system, which reflects inequalities between regions in terms of economic welfare (Los et al., Citation2017; McCann, Citation2018; Rodríguez-Pose, Citation2018).
Most studies analysing the geography of discontent are based on single elections or referendums and are mainly investigating recent events. However, as highlighted by Abrams and Fiorina (Citation2012), data based on elections are weak because they are the result of short-term, candidate- and party-related factors. Moreover, it is difficult to capture the complexity of the distribution of political ideologies with a single manifestation of personal political preferences. Consequently, the findings based on such data may only partially and indirectly relate to the dynamics of the underlying political ideologies.
The aim of this article is to overcome these limitations by investigating the long-term distribution and evolution of political ideologies in the context of Switzerland. Switzerland represents a very interesting case because it has strong institutions, it is a federal republic with highly decentralized political power and it practices a semi-direct democracy in which Swiss citizens directly vote on various issues.Footnote1 Therefore, by considering the rich data set on Swiss referendums, this article overcomes the above-mentioned weaknesses of election data and determines the underlying spectrum of political preferences of voters.
More specifically, this article contributes to the existing literature on this topic in three main ways. First, by exploiting the richness of the Swiss referendum data, it is able to identify the geographical distribution of the underlying long-term structure of political ideologies. The goal is to highlight how the linkages between the place of residence and political behaviours are not restricted to specific elections or single referendums. Rather, they are involving the fundamental structure of political ideologies. By analysing the results of 312 federal referendums between 1981 and 2017 at the municipal level, this article identifies three dimensions representing the Swiss political ideology space and expressing the following political beliefs: left versus right, conservative–nationalist versus liberal–globalist, and ecological versus technocratic. On each of these three dimensions, this contribution empirically assesses the existence of specific spatial concentrations of Swiss municipalities with similar political ideologies. This implies that the geographical distribution of political ideologies in Switzerland is characterized by significant political divides among groups of neighbouring municipalities sharing similar political preferences.
Second, the findings of this study contribute to the literature highlighting the existence of important political divergences between urban and rural places (Lee et al., Citation2018; MacLeod & Jones, Citation2018; Scala & Johnson, Citation2017). More specifically, the results indicate that the Swiss political ideology space is experiencing a phenomenon of increasing multidimensional polarization. These growing spatial divides on the political attitude dimension have important implications for place-sensitive policies addressing various types of spatial inequalities and aiming at building spatial and social cohesion (Barca et al., Citation2012).
Third, this article presents an empirical analysis of the factors potentially explaining the political ideology differences among Swiss municipalities. This also provides some exploratory insights into which factors might be associated to the phenomenon of increasing political polarization. The results clearly indicate that political divides among Swiss municipalities are associated with inequalities along various economic geography dimensions, such as local economic welfare, migration flows and urbanity, even after controlling for local sociodemographic characteristics, such as age and education. Building on these results, future research is needed to better understand the mechanisms behind these political divides and polarization. Yet, these findings show that socioeconomic divides are associated with political divides, and these spatial inequalities generate challenges in creating social and spatial cohesion, especially at the national level (Wilkinson, Citation2018).
The remainder of the paper is structured as follows. The next section reviews the related literature. The third and fourth sections describe the methodology and the database adopted for this research, respectively. The fifth section presents and discusses the results. The last section highlights the conclusions drawn from the analysis.
LITERATURE REVIEW
Following the recent switch in political support away from neoliberalism and globalization in many countries, there has been increasing attention from scholars, among others, on the topic of the geography of discontent. The underlying idea is that the spatial distribution of discontent within a country, reflecting the geographical distribution of interregional inequalities in terms of local economic characteristics, is an important driver in explaining how people vote (Hooghe & Marks, Citation2018; Jennings & Stoker, Citation2016; Lee et al., Citation2018; Los et al., Citation2017; MacLeod & Jones, Citation2018; McCann, Citation2018; Rodríguez-Pose, Citation2018; Scala & Johnson, Citation2017). In particular, these studies investigate the economic geography patterns of the political divides characterizing the results of recent elections and referendums in many different countries (e.g., the 2016 UK Brexit referendum, the US presidential election in 2016, or the growing support to parties opposed to the European integration at the 2017 Dutch, French and German elections, as well as at the 2018 Italian general election, and the 2019 European and Austrian elections).
The results indicate that regions characterized by similar local economic conditions, such as higher levels of unemployment, long-term declining industrial sectors, large shares of lower skilled employment, significant outward migrations or lower levels of productivity, tended to exhibit similar voting behaviour (Hooghe & Marks, Citation2018; Lee et al., Citation2018; Los et al., Citation2017; McCann, Citation2018; Rodríguez-Pose, Citation2018). According to Rodríguez-Pose (Citation2018), these are the places feeling left behind and being afraid of having no opportunities, and the people living in these regions have reacted using the ballot box as a ‘mean of protest’, typically voting against the status quo. This is in line with the political science literature that identifies the individual factors affecting the personal likelihood and motivation to vote. Besides the social, demographic and psychological ones (such as education, income, age, ethnicity, extraversion and emotional stability), they also include low levels of individual trust in institution as additional factors motivating people to take action and vote (for a review, see Harder & Krosnick, Citation2008). This is further supported by MacLeod and Jones (Citation2018), who show how the UK Brexit vote in 2016 can be seen as a ‘revolt’ of the people living in regions characterized by deep-rooted political dissatisfaction, generated by decades of social injustice and economic abandonment. Moreover, Hooghe and Marks (Citation2018) indicate that these left-behind regions represent a fertile soil for the re-emergence of strong territorial identities. Indeed, the authors argue that in these places there has recently been an outstanding increase in the support for populist parties, which are opposing transnationalism and the political and economic elites.
At the same time, people in more prosperous regions, who felt to have benefited from globalization, immigration or international trade, also tended to reveal similar voting patterns, usually supporting the current political and economic systems (Los et al., Citation2017; McCann, Citation2018). Hence, besides important individual socioeconomic characteristics driving voting behaviour, such as age, level of education or income (Lee et al., Citation2018; McCann, Citation2018; Meltzer & Richard, Citation1981; Scala & Johnson, Citation2017), there is growing evidence that economic geography is a powerful lens in explaining how people vote.
Consequently, there are strong regional and spatial patterns related to the geography of discontent. In particular, one of the most important spatial divides, in terms of political attitude, is the divergence between urban and rural areas (McCann, Citation2020; Tyler et al., Citation2017). Indeed, Jennings and Stoker (Citation2016) highlight the existence of a clear bifurcation in political behaviour between rural areas – typically facing economic decline – and urban places – generally characterized by various economic opportunities. Moreover, Scala and Johnson (Citation2017), analysing the US presidential elections in 2016, show how this political divergence between rural and urban places should not be considered in binary terms rather as a continuum from the most rural to the most urban areas.
The geographical polarization of political preferences, however, is not a new phenomenon. In fact, cleavage theory, originating in Lipset and Rokkan (Citation1967), underlines how already the Industrial Revolution generated a stark urban–rural cleavage. Nevertheless, the acceleration of the processes of globalization, which started in the early 1990s, combined with the beginning of the Digital Age (Castells, Citation1996), contributed to the rise of new political divides (Kriesi, Citation2010). The literature on the geography of discontent specifically focuses on the spatial distribution of these new political divergences and their relationships with economic geography and spatial inequalities.
This article contributes to the literature on the geography of discontent by analysing the long-term distribution and evolution of political ideologies in Switzerland, overcoming the weaknesses of the data typically used in this literature. By exploiting referendum data covering a period of almost four decades, this study identifies and analyses the long-term structure of political ideologies, which is independent of short-term, candidate- and party-related factors. More specifically, its aim is to highlight how the linkages between the place of residence and political behaviours are not restricted to specific elections or single referendums; rather, they involve the fundamental structure of political ideologies. Moreover, building on the existing literature, this study investigates through an empirical analysis whether such political ideology divides are associated with socioeconomic inequalities.
The literature on the geography of discontent and this study are related to the literature analysing spatial inequalities, investigating how spatial inequality is related to economic, social and political (in)stability (Ballas et al., Citation2017; Galbraith, Citation2012). The literature on spatial inequality, which finds its origins in Harvey’s (Citation1973) work on social justice and the city, highlights the existence of a spatial equilibrium of people’s locations, which is inherently unequal (Baum-Snow & Pavan, Citation2013). As a result, there is an unequal distribution of productive capital, implying that productivity and wages are also spatially unequal. Moreover, spatial differences in sociodemographic characteristics, such as gender, ethnicity and immigration, also help explain spatial wage inequalities (McCall, Citation1998). Given that wages are a labour market equilibrium-restoring process (Harris & Todaro, Citation1970), this uneven spatial distribution of wages creates incentives for people to move out of regions where there are no opportunities, leaving behind people with even fewer opportunities and creating a vicious circle reinforcing spatial inequality.
This article also relates to the literature on spatial sorting, referring to the redistribution of population groups into different neighbourhoods (Kawachi & Berkman, Citation2003). Following the economic literature (Fujita, Citation1989), already in the classic framework of the bid-rent theory (Alonso, Citation1964), the price for real estate, changing with the distance from the city centre, shapes the residential choices of various income groups within a society, generating income sorting. Another body of literature in economics links sorting processes to social interactions (Schelling, Citation1971), where residential decisions are driven by individual preferences for the neighbourhood composition. People prefer to live in places where other people are similar to themselves (McPherson et al., Citation2001). The idea that people with similar preferences cluster in municipalities is the focus of another important stream of literature in economics, which goes back to Tiebout (Citation1956), where people sort themselves according to their preferences to achieve an efficient provision of local public goods. This model has then been extended to analyse the important role of differences in income in explaining sorting processes (Ellickson, Citation1971).
In the political science literature, there has been a growing interest in the phenomenon of partisan sorting and there is currently a debate about whether individuals are nowadays more sorted according to their political preferences. Various studies find that in the last decades there has been an increase in the geographical polarization of voters (Bishop, Citation2008; Kim et al., Citation2003; Kinsella et al., Citation2015). Bishop (Citation2008) argues that a potential drawback of this sorting process is that homogeneous communities might encourage extremism by ignoring differing opinions. In contrast with these results, other authors find that voters are nowadays no more geographically sorted than in the past and relativize its importance (Abrams & Fiorina, Citation2012; Glaeser & Ward, Citation2006).
As in the case of analyses on the geography of discontent, most studies analysing the phenomenon of partisan sorting and polarization are based on presidential elections, presenting the same limitations mentioned above and highlighting once more the importance of investigating these issues with much stronger data, a gap that this contribution aims to fill.
METHODOLOGY
The analysis presented in this study is composed of three phases. In the first step, the political ideologies of each municipality in Switzerland were identified. Second, a spatial cluster analysis was performed in order to determine whether and where there are significant geographical concentrations of political ideologies. Finally, the third step empirically examined which factors could potentially be more important in explaining the political ideology differences among Swiss municipalities.
To establish the political ideology of each municipality, this study followed Hermann and Leuthold (Citation2003) by considering the federal referendums collected at the municipal level in Switzerland and performing an exploratory factor analysis on them. The underlying idea is that the referendums are the observed outcome of fewer independent and unobserved dimensions characterizing the political ideology space. The outcomes of referendums on similar topics are likely to be highly correlated because they are driven by the same underlying political preference. To maximize the explained variance, the exploratory factor analysis was performed with VARIMAX-rotation.
The results of the factor analysis allowed for extracting the statistical relationship among the referendums to determine the underlying unobserved factors. However, as highlighted by Hermann and Leuthold (Citation2003), to meaningfully identify the related ideological content, a qualitative interpretation of the specific political objects is needed. The combination of the factor analysis with a qualitative inspection of the political objects constructing the resulting factors allowed finding the dimensions representing the Swiss political ideology space.
In the second step, to measure the degree of geographical concentration of the political ideology, a spatial cluster analysis was performed. Following Kim et al. (Citation2003) and Kinsella et al. (Citation2015), this study computed the vector of local Moran’s I statistic (Anselin, Citation1995; Moran, Citation1948) for each factor identified in the previous phase. The local Moran’s I statistic associates a vector of observed values of a specific variable with a weighted average of the neighbouring values and compares the real distribution with random spatial distributions to capture significant spatial patterns. Hence, this analysis determined if and where there are significant geographical concentrations of the different typologies of political ideologies identified in the previous step.
Finally, the analysis empirically investigated which factors might potentially explain the political ideology differences among Swiss municipalities. To do so, the analysis built on the findings emerging from the previous step (i.e., the existence of spatial clustering of political ideologies) and incorporated spatial linkages among observations through the application of spatial econometric techniques.Footnote2 In particular, the following spatial Durbin panel data model was estimated:Footnote3
where
is the political ideology score of municipality
at time
along the
-th dimension, which has been identified in the first step of this analysis;
is a set of sociodemographic and socioeconomic characteristics of municipality
at time
;
is the inverse of the distance between municipality
and municipality
, such that
captures the spatial interactions of the dependent variables among neighbouring municipalities, while
captures the spatial interactions among neighbouring municipalities along the set of sociodemographic and socioeconomic characteristics,
. Finally,
is a variable capturing municipal fixed effects;
is a variable capturing time fixed effects; and
is the error term.
To solve the endogeneity issue introduced by the inclusion of the spatial lag of the dependent variable, the model was estimated by maximum likelihood by also applying the Lee and Yu (Citation2010) correction for the potential bias caused by the inclusion of fixed effects. Additionally, given the existence of spatial interactions among the observations, the estimates of the model could not be directly interpreted as marginal effects. Rather, direct and indirect effects needed to be computed in order to distinguish and properly account for the effects of the feedback loops among neighbouring municipalities (Elhorst, Citation2014; LeSage & Pace, Citation2009). More specifically, the direct effect captures the expected average change in the political ideology of a particular commune arising from an increase of one unit for a particular explanatory variable in the same municipality. Conversely, the indirect effects show the changes in the political ideology of a specific municipality due to a one unit increase in an independent variable in another commune. The sum of the direct and indirect effects indicates the total effect in all municipalities arising from a unit increase in an explanatory variable in one commune. To facilitate the comparison among the different estimates, all independent variables were standardized before estimating the model. Finally, this methodology does not aim to make any claims related to the causal mechanisms underlying the relationships between political ideologies and economic geography. Rather, it represents the most direct method of identifying whether any such linkages exist.
DATA
This research analysed the results at the municipal level concerning all the 312 federal referendums between 1981 and 2017. This information was obtained from the Swiss Federal Statistical Office (FSO). In particular, the factor analysis was computed on the yes-share of these 312 federal referendums.Footnote4 To compare and combine the data in terms of geopolitical unit, all the referendums are based on the 2017 municipal definition of the FSO, which includes 2240 municipalities.
To capture changes in the political ideology of each municipality through time, the factor analysis was computed on different time-subsamples of the data set. In particular, the first subsample considered all the 65 referendums between 1981 and 1990; the second subsample considered all the 106 referendums between 1991 and 2000; the third contained all the 82 referendums between 2001 and 2010; and the fourth subsample considered all the 59 referendums between 2011 and 2017. As the results show, given that the Swiss population periodically votes on the same topics, the factor analyses computed over different time-subsamples generated factors that are built in a very similar way, allowing for a comparison of the results from different periods.
The spatial analysis of this study considered a spatial weight matrix based on the inverse travel time between the centroids of the municipalities, to account for the extremely uneven topographical context of Switzerland. Travel-time data were provided by the Swiss Federal Office for Spatial Development and consider the trip by car in minutes. To keep the spatial analysis at a local level, after examining the distribution of distances between Swiss municipalities, a cut-off was imposed at a distance of 20 min travel time. Moreover, following the spatial econometric literature (Anselin, Citation1988; LeSage & Pace, Citation2009), the matrix was standardized such that each row sums to unity.
In the final part of this research, the analysis considered as dependent variable the political ideology score of each municipality along each dimension resulting from the factor analysis. Additionally, following the existing literature, the regression considered a wide range of sociodemographic and socioeconomic variables at the municipal level as explanatory variables, to verify which local characteristics might potentially explain the political ideology differences among Swiss municipalities.
Following the literature on the geography of discontent, which links political attitudes with local economic conditions (Hooghe & Marks, Citation2018; Lee et al., Citation2018; Los et al., Citation2017; McCann, Citation2018; Rodríguez-Pose, Citation2018), this research considered at the municipal level the median income and changes in median income, computed as the percentage change in median income between the previous and current period for each municipality.
Moreover, the existing literature highlights how migration represents one of the main factors promoting the geography of discontent (Dijkstra et al., Citation2019; Goodwin & Heath, Citation2016; Lee et al., Citation2018). Hence, the analysis also considered a variable capturing the intensity of migration flows in each municipality, computed as the percentage of net migration flows on overall local population, as well as the percentage of foreigners living in each municipality.
To capture the urban–rural divide in terms of political ideologies (as in Jennings & Stoker, Citation2016; Kriesi, Citation2010; Lipset & Rokkan, Citation1967; Scala & Johnson, Citation2017; Tyler et al., Citation2017), the analysis also considered the natural log of population for each municipality and a dummy variable for the cities.Footnote5
Following the literature highlighting how political attitudes are stratified by age groups (Goodwin & Heath, Citation2016; Harris & Charlton, Citation2016), the analysis included the age composition of each municipality, computed as the percentage of inhabitants of each commune aged 65 or more.
Moreover, the study also included a variable capturing local political engagement (Kriesi, Citation2010), measured as the municipal level average voter turnout of all the referendums voted in each decade.Footnote6
Finally, following the literature underlying how political preferences are stratified by levels of education (Becker et al., Citation2017; Dijkstra et al., Citation2019), this study also included the local level of education, measured as the percentage of inhabitants with university or equivalent education (i.e., third level education).
All these variables were obtained from the FSO and the spatial lag of all these explanatory variables was computed using the same spatial weight matrix used in the previous step. To mitigate potential issues of reverse causality, the reference year for each independent variable was the first year of each considered period. Data on education at the municipal level were not available in the last period. Given the importance of this variable in explaining political behaviour, the results show a set of estimates excluding the last period but considering the variable on education.Footnote7
reports the descriptive statistics related to the socioeconomic and sociodemographic characteristics at the municipal level which have been used in the analysis.
Table 1. Descriptive statistics.
RESULTS AND DISCUSSION
This section first presents the results of the exploratory factor analysis and describes the identified dimensions of the political ideology space. Subsequently, the results of the spatial cluster analysis are shown. Finally, the discussion ends focusing on the results of the empirical analysis examining which factors could potentially be more important in explaining the political ideology differences among Swiss municipalities.
Factor analysis
To identify the Swiss political ideology structure, this study performed a factor analysisFootnote8 for each period identifying three unobserved factors characterizing it.Footnote9 These three factors capture around 60% of the overall variance of the referendums, depending on the period considered. Hence, most political ideologies in Switzerland can be represented by three main dimensions. To give a meaningful interpretation to the resulting factors, the analysis considered the ideological content of the referendums building them.Footnote10
Considering the most important referendums building factor 1 in the period 1981–90, factor 3 in the period 1991–2000, factor 2 in the decade 2001–10, and factor 1 in the period 2011–17, it emerged that they represent the ‘left–right’ dimension of the political ideology space (as in Hermann & Leuthold, Citation2003). In particular, these factors capture the debate between those who are in favour of the welfare state, the protection of the workforce, personal freedom and pacifism, on one hand (i.e., with a left-wing perspective), and, on the other, those that have more propriety-oriented values, support military strength and entrepreneurial freedom (i.e., with a right-wing perspective).
Analysing the main referendums contributing to the construction of factor 3 in the decade 1981–90, factor 1 in the period 1991–2000, factor 1 in the decade 2001–10, and factor 2 in the period 2011–17, it appeared that they express the ‘conservative/nationalist–liberal/globalist’ dimension of the political ideology space (as in Hermann & Leuthold, Citation2003). In particular, this dimension represents the debate between those who support the opening of the country, are in favour of liberal economic policies and the modernization of institutions (i.e., with a liberal–globalist attitude), and those who are more sceptical towards changes and the opening of the country, prefer to preserve the existing regulations and mistrust the political and economic elites (i.e., with a conservative–nationalist attitude).
Finally, the third dimension of the Swiss political ideology space is captured by factor 2 in the decades 1981–90 and 1991–2000, and by factor 3 in the periods 2001–10 and 2011–17, which represent the ‘ecological–technocratic’ dimension of the political ideology space (as in Hermann & Leuthold, Citation2003). More specifically, this dimension expresses the debate between those who support the protection of the natural environment and are in favour of policies reducing the negative impact of human activities on nature (i.e., with an ecological attitude) and those who believe that the natural environment should be transformed to create more security and comfort, and used to generate technological progress (i.e., with a technocratic attitude).
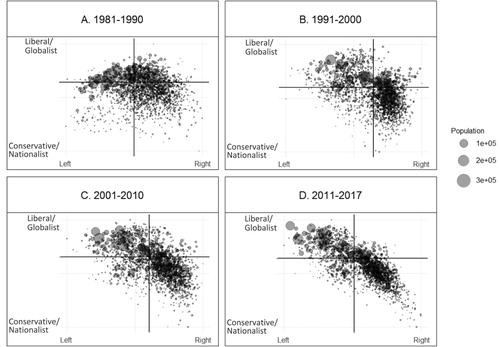
These results show that the Swiss political ideology can be represented in a three-dimensional space, where the three independent axes express the following political debates: left versus right, conservative–nationalist versus liberal–globalist, and ecological versus technocratic. shows the political ideology position of Swiss municipalities on two of these three dimensions, for each considered period. In particular, the horizontal axis expresses the ‘left–right’ dimension while the vertical axis maps the position of each municipality on the ‘conservative/nationalist–liberal/globalist’ dimension.Footnote11 Each point represents a municipality, and the size indicates the municipal dimension in terms of inhabitants. The solid black lines show the overall national position on these two dimensions. This graphical representation allows the following remarks to be made. First, in the first two decades, the positions of Swiss municipalities are spread on all four quadrants; however, in the last two periods, the political ideology positions of Swiss municipalities are mainly concentrated in the ‘left–liberal/globalist’ and ‘right–conservative/nationalist’ quadrants. Hence, this first graphical representation highlights a phenomenon of increasing polarization that is characterizing the Swiss political ideology space. Second, by simultaneously taking into consideration both these dimensions and the size of each municipality, in terms of the number of inhabitants, it emerges that the position on the political ideology space is also a manifestation of the rural–urban divide. In fact, cities and bigger municipalities are mainly positioned in the ‘left–liberal/globalist’ quadrant while smaller and rural communes are mainly found in the ‘right–conservative/nationalist’ quadrant.
Figure 1. Political ideology position of Swiss municipalities over time.
The identification of the political ideology of Swiss municipalities allowed for the continuation of the analysis with spatial cluster methods to empirically assess the degree of geographical concentration of political ideologies.
Spatial cluster analysis (local Moran’s I)
In the second phase of this analysis local Moran’s I statistics for each of the three dimensions determined above were computed and then plotted in order to visualize the spatial pattern of significant concentration of political ideologies.
plots the results for the ‘left–right’ dimension for the four different periods. Municipalities exhibiting significant spatial clustering of the right-wing political ideology are shown in dark grey, while those belonging to a significant geographical concentration of the left-wing political ideology are coloured light grey. This graphical visualization clearly illustrates that the ‘left–right’ dimension is characterized by geographical concentrations of municipalities with similar political preferences. More specifically, right-wing municipalities are predominantly clustered in the rural areas of the German-speaking part of Switzerland, that is, the centre and north-east parts.
Figure 2. Local Moran’s I statistics for the Left–Right dimension over time.
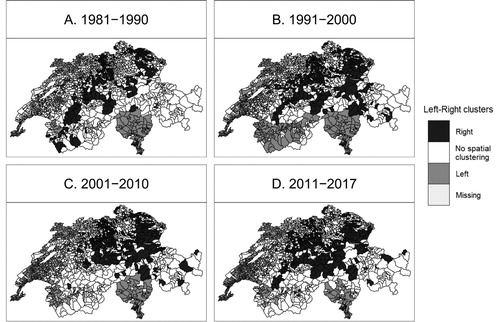
Additionally, left-wing municipalities are mainly concentrated in the Italian- and French-speaking parts of Switzerland, that is, in the south and west parts, respectively. The results also show that, over time, there have been only minor changes.
The results concerning the ‘conservative/nationalist–liberal/globalist’ dimension are shown in . Municipalities marked in dark grey belong to significant geographical concentrations of communes with a liberal–globalist political preference, while those coloured light grey are exhibiting significant spatial clustering of the conservative–nationalist political ideology. Geographical concentrations of political ideologies emerge also on the ‘conservative/nationalist–liberal/globalist’ dimension. More specifically, liberal–globalist municipalities are mainly clustered around the Swiss central–western cities and in the French-speaking area of Switzerland. Conversely, the conservative–nationalist municipalities are mainly concentrated in the rural areas of the German- and Italian-speaking parts of Switzerland, that is, in the east and south-east, respectively.
Figure 3. Local Moran’s I statistics for the Conservative/Nationalist–Liberal/Globalist dimension over time.
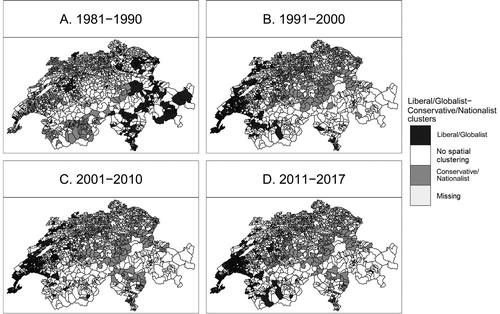
Considering the temporal evolution of the geographical concentrations of political ideologies along the ‘conservative/nationalist–liberal/globalist’ dimension, it clearly emerges that the first decade shows different patterns than the other three periods. As highlighted by Hermann and Leuthold (Citation2003), this can be explained by the fact that the debate between liberals–globalists and conservatives–nationalists in Switzerland became significantly important at the beginning of the 1990s when the discussion concerning the relationship between Switzerland and Europe started.
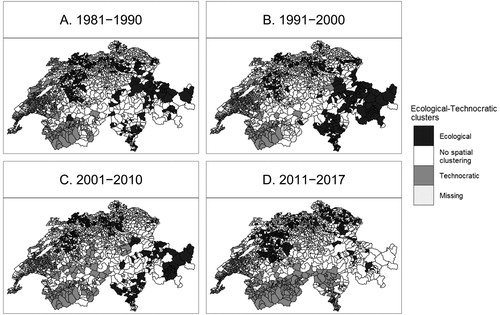
Finally, maps the results for the ‘ecological–technocratic’ dimension. Municipalities belonging to a significant geographical concentration of the ecological political ideology are coloured dark grey, while communes exhibiting significant spatial clustering of the technocratic political ideology are in light grey. Again, the results show that there are geographical concentrations of municipalities with similar political preferences. Ecological municipalities are mainly concentrated close to the big cities of the German-speaking part of Switzerland (i.e., in the centre and north-east parts) and in the rural areas in the east and south-east. On the contrary, technocratic communes are predominantly clustered in the rural areas of the French-speaking part of Switzerland (i.e., in the west). The temporal perspective allows for the determination that the geographical concentrations of ecological municipalities have decreased, in particular in the rural areas in the east and south-east parts of Switzerland. Moreover, the spatial concentrations of technocratic municipalities have increased in the south but have diminished in the north-west.
Figure 4. Local Moran’s I statistics for the Ecological–Technocratic dimension over time.
Overall, the results of the spatial cluster analysis highlight the existence of significant geographical concentrations of municipalities with similar political preferences.
Regression analysis
Following the literature on the geography of discontent, the final phase of this analysis empirically investigates whether the political divides identified above are associated with socioeconomic divides. presents the results of this empirical analysis, which was carried out for each dimension of the Swiss political ideology space, separately. Column 1 reports the results of the analysis on the ‘left–right’ dimension, where higher values are associated with a more right-wing ideology. Column 2 shows the outputs related to the ‘conservative/nationalist–liberal/globalist’ dimension, with higher values indicating a more liberal–globalist attitude. Finally, column 3 presents the estimates for the ‘ecological–technocratic’ dimension, where higher values are associated with a more technocratic ideology.
Table 2. Estimate results of the spatial Durbin model on each political ideology dimension.
The first row in confirms the findings of the previous section, highlighting the existence of positive and significant spatial interdependence effects along each political ideology dimension. The last rows report the likelihood ratio (LR) tests on the null hypotheses that the spatial Durbin model could be simplified into a spatial lag model or a spatial error model. In both cases the hypotheses are rejected, further supporting the current specification of the model. As already mentioned, because of the presence of spatial interactions among the observations, the estimates reported in cannot be directly interpreted as marginal effects. Rather, departing from these estimates, direct and indirect effects have been computed and presented in . In particular, the first three columns in report the direct, indirect and total effects on the ‘left–right’ dimension, the second three columns show the direct, indirect and total effects on the ‘conservative/nationalist–liberal/globalist’ dimension, while the last three columns present the direct, indirect and total effects along the ‘ecological–technocratic’ dimension.
Table 3. Direct and indirect effects estimates based on the coefficients estimates of the spatial Durbin models reported in .
The results confirm that there are strong and statistically significant differences in local political ideologies among municipalities with different socioeconomic characteristics (Hooghe & Marks, Citation2018; Lee et al., Citation2018; Los et al., Citation2017; McCann, Citation2018; Rodríguez-Pose, Citation2018). Indeed, along each dimension identified above, the results highlight how municipalities with different levels of median income are characterized by significant differences in political ideologies. In particular, significantly more right-wing, liberal–globalist and technocratic attitudes are found in municipalities with higher levels of median income (the first column of each model in ).Footnote12 Moreover, spatial interactions strengthen even further these relationships for the ‘left–right’ and ‘conservative/nationalist–liberal/globalist’ dimensions (second column of each model in ).
Following the literature on the geography of discontent, the analysis also considers the evolution of median income, in addition to its level. The findings indicate that, along each political ideology dimension, there are stark and significant differences in local political ideologies among municipalities with different variation of median income. In particular, municipalities with positive variation in median income in the previous decade are associated with more left-wing, conservative–nationalist and ecological attitudes (the first column of each model in ). These findings, in line with previous studies (Rodríguez-Pose, Citation2018), indicate that income inequalities and their evolution are associated with specific political ideologies, suggesting that local economic conditions and their development might be strongly related to political behaviour, and, therefore, economic geography may represent a powerful lens to understand political divides and polarization.
The findings also indicate that there are strong and significant differences in local political ideologies among municipalities with different shares of foreigners and different intensity of migration flows (as in Dijkstra et al., Citation2019; Goodwin & Heath, Citation2016; Lee et al., Citation2018). In particular, municipalities with a higher presence of foreigners already living in the area are associated with more liberal–globalist attitudes. However, communes where migration flows have been more intense, as a percentage of the total number of inhabitants, are characterized by political ideologies which are significantly more left-wing, conservative–nationalist and ecological (the first column of each model in ). Moreover, the dynamics between the presence of foreigners, migration inflows and political ideologies seem to extend beyond municipal borders when the ‘conservative/nationalist–liberal/globalist’ dimension is considered (the second column of model 2 in ). These findings seem to indicate that the extent to which the local population is used to the presence of foreigners is differently associated with local political ideologies. More specifically, municipalities with a relatively low presence of foreigners but with relatively large shares of incoming migrants are associated with more conservative–nationalist attitudes, while communes with a large presence of foreigners and relatively few incoming migrants are associated with more liberal–globalist ideologies. These results seem to confirm previous studies indicating that immigration is increasingly seen as economic and cultural threats (Goodwin & Heath, Citation2016; Lee et al., Citation2018), in particular in those areas where immigration is a relatively new and growing phenomenon.
In line with previous studies highlighting the existence of political divergences between rural and urban areas (Jennings & Stoker, Citation2016; Kriesi, Citation2010; Lipset & Rokkan, Citation1967; Scala & Johnson, Citation2017; Tyler et al., Citation2017), regression outputs confirm that municipalities with higher population levels are characterized by different political ideologies compared with non-urban contexts. Indeed, the findings show that communes with higher levels of population are associated with more right-wing and technocratic political attitudes (the first column of each model in ). Moreover, the results indicate that residents living in cities are significantly more ecological. Interestingly, the estimates indicate that there are strong and significant indirect effects for the dummy variable ‘city’. In particular, municipalities located close to cities (but not cities themselves) are characterized by significant more left-wing, conservative–nationalist and ecological attitudes (the second column of each model in ). Overall, these findings further suggest that the geographical distribution of political ideologies is also a manifestation of the rural–urban divide, even after controlling for local sociodemographic and socioeconomic characteristics.
Finally, it is also worth noting how the results confirm previous findings highlighting how political attitudes are stratified by local sociodemographic characteristics. In particular, regression outputs show that municipalities with a higher share of people aged 65 or more are associated with local political ideologies significantly more right-wing and liberal–globalist. Additionally, local political preferences appear to be stratified by educational level, with municipalities characterized by higher shares of inhabitants with a third-level education (i.e., university or equivalent education) being associated with more left-wing and liberal–globalist political attitudes.
CONCLUSIONS
This article overcomes the limitations of the data typically used in the literature on the geography of discontent by considering referendum data over a period of almost four decades and, therefore, analysing the long-term structure and evolution of political ideologies in Switzerland. Indeed, the application of factor analysis techniques on more than 300 referendums allowed the extraction of the fundamental political ideologies driving political behaviour in Switzerland. More specifically, the analysis identified three main dimensions expressing the following political debates: left versus right, conservative–nationalist versus liberal–globalist, and ecological versus technocratic.
On each of these three dimensions, the results empirically assessed the existence of spatial concentrations of Swiss municipalities sharing similar political ideologies. This implies that there are significant political divides among groups of neighbouring municipalities sharing similar political ideologies. Moreover, the evolution of such divides between 1981 and 2017 suggests that the Swiss political ideology space is characterized by a phenomenon of increasing polarization. Finally, the empirical analysis of the factors potentially explaining the political ideology differences among Swiss municipalities showed how these political divides are associated with inequalities along various socioeconomic dimensions, such as local economic welfare, migration flows and urbanity, even after controlling for local sociodemographic characteristics, such as age and education.
These findings contribute to the existing literature by highlighting that linkages between the place of residence and political preferences are not restricted to specific elections or single referendums. Rather, it determines the existence of such linkages also for the long-term structure of political ideologies, which is independent of short-term, candidate- and party-related factors. Therefore, economic geography seems to represent an important lens through which to understand the recent political divides related to specific topics or single elections as well as – most importantly – the more profound political divides along fundamental political ideologies. These findings suggest that political divides related to single referendums or specific elections in other countries (such as the 2016 UK Brexit vote, the French presidential election in 2017, the 2018 Italian general election, the 2019 European Parliament election) might also be signalling deeper political cleavages.
The existence of significant political ideology divides among citizens living in municipalities with different socioeconomic characteristics suggests that inequalities in terms of local economic welfare, migration flows and urbanity might represent an important obstacle in generating social and spatial cohesion (Wilkinson, Citation2018). Hence, the results of this study seem to indicate that a viable possibility to create spatial and social cohesion addressing political cleavages may be represented by political interventions addressing the above-mentioned inequalities. In particular, place-sensitive policies (Barca et al., Citation2012) specifically focusing on local economic potential and considering the distress generally felt in rural municipalities with low economic welfare, long-term economic decline and relatively large shares of incoming migrants seem to represent the best opportunity to address political divides and seek political, economic and social stability.
Supplemental Material
Download MS Word (79.9 KB)ACKNOWLEDGEMENTS
The author thanks the anonymous reviewers whose excellent comments helped to improve and clarify this article. The author is also grateful to Professor Rico Maggi, Professor Philip McCann, Professor Andrés Rodríguez-Pose, Professor Roberto Basile and Dr Davide Luca, who provided valuable insights and expertise. This article was awarded the Epainos Prize 2018 at the European Regional Science Association (ERSA) Conference 2018, Cork, Ireland.
DISCLOSURE STATEMENT
No potential conflict of interest was reported by the authors.
Additional information
Funding
Notes
1 More specifically, any constitutional change needs to be approved by a mandatory referendum. An optional referendum can be demanded for any change in Swiss law decided by the federal parliament. Additionally, any Swiss citizen may propose a popular initiative to introduce amendments to the federal constitution. The outcome of any vote is legally binding. Swiss citizens vote about four times a year, and the most frequent topics on which they vote are healthcare, taxes, social welfare, drug policy, public transport, immigration, political asylum and education.
2 For a detailed explanation of spatial econometric models, see Anselin (Citation1988), LeSage and Pace (Citation2009) and Elhorst (Citation2014).
3 The spatial Durbin model together with the spatial lag model and the spatial error model represent the most popular spatial econometric models (Jing et al., Citation2018). However, the latter two models are special cases of the spatial Durbin model (LeSage & Pace, Citation2009). For this reason, the analysis focuses on the spatial Durbin model. Moreover, likelihood ratio tests (see ) further support the choice of this spatial specification.
4 Factor analysis accounts for the fact that the wording of referendums on similar topics could be inconsistent by giving positive or negative factor loadings.
5 Considering the size distribution of Swiss municipalities, this research considers municipalities with at least 10,000 inhabitants as cities.
6 Voter turnout could be conceptualized as a political behaviour outcome and used as an alternative dependent variable (as in Guiso et al., Citation2020). This could be particularly appropriate when analysing the individual behaviour related to a single vote or election, where people first decide whether to vote and then how to vote. In this article, however, the focus is on the long-run political ideology at the municipal level, and including local voter turnout as an explanatory variable allows better capturing systematic temporal and spatial variations in political engagement. Yet Appendix B in the supplemental data online reports the results without voter turnout among the regressors and those with voter turnout as dependent variable.
7 The results considering the entire data set but excluding the variable on education are available from the author upon request.
8 To verify the adequacy of the data set to the application of factor analysis techniques, Kaiser–Meyer–Olkin tests (Kaiser & Rice, Citation1974) on each subsample were performed. The test returns a value between 0 and 1. Kaiser and Rice (Citation1974) indicated that values > 0.9 are marvellous and that, in this case, the results of the factor analysis yield distinct and reliable factors. The results of the tests are 0.94 for the period 1981–90 and 0.97 for the periods 1991–2000, 2001–10 and 2011–17, confirming the adequacy of the considered data set.
9 For the results of the factor analysis, see Appendix A in the supplemental data online.
10 The factors are built considering all the votes with a factor loading of at least 0.5 (in absolute terms).
11 The choice of the two dimensions to consider is based on their importance in explaining the overall variance of political preferences, as indicated from the results of the factor analysis.
12 To avoid potential confusion about the political ideology labels used in this article, it is important to highlight that the ‘left–right’ dimension refers to the debate on topics such as the welfare state and the protection of the workforce, while the ‘liberal/globalist–conservative/nationalist’ is related to the debate on the opening of the country and the application of liberal economic policies. Therefore, the coexistence of a left-wing (right-wing) perspective with a conservative–nationalist (liberal–globalist) attitude in municipalities with lower (higher) levels of median income is plausible (and similar to the case of Labour voters in the UK, who are left-wing and yet anti-globalization).
REFERENCES
- Abrams, S., & Fiorina, M. (2012). ‘The big sort’ that wasn’t: A skeptical reexamination. PS: Political Science & Politics, 45(2), 203–210. https://doi.org/10.1017/S1049096512000017
- Alonso, W. (1964). Location and land use. Harvard University Press.
- Anselin, L. (1988). Spatial econometric: Method and models. Kluwer.
- Anselin, L. (1995). Local indicators of spatial association – LISA. Geographical Analysis, 27(2), 93–115. https://doi.org/10.1111/j.1538-4632.1995.tb00338.x
- Ballas, D., Dorling, D., & Hennig, B. (2017). Analysing the regional geography of poverty, austerity and inequality in Europe: A human cartographic perspective. Regional Studies, 51(1), 174–185. https://doi.org/10.1080/00343404.2016.1262019
- Barca, F., McCann, P., & Rodríguez-Pose, A. (2012). The case for regional development intervention: Place-based versus place-neutral approaches. Journal of Regional Science, 52(1), 134–152. https://doi.org/10.1111/j.1467-9787.2011.00756.x
- Baum-Snow, N., & Pavan, R. (2013). Inequality and city size. Review of Economics and Statistics, 95(5), 1535–1548. https://doi.org/10.1162/REST_a_00328
- Becker, S., Fetzer, T., & Novy, D. (2017). Who voted for Brexit? A comprehensive district-level analysis. Economic Policy, 32(92), 601–650. https://doi.org/10.1093/epolic/eix012
- Bishop, B. (2008). The big sort: Why the clustering of like-minded America is tearing us apart. Houghton Mifflin.
- Castells, M. (1996). The rise of the network society: The information age: Economy, society and culture (Vol. 1). Blackwell.
- Dijkstra, L., Poelman, H., & Rodríguez-Pose, A. (2019). The geography of EU discontent. Regional Studies, 54(6), 1–17. https://doi.org/10.1080/00343404.2019.1654603
- Elhorst, J. P. (2014). Spatial econometrics: From cross-sectional data to spatial panels. Springer.
- Ellickson, B. (1971). Jurisdictional fragmentation and residential choice. American Economic Review, 61(2), 334–339. https://www.jstor.org/stable/1817011
- Fujita, M. (1989). Urban economic theory: Land use and city size. Cambridge University Press.
- Galbraith, J. (2012). Inequality and instability: A study of the world economy just before the great crisis. Oxford University Press.
- Glaeser, E., & Ward, B. (2006). Myths and realities of American political geography. Journal of Economic Perspectives, 20(2), 119–144. https://doi.org/10.1257/jep.20.2.119
- Goodwin, M., & Heath, O. (2016). The 2016 referendum, Brexit and the left behind: An aggregate-level analysis of the result. Political Quarterly, 87(3), 323–332. https://doi.org/10.1111/1467-923X.12285
- Guiso, L., Herrera, H., Morelli, M., & Sonno, T. (2020). Economic insecurity and the demand of populism in Europe (Working Paper).
- Harder, J., & Krosnick, J. (2008). Why do people vote? A psychological analysis of the causes of voter turnout. Journal of Social Issues, 64(3), 525–549. https://doi.org/10.1111/j.1540-4560.2008.00576.x
- Harris, R., & Charlton, M. (2016). Voting out of the European Union: Exploring the geography of leave. Environment and Planning A: Economy and Space, 48(11), 2116–2128. https://doi.org/10.1177/0308518X16665844
- Harris, J., & Todaro, M. (1970). Migration, unemployment and development: A two sector analysis. American Economic Review, 60, 126–142. https://www.jstor.org/stable/1807860
- Harvey, D. (1973). Social justice and the city. University of Georgia Press.
- Hermann, M., & Leuthold, H. (2003). Atlas der politischen Landschaften: ein weltanschauliches Porträt der Schweiz. vdf Hochschulverlag AG.
- Hooghe, L., & Marks, G. (2018). Cleavage theory meets Europe’s crises: Lipset, Rokkan, and the transnational cleavage. Journal of European Public Policy, 25(1), 109–135. https://doi.org/10.1080/13501763.2017.1310279
- Jennings, W., & Stoker, G. (2016). The bifurcation of politics: Two Englands. Political Quarterly, 87(3), 372–382. https://doi.org/10.1111/1467-923X.12228
- Jing, Z., Elhorst, J. P., Jacobs, J. P., & de Haan, J. (2018). The propagation of financial turbulence: Interdependence, spillovers, and direct and indirect effects. Empirical Economics, 55(1), 169–192. https://doi.org/10.1007/s00181-017-1249-y
- Kaiser, H., & Rice, J. (1974). Little Jiffy Mark IV. Educational and Psychological Measurement, 34(1), 111–117. https://doi.org/10.1177/001316447403400115
- Kawachi, I., & Berkman, L. (2003). Neighborhoods and health. Oxford University Press.
- Kim, J., Elliott, E., & Wang, D. (2003). A spatial analysis of county-level outcomes in U.S. Presidential elections: 1988–2000. Electoral Studies, 22(4), 741–761. https://doi.org/10.1016/S0261-3794(02)00008-2
- Kinsella, C., McTague, C., & Raleigh, K. (2015). Unmasking geographical polarization and clustering: A micro-scalar analysis of partisan voting behavior. Applied Geography, 62(3), 404–419. https://doi.org/10.1016/j.apgeog.2015.04.022
- Kriesi, H. (2010). Restructuration of partisan politics and the emergence of a new cleavage based on values. West European Politics, 33(3), 673–685. https://doi.org/10.1080/01402381003654726
- Lee, N., Morris, K., & Kemeny, T. (2018). Immobility and the Brexit vote. Cambridge Journal of Regions, Economy and Society, 11(1), 143–163. https://doi.org/10.1093/cjres/rsx027
- Lee, L., & Yu, J. (2010). Estimation of spatial autoregressive panel data models with fixed effects. Journal of Econometrics, 154(2), 165–185. https://doi.org/10.1016/j.jeconom.2009.08.001
- LeSage, J., & Pace, K. (2009). Introduction to spatial econometrics, statistics: A series of textbooks and monographs. CRC Press.
- Lipset, S., & Rokkan, S. (1967). Cleavage structures, party systems, and voter alignments: An introduction. In S. Lipset & S. Rokkan (Eds.), Party systems and voter alignments: Cross-national perspectives (pp. 1–64). Free Press.
- Los, B., McCann, P., Springford, J., & Thissen, M. (2017). The mismatch between local voting and the local economic consequences of Brexit. Regional Studies, 51(5), 786–799. https://doi.org/10.1080/00343404.2017.1287350
- MacLeod, G., & Jones, M. (2018). Explaining ‘Brexit capital’: Uneven development and the austerity state. Space and Polity, 22(2), 111–136. https://doi.org/10.1080/13562576.2018.1535272
- McCall, L. (1998). Spatial routes to gender wage (in)equality: Regional restructuring and wage differentials by gender and education. Economic Geography, 74(4), 379–404. https://doi.org/10.2307/144331
- McCann, P. (2018). The trade, geography and regional implications of Brexit. Papers in Regional Science, 97(1), 3–8. https://doi.org/10.1111/pirs.12352
- McCann, P. (2020). Perceptions of regional inequality and the geography of discontent: Insights from the UK. Regional Studies, 54(2). https://doi.org/10.1080/00343404.2019.1619928
- McPherson, M., Smith-Lovin, L., & Cook, M. (2001). Birds of a feather: Homophily in social networks. Annual Review of Sociology, 27(1), 415–444. https://doi.org/10.1146/annurev.soc.27.1.415
- Meltzer, A., & Richard, S. (1981). A rational theory of the size of government. Journal of Political Economy, 89(5), 914–927. https://doi.org/10.1086/261013
- Moran, P. (1948). The interpretation of statistical maps. Journal of the Royal Statistical Society. Series B, 10, 243–251. https://www.jstor.org/stable/2983777
- Rodríguez-Pose, A. (2018). The revenge of the places that don’t matter (and what to do about it). Cambridge Journal of Regions, Economy and Society, 11(1), 189–209. https://doi.org/10.1093/cjres/rsx024
- Scala, D., & Johnson, K. (2017). Political polarization along the rural–urban continuum? The geography of the presidential vote, 2000–2016. Annals of the American Academy of Political and Social Science, 672(1), 162–184. https://doi.org/10.1177/0002716217712696
- Schelling, T. (1971). Dynamic models of segregation. Journal of Mathematical Sociology, 1(2), 143–186. https://doi.org/10.1080/0022250X.1971.9989794
- Tiebout, C. (1956). A pure theory of local expenditures. Journal of Political Economy, 64(5), 416–424. https://doi.org/10.1086/257839
- Tyler, P., Evenhuis, E., Martin, R., Sunley, P., & Gardiner, B. (2017). Growing apart? Structural transformation and the uneven development of British cities. Cambridge Journal of Regions, Economy and Society, 10(3), 425–454. https://doi.org/10.1093/cjres/rsx017
- Wilkinson, W. (2018). The density divide. Urbanization, polarization, and populist backlash (No. June 2018). Washington, DC.