
 ?Mathematical formulae have been encoded as MathML and are displayed in this HTML version using MathJax in order to improve their display. Uncheck the box to turn MathJax off. This feature requires Javascript. Click on a formula to zoom.
ABSTRACT
To prevent the spread of COVID-19, many governments have imposed lockdowns. This practice has resulted in economic stagnation across broad areas because of the shock of the lockdown propagated to other regions through supply chains. Using supply-chain data for 1.6 million firms in Japan, this study examines how the economic effects of lockdowns in multiple regions interact with each other. Our major findings are twofold. First, when multiple regions coordinate the timing of their lockdowns, their economic losses are smaller than when they do so asynchronously. Second, the benefit of synchronous lockdown in multiple regions is larger when they are connected through a larger number of supply-chain links. Our results suggest a need for policy coordination across regions and countries when lockdowns are imposed.
1. INTRODUCTION
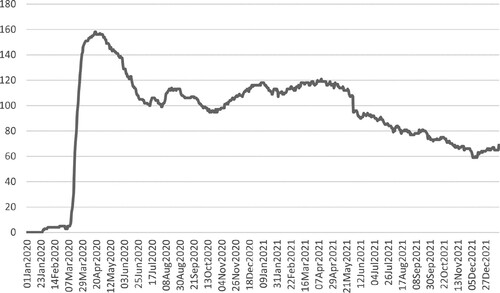
To prevent the spread of COVID-19 starting in late 2019, many governments imposed ‘lockdowns’ on cities, regions or entire countries, shutting down or shrinking economic and social activities. On 18 April 2020, when the first wave of COVID-19 severely hit the world, 158 countries required that workplaces close, at least for some sectors or categories of workers (Hale et al., Citation2020) (). The number of locked-down countries decreased to 95 on 16 October 2020 because some countries lifted restrictions, while it increased to the second peak of 121 on 11 April 2021.
Figure 1. Number of countries requiring a workplace for some sectors or categories of workers or all but essential workplaces.
Source: Authors using data from Hale et al. (Citation2020).
Restrictions associated with lockdown reduce the economic activity of the regions in lockdown because of the requirements to close workplaces and a shortage of labour in workplaces. More importantly, the negative economic effect of lockdown propagates through supply chains, that is, supplier–client relationships among firms, to other regions that are not necessarily locked down. Such propagation occurs through two channels, as theorized in Barrot and Sauvagnat (Citation2016), Carvalho et al. (Citation2021) and Bonadio et al. (Citation2020). First, when a firm decreases its production due to lockdown, its client firms may have to decrease production because of a lack of supply of intermediate goods and services. Second, its suppliers may decrease production because of demand shortages.
The propagation of economic shocks because of natural disasters through supply chains is evidenced in the academic literature, using past disasters in the United States (Barrot & Sauvagnat, Citation2016; Kashiwagi et al., Citation2021) and the Great East Japan earthquake in 2011 (Boehm et al., Citation2019; Carvalho et al., Citation2021; Inoue & Todo, Citation2019a, Citation2019b). More recent works have estimated the economic effect of anti-COVID-19 lockdown while accounting for supply-chain propagation using input–output (IO) linkages at the country-sector level (Bonadio et al., Citation2020; Guan et al., Citation2020; McCann & Myers, Citation2020; McKibbin & Fernando, Citation2020; Arriola et al., Citation2020; Haddad et al., Citation2021). Moreover, the propagation effect of lockdown in Tokyo was estimated, using data for Japan with detailed supply-chain information at the firm level (Inoue & Todo, Citation2020).
However, one important aspect not fully examined in the literature is how the economic effect of lockdown in different regions and countries interacts with each other and whether the interaction magnifies the total economic effect of lockdown. If such an interaction occurs, coordination among policies in different regions and countries may alleviate its magnification, as discussed in the literature on interregional and international policy coordination in the presence of spillover effects (Kremer & Miguel, Citation2007; Taylor, Citation2013).
The experience of Sweden in the early period of the COVID-19 pandemic suggests the need for policy coordination. Sweden did not require that workplaces close in the first wave of the COVID-19 pandemic in 2020 to minimize the economic effect of the pandemic, while neighbouring countries, such as Finland, Norway and Denmark, did. Later, Sweden required workplaces to close in some sectors from November 2020 to May 2021, together with its neighbouring countries. While the growth rate of Sweden’s gross domestic product (GDP) during the first wave was comparable with that of its neighbouring countries, Sweden achieved higher GDP growth in the synchronous lockdown than it did in the asynchronous lockdown and than its neighbouring countries (Eurostat) (Hale et al., Citation2020). These experiences of Sweden motivated us to examine the difference in the economic effect between synchronous and asynchronous lockdown in particular.
A limited number of studies discuss the need for the coordination of policies related to COVID-19. For example, Ruktanonchai et al. (Citation2020) demonstrate that non-pharmaceutical interventions, such as social distancing and lockdown, require coordination across countries to maximize their effectiveness at reducing COVID-19 transmission. The authors found that the simultaneous implementation and relaxation of interventions is effective. Acharya et al. (Citation2020) found that although the international coordination of policies for the domestic containment of infection and trade tariffs resulted in better health and economic outcomes, higher-than-optimal tariffs were imposed in the market equilibrium because of a prisoners’ dilemma situation. Bonadio et al. (Citation2020) argue the difficulty of coordination because of public opinions that were not necessarily based on scientific evidence. However, no study has examined the need for coordination when multiple governments impose lockdown to minimize their negative economic effect, incorporating their propagation through supply chains, except for Inoue et al. (Citation2021), who focused on the effect of lifting, rather than imposing, lockdown.
To fill this gap, this study investigates the effect of regionally coordinating lockdowns on production, simulating an agent-based model of production based on supply-chain data of 1.6 million firms in Japan. Agent-based models that incorporate agent interactions through networks have been widely used in social science recently (Axtell et al., Citation2006; LeBaron & Tesfatsion, Citation2008; Gomez & Lazer, Citation2019). Specifically, we compare the production loss from ‘synchronous lockdowns’ imposed and lifted in multiple prefectures simultaneously and that from ‘asynchronous lockdown’ imposed and lifted at different times.
We hypothesize that synchronous lockdowns lead to a smaller production loss in the whole economy than do asynchronous lockdown. This result is because in asynchronous lockdowns firms in different locked-down prefectures that are linked through supply chains are affected by the direct lockdown effects in their own prefectures and by the propagation effects from lockdowns in other prefectures. Moreover, in synchronous lockdown, firms in locked-down prefectures are already affected by the direct effects and may not be substantially affected by the propagation effects. However, this hypothesis may not be supported, depending on the structure of supply chains across regions (Acemoglu et al., Citation2015, Citation2020; Inoue & Todo, Citation2019a, Citation2019b), as explained in detail in section 2.4. Therefore, we specifically examine the role of the supply-chain structure, such as the strength of the supply-chain links between prefectures, in the need for policy coordination.
The rest of the paper is structured as follows. Section 2 describes the data and simulation methods. Section 3 presents the simulation results and discussion. Section 4 concludes.
2. METHODS
2.1. Data
This study uses data collected by Tokyo Shoko Research (TSR), particularly the Company Information Database and Company Linkage Database. The former contains attributes for each firm, including its address, industry classification and sales, while the latter consists of its clients and suppliers in Japan. We specifically use the data for 2016, the latest year available at the time of this study. The number of firms in the dataset is 1,668,567, and the number of supply-chain links is 5,943,073. The data cover most firms in Japan, except for microenterprises, and most major supply chain relationships between them. Because the sales of each supplier from each client and final consumers are not available in the database, we estimated the transaction volume between each firm pair using that between each sector pair taken from the 2015 IO Tables for Japan (Ministry of Economy, Trade and Industry, Japan, Citation2015), as described in detail in Information A.1 in the supplemental data online. In this estimation process we classified firms into 187 industries according to the IO Tables. Some firms were dropped from the sample because they lack total sales in the data. Accordingly, the number of firms in the sample is 966,627, whereas the number of links is 3,544,343.
Several supply-chain characteristics in the sample as a network should be noted. First, the number of links of each firm, or the degree, follows a power-law distribution (Inoue & Todo, Citation2019a), as is commonly observed in many natural and social networks (Barabási, Citation2016). Second, the average number of steps between firms, or the average path length in the supply chains, is 4.8. Compared with the number of firms in the network, this value is surprisingly small. Such a network is commonly called a small-world network (Watts & Strogatz, Citation1998). Finally, using the same TSR dataset, previous studies (Inoue & Todo, Citation2019a; Fujiwara & Aoyama, Citation2010) have found that 46–48% of the firms are included in the giant strongly connected component (GSCC), in which all firms are directly or indirectly connected through directed links. That is, approximately half of the firms are involved in numerous GSCC cycles. Accordingly, unstable behaviours emerge because of the many feedback loops of the supply chains, as the literature suggests (Inoue & Todo, Citation2019a).
2.2. Model
2.2.1. Overview and key assumptions
We employed the dynamic agent-based model of Inoue and Todo (Citation2019a, Citation2019b, Citation2020), which is an extension of the model of Henriet et al. (Citation2012). In the model, the firms are linked through the supply chains. Specifically, each firm uses a fixed amount of labour and various intermediates provided by its suppliers, produces its product, and sells it to client firms and final consumers. Supply chains are predetermined by the data and do not change: Even after the disruption of supply chains, firms cannot find any new supplier or client.
We assume a Leontief production function where the production of one unit of a product requires a certain amount of each intermediate good and labour. The proportion of each intermediate required for the production of a product by a firm is predetermined by the data. The products are assumed to be specific to each sector, determined by the IO tables (Ministry of Economy, Trade and Industry, Japan, Citation2015); hence, suppliers of a firm in the same sector provide the same intermediate product. Each firm holds an inventory of intermediates from suppliers in case of a supply shortage, whereas it holds no inventory of its own product and immediately delivers it to clients.
In this model, firms do not maximize their profits; hence, there is no price or market mechanism. Rather, each firm demands a certain amount of intermediates to each supplier to satisfy the demand for its product from its clients and consumers. In the initial period before lockdown, or on day 0, the demand for and supply from any firm are equal to each other. At the end of day 0, lockdowns are imposed in some regions (prefectures in the case of Japan). Accordingly, the production capacity of affected firms declines; thus, the demand for the product of a firm may surpass its supply. In that case, the firm rations its product to its suppliers and consumers according to a rule based on their pre- and post-lockdown demand, as explained in detail below.
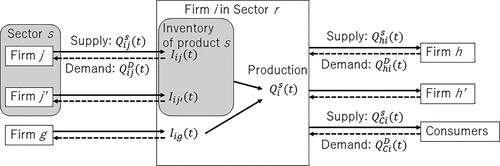
An overview of the model is depicted in . The source code to execute the model is on GitHub, as is the correspondence between the code and the model.Footnote1
Figure 2. Overview of the agent-based model.
Note: Products flow from left to right, whereas orders flow in the opposite direction. Equation numbers correspond to those in the main text.
2.2.2. Demand and supply in the pre-lockdown period
We now describe the economy without any lockdown on the initial day, or day 0. We denote the daily supply of the intermediate product of supplier to client on day
by
and the daily supply of firm
to the final consumers by
. Then, the production of firm
on day 0, which is assumed to be equal to the total demand for i’s product initially, is given by:
(1)
(1) We assume that each firm predicts that the demand for its product on day
is equal to that on the previous day,
. To meet the demand, firm needs supplier j’s product of an amount because
represents the supply of
’s product to
in the initial state and
is the ratio of the current demand to the initial supply.
In addition, firms demand intermediates for inventories to prepare for supply chain disruptions. Specifically, firm has an inventory of the intermediate produced by firm
at the beginning of day
(i.e., before firm
uses the intermediate for production on day
),
, and aims to restore this inventory to a level equal to a given number of days
of the utilization of supplier
’s product,
. We assume that ,ni. is randomly determined by a Poisson distribution where the mean is
. Following Inoue and Todo (Citation2019a),
is set to 9 such that the model most closely replicates the economic reaction to the Great East Japan earthquake. In addition, to avoid a bullwhip effect, that is, large fluctuations across simulations,
is assumed to be equal to or larger than 4.Footnote2 When the actual inventory
is smaller than its target
, firm i increases its inventory gradually by
of the gap in one day so it reaches the target in
days. We assume that
, following Hallegatte (Citation2008).
Combined with the two purposes, that is, production and inventory, firm ’s demand for the product of its supplier
on day t, denoted by
, is given by:
(2)
(2) Accordingly, total demand for the product of supplier
on day
,
, is given by the sum of total demand from its client firms and final consumers:
(3)
(3) On day 0, we assume that the inventory level is equal to its target level (
) and that the demand for the product of firm
on the previous day is equal to its production (
). Therefore, there is no excess supply or demand on day 0:
and
.
2.2.3. Production capacity reduction because of lockdown
Now, suppose some regions of the economy impose lockdown at the end of day 0. The lockdowns shrinks firm production capacity in two ways. First, because the lockdown requires some workplaces in the regions to be closed and some workers to stay home, it leads to a shortage of facilities and labour. If firm is in a locked-down region, its production capacity is assumed to decline by proportion
, determined by firm sector
and region
, as defined in section 2.3. That is, the maximum production assuming no supply shortage but only a labour shortage for firm
on day
,
, is given by:
(4)
(4) Second, the production of firm
is limited by a supply shortage when firm suppliers are affected by the lockdowns. When facing a shortage of supplies from supplier
, firm
can use its supply inventory. Because firms in the same sector produce the same product, firm i can use intermediate good from any supplier in the same sector interchangeably. Therefore, the maximum possible production of firm
limited by the product inventory of the sector
intermediate on day
,
, is given by:
(5)
(5) where
is firm
’s total inventory of the intermediate produced in sector
on day, and
is the amount of intermediate s required to produce the initial production level of firm i.
We then can determine the maximum production of firm on day
, considering two constraints faced by
:
(6)
(6) Therefore, the supply of firm i on day
is determined by either the maximum production capacity when it is smaller than the demand or by the demand and thus given by:
(7)
(7)
2.2.4. Production rationing
When the total demand for firm ’s product is greater than its production capacity, the firm cannot satisfy the demand of its clients and consumers and thus must ration its production to them, following a procedure developed by Inoue and Todo (Citation2019a). Suppose that firm
has clients
and an aggregate of final consumers. Let us denote the ratio of the demand of client
for the product of firm i to its initial demand by
and the corresponding ratio for the final consumer demand by
.
The supply to each client and consumer is determined by the following steps. At the beginning of step , the amount of production that remains to be rationed is defined as
. We also define the minimum ratio of the current demand to the initial demand by
. In the first step where
and ,Q-i-R.[1] = ,Q-i-S.(t) by definition, if:
(8)
(8) firm
rations to each client firm and consumer the amount of its demand multiplied by the minimum demand ration
. The production remainder,
, is handed over to the second step. In the second step, a client firm or the aggregate consumer that satisfies its demand (or whose rate of the current demand to the initial demand is at the minimum) is dropped. In contrast, if Equationequation (8)
(8)
(8) does not hold in the first step, firm
rations to each client and consumer the amount of its demand multiplied by the ratio of the remaining production to the demand defined by
. Accordingly, the remainder of production
is equal to
and handed over to the second step. In the subsequent steps, we repeat this procedure until
becomes zero. In this rationing process, any client can obtain a positive production amount, whereas clients with a smaller
, that is, those that demand less after the lockdown relative to the pre-lockdown demand, can meet a larger portion of their demand.
Under this rationing policy, the inventory of firm ’s product held by firm
on day
is updated to:
(9)
(9) This equation combined with equations (2) and (7) determines the demand of firm
for the intermediate good supplied by firm
on day
,
, and the total demand for firm
’s product
. The supply of firm
on day
,
, is then determined by equations (4–7).
In the model, the production shock by lockdown propagates upstream to clients because of the supply shortage and downstream to suppliers because of the demand shortage. However, because the supply shortage can be mitigated by inventory and supplier substitution, downstream propagation is likely to be slower than upstream propagation.
2.2.5. Model caveats
We built this model to simulate the behaviour of the shock propagation. However, because our model is quite simple, some factors that may affect the propagation are not incorporated.
First, the model does not consider prices or markets. If product supply does not meet product demand, the price increases so that client firms reduce demand. For simplicity, we do not consider this market mechanism but assume rationing rules to address excess demand. Moreover, in the rationing rules, we ignore possible long-term contracts between suppliers and their clients that determine a specific transaction amount between them.
Second, our model does not consider exogenous changes in final consumption because of lockdown although such changes, for example, larger demand for essential products and smaller demand for tourism, were observed in practice. This omission is because we do not have data on changes in consumer demand in a locked-down prefecture for each prefectural sector and we cannot estimate them because of a lack of data on interprefectural trade of final goods and services. However, our model considers demand changes for intermediate goods because of the lockdowns. It also considers that final product consumption changes because of production decreases. Thus, although we ignore decreases in final demand because of lockdowns, we still incorporate upstream propagation because of the demand shrinkage.
Third, we assume no labour mobility across firms although lockdowns partially lead to labour supply reductions in each firm.
Fourth, we assume that firms cannot find any new suppliers when facing a supply shortage from their current suppliers, that is, supply chains are fixed over time. Because of these shortcomings in our model, its results should be interpreted as short-term lockdown results.
Fifth, our simulation analysis includes firms in the service sector; hence, it assumes that inputs from the service sector, like those from the manufacturing sector, can be stored as inventory. This assumption is mostly due to technical reasons: If there is no inventory of certain products, a bullwhip effect is likely to occur in the simulation, and the results fluctuate substantially. To avoid this, we maintain this unrealistic assumption.
Sixth, the sectoral classifications used in this study include the wholesale and retail sectors. One problem in dealing with wholesalers and retailers in this methodology is that we assume that any wholesaler sells the same sector-specific product to its retailer, although in practice they may sell different products, such as computers and automobiles. This assumption may result in easier substitution among wholesalers in our simulations.
Seventh, the TSR data report only the location of each firms’ headquarters, not its branch location. Because firms’ headquarters are concentrated in Tokyo, production activities in Tokyo and thus the propagation effect of lockdown in Tokyo are most likely to be overvalued in our analysis.
Finally, we ignore international supply chain links in our simulations, which is of great interest in practice (Organisation for Economic Co-operation and Development (OECD), Citation2021), although the model can be expanded to consider international supply chains (Inoue, Citation2021). Here, because of a lack of data on international supply chains, we focus on domestic supply chains.
2.3. Lockdowns in Japan
In Japan, ‘lockdowns’ or social and economic restrictions to prevent the spread of COVID-19 were imposed at the prefectural level by declaring a state of emergency (The Prime Minister of Japan and His Cabinet, Citation2020). They were first declared on 7 April 2020, in seven prefectures – Tokyo, Osaka, Fukuoka and their neighbouring prefectures – because these jurisdictions are metropolitan areas and thus had a large number of confirmed COVID-19 cases. On 16 April 2020, the state of emergency was expanded to all 47 prefectures. On 14 May 2020, it was lifted for 39 prefectures; on 21 May, for an additional three; and on 25 May 2020, for the remaining five prefectures. After that, states of emergency were occasionally declared and lifted in some prefectures, as subsequent waves of COVID-19 were observed.
One notable characteristic of the state of emergency in Japan is that the government cannot require people to stay home or businesses to close down; it can only request that they do so. Therefore, the level of restrictions during lockdowns is lower in Japan than it is in other countries. However, under strong social pressure in Japan, people and businesses partially voluntarily restrict their activities. Using data from smartphones, Yabe et al. (Citation2020) found that human mobility in Tokyo declined by 50% one week after the first state of emergency. Therefore, we use the term ‘lockdown’ to express the state of emergency throughout this paper, although lockdown usually implies strict and enforceable restrictions.
The human mobility data suggest that economic activities in a state of emergency suffer from labour shortages because some workers must stay at home. This suggestion is consistent with the assumption of our model in section 2.2 that firm production capacity declines because of labour shortages. However, we cannot observe the extent to which each firm or sector reduced its production capacity in the actual state of emergency. Therefore, we assume the rate of production capacity reduction for each sector by modifying the finding in the literature (Guan et al., Citation2020; Bonadio et al., Citation2020; Dingel & Neiman, Citation2020) to fit the case of Japan.
Following Bonadio et al. (Citation2020), we first assume that the sector-specific reduction rate is determined by the degree of exposure to COVID-19 multiplied by the share of workers who cannot work at home. The degree of exposure to COVID-19 is taken from Guan et al. (Citation2020) and set to be 0.1 for essential sectors, 0.5 for some low-exposure sectors and 1.0 for other ordinary sectors. The share of workers working from home for each sector is taken from Dingel and Neiman (Citation2020), who rely on US data. For example, in sectors in which exposure to the virus is low (50%) and 13.4% of workers can work at home, such as the agriculture sector, the rate of reduction was 43.3% (). Sectors with ordinary exposure (100%) and a lower share of workers working at home (33.2%), such as the textile sector, reduce production capacity by 66.8% (
).
However, Inoue et al. (Citation2021) found that using these reduction rates, the simulated production loss in Japan as a result of the first state of emergency was substantially larger than the actual loss. The reduction rates based on US data (Dingel & Neiman, Citation2020) were too high for Japan, possibly because of the voluntary nature of its lockdown. According to Inoue et al. (Citation2021), the reduction rates in the production capacity for Japan that generated the best fit between the simulated and actual production losses were the benchmark reduction rates following the literature multiplied by 0.268. This study uses these adjusted reduction rates taken from Inoue et al. (Citation2021). The reduction rate for each sector before and after the adjustment are shown in Table A1 in Appendix A in the supplemental data online.
2.4. Conceptual framework and hypothesis
The primary research question in this study is whether the synchronous or asynchronous lockdown of more than one prefecture results in a larger production loss for all prefectures, that is, GDP in Japan. This subsection provides a conceptual framework to answer the question.
For this purpose, suppose that firm in prefecture
is a supplier of firm B in prefecture
. Further suppose that
and
impose synchronous lockdowns so both
and reduce their production capacity simultaneously. In this case, the reduction production supplier
does not substantially affect client
because B is already affected by the lockdown. In contrast, if the two prefectures impose lockdown asynchronously, firm
reduces production twice, once by the lockdown of its own prefecture
and once by shortage of supplies from
because of the lockdown of the other prefecture
. Therefore, the total production loss from the asynchronous lockdowns is likely to be larger than that from the synchronous lockdown. Although this example is quite simple, the same argument can be applied to the case in which firms in different prefectures are connected indirectly through supply chains. Therefore, we hypothesize that the effect of the synchronous lockdown of multiple prefectures on the production loss in the whole economy is smaller than the effect of their asynchronous lockdown.
However, this hypothesis may not be supported depending on supply-chain structure, as the following three examples suggest. First, if firms in prefecture are not linked with those in
, firms in
are not affected by the lockdown of
. Therefore, the synchronous and asynchronous lockdowns of the two prefectures should result in the same production loss. Second, the larger effect of an asynchronous lockdown may be minimized by substituting of suppliers (Barrot & Sauvagnat, Citation2016; Kashiwagi et al., Citation2021; Inoue & Todo, Citation2019a, Citation2019b). For example, if firm
is also connected with supplier
in another prefecture that is not in lockdown, the disrupted supplies from
may be substituted for by supplies from C. If this substitution effect is sufficiently large, the propagation effect of an asynchronous lockdown may be similar to that of a synchronous lockdown. Finally, if firms in prefectures
and
are strongly connected with each other and with firms in other prefectures through a number of links, the synchronous lockdowns of
and may generate severe cascading economic shocks throughout the economy, leading to a complete system failure (Inoue & Todo, Citation2019a). Such system failure or phase transition is observed in the propagation of shocks through financial networks in practice (e.g., in the global financial crisis) and in simulation studies depending on the network structure (Acemoglu et al., Citation2015). If this is the case, the effect of synchronous lockdown may be larger than that of asynchronous lockdowns resulting in moderate long-term production losses.
In conclusion, we generally expect a larger economic effect of the asynchronous lockdown of multiple regions than we do of their synchronous lockdowns. However, the hypothesis may not be empirically supported depending on the supply-chain structure.
2.5. Simulations
Using the agent-based model, supply chain data, and the estimated reduction rates in production capacity because of the lockdowns, we simulate how the various prefectural lockdown effects differs on the production losses, depending on whether the prefectural lockdowns were imposed synchronously or asynchronously. For this purpose, we took the following three steps.
2.5.1. Propagation effects of one prefectural lockdown
First, to check the presence and size of the propagation effect, we started by investigating how the effect of only one prefectural lockdown propagates to other prefectures. In each of the benchmark scenarios, we assume the strict lockdown of a particular prefecture that restricts its economic activities in all sectors for four weeks. That is, during the lockdown period, each firm in the locked-down prefecture reduces its production capacity as determined by the sectoral reduction rate explained in section 2.3, while the production capacity of firms in other prefectures does not change. In each scenario, we ran Monte Carlo simulations 30 times, randomly choosing each firm inventory size, . The number of runs in each scenario was sufficiently large because the simulated GDP (total value added) did not vary substantially across the 30 runs, or its standard deviation was less than 0.5% of the actual GDP.
In each scenario when only one prefecture imposes lockdown, we average the production loss, that is, gross regional product (GRP) without any lockdown and less the GRP simulated in the scenario, of each prefecture over the 30 runs to evaluate the geographical propagation effect. In addition, to check how the level of restrictions affected the production loss, we experimented with various levels by changing their sectoral coverage and duration. We assume three additional types of sectoral coverage: (1) the accommodation and leisure sectors only, (2) the restaurant sector in addition to (1), and (3) the retail sector in addition to (2). Information A2 in the supplemental data online presents the list of sectors in each type. In addition, we assume three more types of lockdown durations: one, two and three weeks. The total lockdown effect might not be proportional to its sectoral coverage and duration because how the effect propagated to the whole economy through supply chains depended on how the affected sectors were connected with other sectors and how the propagation was magnified over time.
2.5.2. Effect of synchronous and asynchronous lockdown in two prefectures
Second, to discuss the need for policy coordination, we examine how the effect of two prefectural lockdowns on their productions differed depending on whether the lockdowns were imposed synchronously or asynchronously. Specifically, we experimented with all possible combinations for the two prefectures, that is, scenarios, running 30 Monte Carlo simulations in each scenario and averaging the production loss over the 30 runs. In these scenarios, we focused on the strictest lockdown assuming that both prefectures restricted all sector activities for four weeks, although we checked the robustness of our results by assuming other lockdown types as described above. We further assumed that in the synchronous scenario, both prefectures imposed the lockdown simultaneously, while in the asynchronous scenario, only one of the two prefectures imposed its lockdown for the first four weeks, followed by a four-week lockdown by the other prefecture.
We then compared the total production loss of Japan, that is, the GDP loss, averaged over the 30 runs between the two scenarios. Furthermore, we examine how the difference in the GDP loss between the synchronous and asynchronous lockdowns was determined by the two prefectural characteristics, focusing on the number of supply chain links between them, the geographical distance between them, and the sum of their GRPs.
2.5.3. Effect of all prefectural synchronous and asynchronous lockdowns
Finally, we considered scenarios in which all prefectures imposed lockdown on all sectors for four weeks and compared the effect of all prefectural synchronous lockdowns on the GDP losses with the effects of their asynchronous lockdown. In the case of the synchronous lockdown, we assumed that all prefectures imposed lockdown for four weeks at the beginning of a three-month period. We ran 30 simulations, changing the inventory size, in section 2.2, of each firm. In an asynchronous lockdown, we also assume that each prefecture imposed lockdowns for four weeks but randomly set its initial date during the three-month period, while at least one prefecture started its lockdown at the beginning of the period. We ran the simulation 100 times, changing each prefectural lockdown timing and each firm’s inventory size.
3. RESULTS AND DISCUSSION
3.1. Effect of lockdown in one prefecture
shows how the lockdown of all sectors in one prefecture for four weeks affects other prefectural production losses. Each cell presents the prefectural production loss on the horizontal axis as a percentage of its GRP because of the prefectural lockdown, shown on the vertical axis. Each prefectural GRP was obtained from the TSR data. The dark red cells indicate a large production loss, while the yellow and purple cells indicate a moderate and small losses, respectively.
Figure 3. Economic impact of four-week prefectural lockdown of all sectors.
Note: Each cell colour presents the prefectural production loss in the horizontal axis as a percentage of its gross regional product (GRP) because of prefectural lockdowns on the vertical axis. (Readers of the print article can view the figure in colour online.)
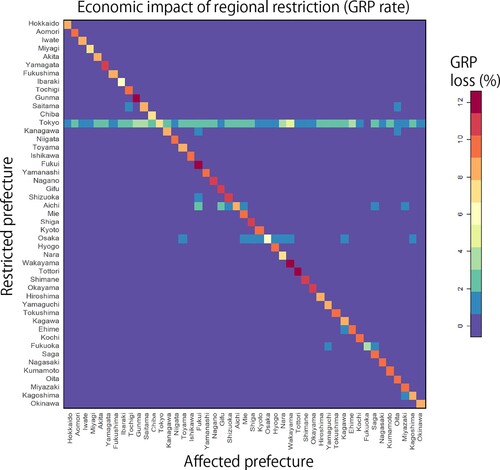
The diagonal cells are mostly orange or red, showing a large negative effect of a prefectural lockdown on its own production. Off the diagonal line, the cells are mostly purple, indicating that the production loss in a prefecture because of the lockdown of another prefecture was mostly less than 1% of its GRP. This finding implies that when only one prefecture imposes lockdown on its all sectors for four weeks, the propagation effect on other prefectures is quite limited. However, the horizontal line of green and blue cells in the upper part of suggests that the lockdown of Tokyo, the largest industrial prefecture in Japan, has a large negative effect on other prefectural production. In particular, prefectures that are geographically close to Tokyo, such as Saitama and Gunma, and those that are not close to Tokyo but that are relatively backward, such as Wakayama and Ehime, are largely affected possibly because of their heavy supply chain reliance on Tokyo. In addition, the lockdowns in other economically more advanced and larger prefectures, such as Osaka and Aichi, have large propagation effects on others.
One possible reason for the negligible propagation from lockdowns in other prefectures, except for the most industrial prefectures, is the substitutability of inputs. Our model, as described in section 2.2 assumes that when supplier inputs are disrupted by lockdown, firms can substitute other suppliers in the same sector. Therefore, if a firm is linked with a supplier in a locked-down prefecture but also with others in the same sector in other non-locked-down prefectures, the lockdown propagation effect can be largely alleviated. Therefore, unless large economies with many suppliers are locked down, the propagation effect through supply chains can be minimal.
In addition, we show in the left panel of the correlation between the prefectural GRP and the total GDP (not GRP) loss in Japan as a result of the prefectural lockdown. Both axes are log scaled. We found a positive correlation between the two, implying that the lockdown of an economically large prefecture resulted in the total GDP loss in Japan, including other prefectural GRP losses. However, we also found that the lockdown of prefectures with similar GRPs did not necessarily generate GDP losses of a similar size. For example, although the GRPs of Osaka, Aichi and Kanagawa are quite similar to each other, the lockdown of Osaka results in a far larger GDP loss in Japan than did the lockdowns of Aichi or Kanagawa. Fukuoka is another example of a large propagation effect. These findings imply that the supply-chain structure of each prefecture plays an important role in determining the propagation effect of its lockdown.
Figure 4. (left) Correlation between the prefectural gross regional product (GRP) and gross domestic product (GDP) loss because of the prefecture lockdown. The horizontal axis presents the GRP of the locked-down prefecture in log, whereas the vertical axis shows the GDP loss caused by the lockdown in log. (right) Correlation between the number of interprefectural links and GDP loss as a result the prefectural lockdown. The horizontal axis presents the number of links connected between the focal prefecture and the other prefectures. In both panels the lockdowns are assumed to restrict all sectors for four weeks. Each label indicates the name of the locked-down prefecture.
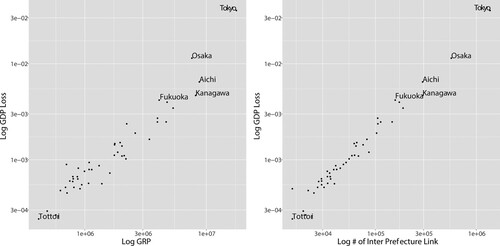
To test this conjecture, we further show in the right panel of the correlation between the interprefectural supply-chain links and the total GDP loss as a result of the prefectural lockdown. We find a better fit between the two than the fit shown in the left panel. That is, the GDP loss by a prefecture’s lockdown can be predicted more precisely by how the prefecture is linked with others through supply chains than it can by the economic size of the prefecture.
We also experimented with different sectoral coverage and lockdown durations, as explained in section 2.5. Figure B1 in Appendix B in the supplemental data online shows the results corresponding to , but assuming different sectoral coverage, whereas Figure B2 in Appendix B online presents the results assuming lockdown for one week, a shorter duration. The results are omitted from the simulations assuming lockdowns for two and three weeks, because the difference between the scenarios was negligible. Figures B1 and B3 in Appendix B online clearly indicate that the propagation effect of the lockdowns is smaller when the sectoral coverage is smaller or the duration is shorter. Additionally, our main finding is that the effect is mostly negligible except for the scenarios in which a major industrial prefecture imposes a lockdown. Therefore, in the subsequent analysis, we present only the results from the scenarios in which lockdowns are imposed on all sectors for four weeks, although we confirm the robustness of the main results by assuming different lockdown types.
3.2. Effect of synchronous and asynchronous lockdown in two prefectures
We now turn to scenarios in which two prefectures impose lockdown synchronously or asynchronously to examine which lockdown timing results in a smaller total production loss in Japan. We particularly highlight the results from the lockdowns of all sectors for four weeks as mentioned earlier.
As section 3.1 found that the lockdowns in Tokyo had a large propagation effect, not comparable with those in any other prefecture, we first focus on the synchronous and asynchronous lockdown of Tokyo and another prefecture and present the resulting GDP loss as a percentage of GDP in . We find that the synchronous lockdowns of Tokyo and any other prefecture lead to a smaller GDP loss than did the asynchronous lockdowns of the same pair. Based on the conceptual consideration in section 2.4, this finding implies that any prefecture is strongly linked with Tokyo through supply chains. Therefore, the asynchronous lockdowns affect the prefecture twice, once due to its own lockdown and once by the lockdown in Tokyo, leading to a larger total effect. Moreover, section 2.4 suggests that the effect of the asynchronous lockdowns can be similar to that of the synchronous lockdowns when supplier substitution across prefectures is widely available to firms or even smaller when the interaction between the synchronous lockdowns lead to a cascading and devastating effect. However, our result implies that firms in Tokyo may not be substitutable for firms in other prefectures not in lockdown. In addition, the synchronous lockdown of Tokyo and any other prefecture does not generate a cascading effect.
Figure 5. Economic impact of the synchronous and asynchronous lockdown of Tokyo and another prefecture.
Note: Blue and red bars show the average gross domestic product (GDP) loss because of the synchronous and asynchronous lockdown, respectively, of Tokyo and another prefecture shown on the vertical axis over 30 simulations. The lockdowns are assumed to be imposed on all sectors for four weeks. The black segments indicate the standard errors of GDP loss.
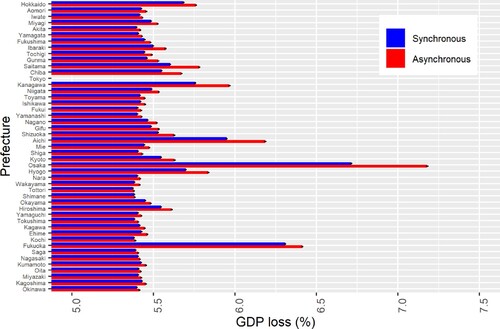
Another notable finding in is that the difference between the synchronous and asynchronous lockdowns is larger when the partner prefecture of Tokyo is a more industrial prefecture, such as Kanagawa, Aichi or Osaka. These results imply that the industrial prefectures are strongly linked with Tokyo through supply chains, so the benefits of synchronous lockdown are large. In addition, synchronous lockdowns of Tokyo and another major industrial prefecture do not cause a cascading effect, possibly because lockdowns in Japan are not very restrictive (section 2.3). Moreover, the difference is the largest when the partner is Osaka, although the GRP of Kanagawa is larger than is that of Osaka (). This evidence suggests that while Osaka is economically smaller than Kanagawa, the former is a more important hub of supply chains following Tokyo. Firms in Tokyo and Osaka are linked inextricably to each other and cannot be substituted for by firms in other prefectures. Therefore, the two prefectures can be substantially affected by their asynchronous lockdown.
We further simulate all the possible combinations of the two prefectures. However, because showing such results requires too much space, we simply show the GDP loss from the synchronous and asynchronous lockdown of Aichi, Osaka and Tottori and another prefecture in the Information C in the supplemental data online. Aichi and Osaka are major industrial prefectures, while Tottori has the smallest GRP. Figures C3–C5 in Appendix C in the supplemental data online show that the GDP losses from the asynchronous lockdowns are always greater than are those from the synchronous lockdowns. The difference in the case of Tottori is negligible because it does not have many supply chain links with the other prefectures and thus is not affected by lockdowns in other prefectures.
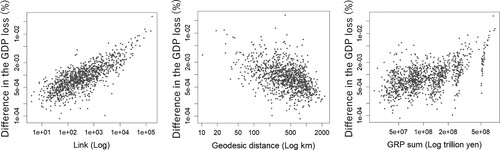
In addition, plots the relationship between the difference in the GDP loss between the synchronous and asynchronous lockdowns for each prefectural pair and the pair characteristics, that is, the number of supply chain links between the two prefectures (left panel), the geographical distance between the two prefectural capital cities (middle panel) and the sum of GRPs of the two prefectures (right panel). Spearman’s rank correlation coefficient between the difference in the GDP loss and the number of supply chain links is 0.74, showing the high correlation among the three in . This result supports the hypothesis in section 2.4 that if two prefectures are strongly connected, asynchronous lockdown leads to a larger GDP loss than does synchronous lockdown. The geodesic distance is negatively correlated with the difference in the GDP loss, and Spearman’s rank correlation coefficient of the two is –0.47. The negative correlation may arise because a shorter geodesic distance is often associated with more links. However, because the correlation coefficient is higher for the number of supply chain links than it is for the geodesic distance, economic relationships should be considered to be more important than geographical relationships. The sum of GRPs of two prefectures is positively correlated with the difference in the GDP loss, with a correlation coefficient of 0.49. This is because two prefectures with large GRPs are likely to have many large firms and thus to have many links between them.
Figure 6. Relationships between the difference in gross domestic product (GDP) loss between the synchronous and asynchronous lockdowns of all prefecture pairs and their selected characteristics.
Note: The vertical axis shows GDP loss from the asynchronous lockdowns of two prefectures less the GDP loss from their synchronous lockdowns as a ratio of the sum of their gross regional products (GRPs). The horizontal axes in the left, middle and right panels show the number of supply chain links between the two prefectures in logs, the distance between the two prefectural capitals in logs, and the sum of GRP of the two prefectures in logs, respectively.
3.3. Effect of the synchronous and asynchronous lockdowns of all prefectures
Finally, we consider scenarios in which all 47 prefectures impose lockdown on all sectors for four weeks either synchronously or asynchronously during a three-month period. As explained in section 2.5, we run 30 simulations in the case of the synchronous lockdowns, changing the inventory size of each firm, and 100 simulations in the case of the asynchronous lockdowns, additionally changing the lockdown timing of each prefecture. shows the changes in the daily GDP loss (daily GDP in the pre-pandemic period less simulated GDP) from the 30 simulations assuming synchronous lockdown (blue lines) and the 100 simulations assuming asynchronous lockdowns (red and grey lines). The red lines present three particular simulations assuming asynchronous lockdown to highlight the difference from those simulations assuming synchronous lockdown.
Figure 7. Gross domestic product (GDP) losses because of the synchronous and asynchronous lockdowns of all prefectures.
Note: The vertical axis shows the loss in daily GDP, that is, the daily GDP in the pre-COVID-19 period minus the daily simulated GDP assuming the synchronous (blue lines) or asynchronous (red and brown lines) lockdowns of all prefectures, divided by the daily GDP in the pre-COVID-19 period. The horizontal axis shows the number of days from the lockdown start. The synchronous lockdowns are imposed on all sectors in all prefectures simultaneously for four weeks at the beginning of the three-month period. The asynchronous lockdown in each prefecture is imposed on all sectors for four weeks from a randomly selected initial date during the three-week period. We run 30 simulations in the case of the synchronous lockdowns, changing the inventory size of each firm, and 100 simulations in the case of the asynchronous lockdowns, additionally changing the lockdown timing for each prefecture. The inset shows the violin plot of the GDP loss from the synchronous (blue) and asynchronous (red) lockdowns. (Readers of the print article can view the figure in colour online.)
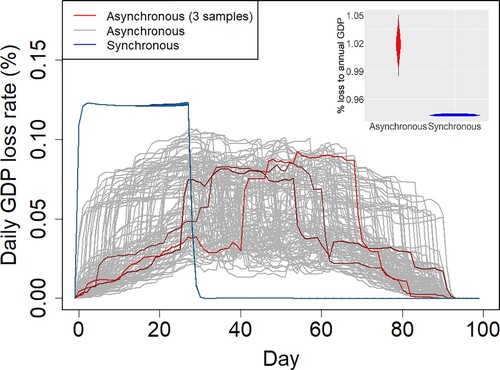
The three red lines show that because of the asynchronous lockdowns, the GDP loss is positive for a long time, leading to a large total effect. Meanwhile, the blue lines show that the effect of synchronous lockdown is large but temporal. Each red line jumps up suddenly and jumps down approximately 30 days later because of the randomly determined lockdowns in Tokyo. As the inset of shows, the average GDP loss from the synchronous lockdown is 4.69 trillion yen or US$43.8 billion and smaller than that from the asynchronous lockdown, 5.11 trillion yen or US$47.6 billion. The difference is statistically significant with <
, according to a Wilcoxon rank sum test. This finding is consistent with those in the previous subsection, confirming the hypothesis in section 2.4 that the effect of synchronous lockdowns of multiple regions on production is smaller than the effect of their asynchronous lockdown because of the strong supply chain links between the regions.
4. CONCLUSIONS
This study examines whether the synchronous or asynchronous lockdowns of multiple regions result in larger production losses when we incorporate propagation of the economic effect through supply chains using a simulation approach and detailed supply chain data for Japan. We hypothesize that the effect of a synchronous lockdown is smaller than that of an asynchronous lockdown because the latter causes the economy to propagate multiple times. Our simulations focusing on lockdown in two prefectures and in all prefectures firmly support this hypothesis.
Our results imply that lockdown policies must be coordinated across regions and countries to minimize the economic impact of the COVID-19 pandemic or any other future pandemic. Specifically, governments are suggested to impose lockdown simultaneously rather than at different times. A similar suggestion is provided by Ruktanonchai et al. (Citation2020), who claimed the need for synchronous lockdown in various countries to minimize the effect of COVID-19 on infections. The results of this study and Ruktanonchai et al. (Citation2020) clearly show that lockdown should be imposed in various regions and countries simultaneously to minimize both the health and economic effects.
However, it should also be emphasized that the difference in the economic effect between synchronous and asynchronous lockdowns in multiple regions depends on the supply-chain structure across regions. Our conclusion holds when regions are linked strongly through supply chains but not when regions are isolated from each other. Moreover, if inputs are highly substitutable across regions, the propagation effect can be largely mitigated of other locked-down regions on regions not locked down. Therefore, lockdowns should be coordinated among countries and regions densely connected through supply chains. Considering the effect of policy coordination on infections (Ruktanonchai et al., Citation2020), governments may be interested in coordinating among regions with short geographical distance or with high levels of human traffic. However, our analysis shows that governments should also be concerned about economic relations among regions to maximize the overall effect of policy coordination.
Finally, although we find benefits to coordinating of lockdown policies, such coordination may be difficult to achieve for market equilibrium. For example, Acharya et al. (Citation2020) employed a model using infection and trade and found that coordinating policies for domestic containment and tariffs could not be achieved from the perspective of tariff wars. Biancotti et al. (Citation2020) argued that policy coordination is difficult from a political economy perspective because governments often respond to public opinion more than they do to scientific evidence. Because our analysis is based on an agent-based model and treats lockdown policies as exogenous, we cannot examine whether optimal policy coordination can be achieved for market equilibrium. Rather, our analysis emphasizes the need for policy coordination even when it is not achieved by market forces.
Supplemental Material
Download PDF (360.4 KB)DISCLOSURE STATEMENT
No potential conflict of interest was reported by the authors.
Notes
1 The URL for an anonymized repository is https://anonymous.4open.science/r/ProductionNetworkSimulator-461E.
2 Although it is preferable to obtain for each firm from the data because inventory size may critically affect the magnitude of the effect of propagation of shocks (Pichler et al., Citation2021; Reissl et al., Citation2021), our data do not include such information. However, the main purpose of the present paper is to compare the propagation effect between coordinated and uncoordinated restrictions across regions, not to predict the size of the propagation effect. Therefore, our use of calibrated values of
is justified.
REFERENCES
- Acemoglu, D., Chernozhukov, V., Werning, I., & Whinston, M. D. (2020). Optimal targeted lockdowns in a multi-group SIR model. NBER Working Paper Series No. 27102. National Bureau of Economic Research (NBER).
- Acemoglu, D., Ozdaglar, A., & Tahbaz-Salehi, A. (2015). Systemic risk and stability in financial networks. The American Economic Review, 105(2), 564–608. doi:10.1257/aer.20130456
- Acharya, V. V., Jiang, Z., Richmond, R. J., & von Thadden, E.-L. (2020). Divided we fall: International health and trade coordination during a pandemic. NBER Working Paper Series No. 28176, National Bureau of Economic Research (NBER).
- Arriola, C., Guilloux-Nefussi, S., Koh, S.-H., Kowalski, P., Rusticelli, E., & van Tongeren, F. (2020). Efficiency and risks in global value chains in the context of COVID-19. OECD Economics Department Working Paper No. 1637, OECD.
- Axtell, R., Blair, B., Bowles, S., DeVany, A., DeBevoise, M., Durlauf, S., Epstein, S. D., Gintis, H., Goldman, A., & Page, S. (2006). Generative social science: Studies in agent-based computational modeling. Princeton University Press.
- Barabási, A.-L. (2016). Network science. Cambridge University Press.
- Barrot, J.-N., & Sauvagnat, J. (2016). Input specificity and the propagation of idiosyncratic shocks in production networks. The Quarterly Journal of Economics, 131(3), 1543–1592. doi:10.1093/qje/qjw018
- Biancotti, C., Borin, A., Cingano, F., Tommasino, P., & Veronese, G. (2020). The case for a coordinated COVID-19 response: No country is an island. https://voxeu.org/article/case-coordinated-covid-19-response-no-country-island.
- Boehm, C. E., Flaaen, A., & Pandalai-Nayar, N. (2019). Input linkages and the transmission of shocks: Firm-level evidence from the 2011 Tōhoku earthquake. The Review of Economics and Statistics, 101(1), 60–75. doi:10.1162/rest_a_00750
- Bonadio, B., Huo, Z., Levchenko, A. A., & Pandalai-Nayar, N. (2020). Global supply chains in the pandemic. NBER Working Paper Series No. 27224. National Bureau of Economic Research (NBER).
- Carvalho, V. M., Nirei, M., Saito, Y. U., & Tahbaz-Salehi, A. (2021). Supply chain disruptions: Evidence from the Great East Japan earthquake. The Quarterly Journal of Economics, 136(2), 1255–1321. doi:10.1093/qje/qjaa044
- Dingel, J. I., & Neiman, B. (2020). How many jobs can be done at home? Journal of Public Economics, 189, 104235. doi:10.1016/j.jpubeco.2020.104235
- Fujiwara, Y., & Aoyama, H. (2010). Large-scale structure of a nation-wide production network. The European Physical Journal B, 77(4), 565–580. doi:10.1140/epjb/e2010-00275-2
- Gomez, C. J., & Lazer, D. M. (2019). Clustering knowledge and dispersing abilities enhances collective problem solving in a network. Nature Communications, 10(1), 1–11. doi:10.1038/s41467-018-07882-8
- Guan, D., Wang, D., Hallegatte, S., Davis, S. D., Huo, J., Li, S., Bai, Y., Lei, T., Xue, Q., Coffman, D., Cheng, D., Chen, P., Liang, X., Xu, B., Lu, X., Wang, S., Hubacek, K., and Gong, P. (2020). Global supply-chain effects of COVID-19 control measures. Nature Human Behaviour, 4(6), 577–587. doi:10.1038/s41562-020-0896-8
- Haddad, E. A., Perobelli, F. S., Araújo, I. F., & Bugarin, K. S. (2021). Structural propagation of pandemic shocks: An input–output analysis of the economic costs of COVID-19. Spatial Economic Analysis, 16(3), 252–270. doi:10.1080/17421772.2020.1844284
- Hale, T., Webster, S., Petherick, A., Phillips, T., & Kira, B. (2020). Oxford COVID-19 government response tracker. https://www.bsg.ox.ac.uk/research/research-projects/coronavirus-government-response-tracker.
- Hallegatte, S. (2008). An adaptive regional input–output model and its application to the assessment of the economic cost of Katrina. Risk Analysis, 28(3), 779–799. doi:10.1111/j.1539-6924.2008.01046.x
- Henriet, F., Hallegatte, S., & Tabourier, L. (2012). Firm-network characteristics and economic robustness to natural disasters. Journal of Economic Dynamics and Control, 36(1), 150–167. doi:10.1016/j.jedc.2011.10.001
- Inoue, H. (2021). Propagation of international supply-chain disruptions between firms in a country. Journal of Risk and Financial Management, 14(10), 461. doi:10.3390/jrfm14100461
- Inoue, H., Murase, Y., & Todo, Y. (2021). Do economic effects of the anti-COVID-19 lockdowns in different regions interact through supply chains? PLoS ONE, 15(9), e0239251. doi:10.1371/journal.pone.0255031
- Inoue, H., & Todo, Y. (2019a). Firm-level propagation of shocks through supply-chain networks. Nature Sustainability, 2(9), 841–847. doi:10.1038/s41893-019-0351-x
- Inoue, H., & Todo, Y. (2019b). Propagation of negative shocks across nation-wide firm networks. PLoS ONE, 14(3), e0213648. doi:10.1371/journal.pone.0213648
- Inoue, H., & Todo, Y. (2020). The propagation of economic impacts through supply chains: The case of a mega-city lockdown to prevent the spread of COVID-19. PLoS ONE, 15(9), e0239251. doi:10.1371/journal.pone.0239251
- Kashiwagi, Y., Todo, Y., & Matous, P. (2021). Propagation of economic shocks through global supply chains—Evidence from hurricane sandy. Review of International Economics, 29(5), 1186–1220. doi:10.1111/roie.12541
- Kremer, M., & Miguel, E. (2007). The illusion of sustainability. The Quarterly Journal of Economics, 122(3), 1007–1065. doi:10.1162/qjec.122.3.1007
- LeBaron, B., & Tesfatsion, L. (2008). Modeling macroeconomies as open-ended dynamic systems of interacting agents. American Economic Review, 98(2), 246–250. doi:10.1257/aer.98.2.246
- McCann, F., & Myers, S. (2020). Covid-19 and the transmission of shocks through domestic supply chains. Financial Stability Notes No. 2020-3, Central Bank of Ireland.
- McKibbin, W. J., & Fernando, R. (2020). The global macroeconomic impacts of COVID-19: Seven scenarios. CAMA Working Paper 19/2020, Centre for Applied Macroeconomic Analysis, Crawford School of Public Policy, Australian National University.
- Ministry of Economy, Trade and Industry, Japan. (2015). The 2015 updated input–output table. https://www.soumu.go.jp/english/dgpp_ss/data/io/index.htm.
- Organisation for Economic Co-operation and Development (OECD). (2021). Global value chains: Efficiency and risks in the context of COVID-19. https://www.oecd.org/coronavirus/policy-responses/global-value-chains-efficiency-and-risks-in-the-context-of-covid-19-67c75fdc/.
- Pichler, A., Pangallo, M., del Rio-Chanona, R. M., Lafond, F., & Farmer, J. D. (2021). In and out of lockdown: Propagation of supply and demand shocks in a dynamic input-output model. SSRN Working Paper 3788494, Social Science Research Network.
- Reissl, S., Caiani, A., Lamperti, F., Guerini, M., Vanni, F., Fagiolo, G., Ferraresi, T., Ghezzi, L. M. (2021). Napoletano, and A. Roventini. Assessing the economic effects of lockdowns in Italy: a dynamic input–output approach. LEM Working Paper 2021/3, Institute of Economics, Scuola Superiore Sant’Anna.
- Ruktanonchai, N. W., Floyd, J., Lai, S., Ruktanonchai, C. W., Sadilek, A., Rente-Lourenco, P., Ben, X., Carioli, A., Gwinn, J., Steele, J., Prosper, O., Schneider, A., Oplinger, A., Eastham, P., and Tatem, A. J. (2020). Assessing the impact of coordinated COVID-19 exit strategies across Europe. Science, 369(6510), 1465–1470. doi:10.1126/science.abc5096
- Taylor, J. B. (2013). International monetary coordination and the great deviation. Journal of Policy Modeling, 35(3), 463–472. doi:10.1016/j.jpolmod.2013.03.010
- The Prime Minister of Japan and His Cabinet. (2020). Government responses on the coronavirus disease 2019. http://japan.kantei.go.jp/ongoingtopics/_00013.html.
- Watts, D. J., & Strogatz, S. H. (1998). Collective dynamics of ‘small-world’ networks. Nature, 393(6684), 440–442. doi:10.1038/30918
- Yabe, T., Tsubouchi, K., Fujiwara, N., Wada, T., Sekimoto, Y., & Ukkusuri, S. V. (2020). Non-compulsory measures sufficiently reduced human mobility in Tokyo during the COVID-19 epidemic. Scientific Reports, 10(1), 1–9. doi:10.1038/s41598-020-75033-5