
ABSTRACT
Background: Increasing interest in digitally enhanced drug delivery tools urges both industry and academia to rethink current approaches to product usability testing. This article introduces mobile eye-tracking, generating detailed contextual data about user engagement with connected self-injection systems as a new methodological approach to formative usability assessment.
Methods: A longitudinal case study with a total of 35 injection-naïve participants was conducted. In three consecutive experiments, eye-tracking was applied to formative usability testing of a novel connected self-injection device. Three eye-tracking derived usability indicators were established to assess product effectiveness, efficiency, and ease of use.
Results: Analysis of the data revealed events of user hesitation, process interruption and unintended action, and these occurrences could either be completely eliminated or significantly reduced throughout the process (product effectiveness). At the same time, the overall use duration decreased from 86.1 to 58.7 sec (product efficiency). Analysis revealed that product modifications successfully guided user attention to those interface elements most relevant during each task, thereby improving product ease-of-use.
Conclusions: The step-wise improvement in the usability indicators demonstrates that iteratively applying eye-tracking methods effectively supports the user-centered design of connected self-injection systems. The results highlight how eye-tracking can be employed to gain an in-depth understanding of patient engagement with novel healthcare technologies.
1. Introduction
Reducing patients’ cognitive and emotional burden in managing chronic disease states has always been a guiding paradigm for new drug delivery device development. Thus, it should be no surprise that easy-to-use injection systems have been instrumental in facilitating effective self-medication regimens across diverse long-term disease states [e.g. Citation1–Citation5]. Diabetes management has a history of pioneering patient-centered new technology development. For instance, the industry has developed effective means for patients to self-normalize blood glucose levels with intensive insulin treatment [Citation6,Citation7]. Factors such as non-adherence due to patients’ fear of injections [Citation8], the need for easy-to-use devices that allow discreet disease management [Citation9], and inaccuracies when measuring out insulin from vials [Citation10,Citation11] drove the development of the first re-usable insulin pen in the 1980s [Citation12]. Patients today benefit from a range of reusable and disposable dial-and-dose pen systems facilitating effective and safe administration of insulin [e.g. Citation13–Citation18].
More recently, the industry has entered a new era where self-injection systems evolve from mechanical drug delivery devices [Citation13,Citation15,Citation19,Citation20] to digitally enhanced health tools [e.g. Citation2,Citation21,Citation22]. For instance, connected diabetes management systems facilitate the capture of the dose and timing of administered insulin in electronic diaries [Citation23], remind and encourage patients to monitor blood glucose levels [Citation24], assist patients in calculating personalized prandial insulin doses [Citation25,Citation26], and interact with continuous glucose monitoring devices in order to seamlessly integrate insulin management [Citation27,Citation28]. In particular, research and practice has shown great interest in pursuing the development of connected and digitally enhanced drug delivery products [Citation2,Citation21,Citation22,Citation29]. Other chronic disease areas, such as psoriasis, hypercholesterolemia, or rheumatoid arthritis, where the point of care similarly shifts from the hospital to the home [Citation4,Citation30,Citation31] will also likely benefit from the advanced patient support connected self-injection systems offer. However, the development of connected self-injection systems has fundamental implications for the conduct of new product development, which to date has escaped scholarly attention. While patient centricity prevails as a guiding paradigm, the industry has to re-think current approaches to incorporate patients’ voices in innovation projects.
Formative usability studies have proven indispensable tools to advance device development [Citation32,Citation33]. Traditionally, new product development has advanced in cycles of optimizing the user interface of pen systems and (re-) assessing patient preferences [Citation34]. Specifically, users’ self-reported ratings or responses to open-ended questions [Citation18,Citation21,Citation35,Citation36], interviews [Citation37,Citation38], or observations [Citation39–Citation41] have been established as standard methods to assess patient engagement with mechanical autoinjectors or dial-and-dose insulin pens [Citation33,Citation42–Citation44]. However, two key challenges highlight the urgent need for new methodological approaches to study usability of digitally enhanced drug delivery systems.
First, connected self-injection devices are multicomponent product systems that, for example, consist of a disposable self-injection device, a re-usable connected monitoring module, and a mobile application installed on a smartphone. This opens up new options for real-time patient guidance across multiple perception channels (e.g. visual, auditory, tactile) throughout the injection process. A new set of research questions thus relates to the interplay between the systems’ user interface elements. In particular, new methods are needed to gain a better understanding of how users actually perceive guidance throughout a self-injection process and how they engage step-by-step with a digitally enhanced product system and its elements. Patients may not be able to comprehensively express their experiences during day-to-day disease management when questioned, nor may observers accurately capture patients’ context-specific visual perception or cognitive processes. In fact, knowledge and experiences are typically difficult to verbalize – especially when tied to emotions, intuition, physical experiences, or motor skills [Citation45,Citation46].
Second, connected digital health tools open up new ways of interacting with patients. Advanced visual and audible cues are able to guide patients step-by-step through the self-injection process, thereby preventing use errors, and allowing caregivers or even healthcare providers to interact in real-time with patient health status. However, distinct feedback elements situated at multiple spatial locations may also impose additional complexity, thereby increasing rather than reducing the cognitive burden of day-to-day disease self-management. To coordinate advanced user interaction elements and optimize patient guidance throughout the self-injection process, one first has to adequately capture the interplay between the system’s digital and mechanical constituent parts. New methodological approaches are thus needed in order to effectively develop new digital drug delivery systems.
This article advances the understanding of how new approaches to usability testing can inform patient-centered development of novel drug delivery systems. It does so by presenting a longitudinal case study applying video-based mobile eye-tracking [Citation47] to iterative formative usability testing of a connected self-injection system. The article employs eye-tracking to continuously follow users’ eye movements and/or absolute point of gaze in order to assess visual and cognitive attention processes related to the use of products [Citation48,Citation49]. In so doing, the study advances eye-tracking as a methodology to evaluate three key dimensions of medical device usability: product effectiveness, product efficiency, and product ease of use. The study concludes with illustrating how eye-tracking may improve and accelerate the design and development of digital drug delivery tools requiring dynamic user interactions. In so doing, the results highlight how eye-tracking can be used to assess behavioral patterns in order to gain a better understanding of patients’ context-specific engagement with connected self-injection systems.
2. Methods
This study uses eye-tracking to measure the distribution of participant visual and cognitive attention as they engage with a connected self-injection system. At first used exclusively in cognitive science [Citation50,Citation51], eye-tracking is today routinely applied across multiple research domains [Citation52]. In human-computer interaction, for instance, stationary eye-tracking systems are well established to investigate usability aspects of software tools or websites [Citation53]. Usability testing of portable products, however, requires the use of mobile eye-tracking glasses, which allow the participant to move freely without restrictions while interacting with the product [Citation48,Citation49]. A camera integrated in the glasses records the participant’s field of view (‘scene video’), while two additional cameras located in the lower frame of the glasses record eye movement. Computer vision allows the determination of the location of the center of the pupils as well as the location of corneal reflections resulting from infrared light emitted by the glasses. Based on these measurements, after initial calibration, an algorithm is used to compute the viewing angle and thus to track what the participant is looking at [Citation47]. His or her gaze point can then be displayed within the scene video.
The present study was conducted using the SMI Eye-tracking Glasses 2 Wireless system (SensoMotoric Instruments, Teltow, Germany). Gaze tracking was executed at a sampling rate of 60 Hz. The angle of view was measured with an accuracy of 0.5° over all distances. The scene video was recorded with a resolution of 960 × 720 px at 30 fps. An integrated microphone was used to record audio data, including sound signals and user comments. Eye-tracking raw data were processed using the SMI BeGaze 3.6 software (SensoMotoric Instruments, Teltow, Germany).
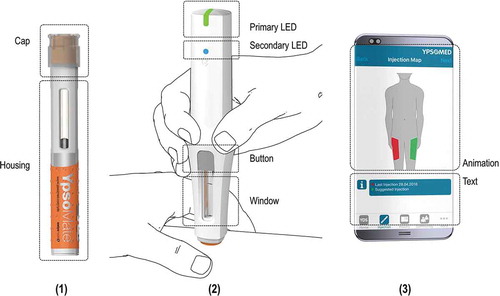
The connected self-injection system consisted of the standard 2-step disposable autoinjector platform YpsoMate (‘AI’, Ypsomed AG, Burgdorf, Switzerland), a reusable monitoring add-on module with built-in sensor and wireless communication technology (‘ADD-ON’, Ypsomed AG, Burgdorf, Switzerland) and a related mobile app on a smartphone (‘APP’, Ypsomed AG, Burgdorf, Switzerland) for in-use patient guidance throughout the injection process. The YpsoMate autoinjector platform has been successfully tested for basic usability and ease of use across various user groups [Citation32]. The focus of the evaluation at hand was on the ADD-ON and the companion APP, and on how the injection process can be optimally guided with such a connected self-injection system. However, the system could also be used as a reminder or as an automated injection event diary. The connected self-injection device platform furthermore offers the possibility to implement therapy-specific functionalities targeting the specific needs of that user population. Specifically, the connected self-injection system is portable and intended for use across chronic disease areas that to date typically rely on mechanical pre-filled syringe-based autoinjectors for drug self-administration, such as rheumatoid arthritis [e.g. Citation54–Citation56], psoriasis [e.g. Citation4,Citation57], diabetes [e.g. Citation58], hypercholesterolemia [e.g. Citation30], or migraine [e.g. Citation59].
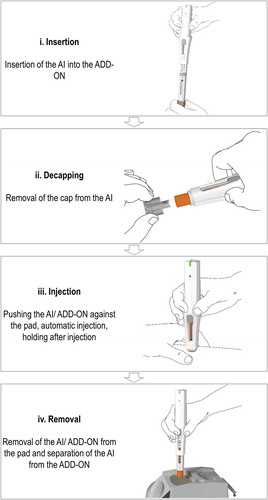
The four user steps required to perform an injection are depicted in . To perform a self-injection with the described connected self-injection system, the AI is first inserted into the ADD-ON. The ADD-ON then activates automatically, establishes a wireless connection with the APP, and – as a connected product system – tracks device usage. The ADD-ON furthermore guides users step-by-step throughout the self-injection process by the help of sophisticated visual and audible feedback patterns. Specifically, the primary LED situated at the rear end of the ADD-ON relates in real-time with the use states throughout the injection. The secondary LED indicates the Bluetooth connection status. Moreover, the ADD-ON indicates any potential use errors and transmits the corresponding data automatically to the companion APP. Audible feedbacks similarly accompany the injection process. The AI furthermore contains a viewing window to track the progress of the injection. Pushing the button for removal decouples the AI after completion of an injection. The APP displays each use step in a short graphical animation. In addition, complementary textual instructions are provided on the APP.
Figure 1. Use steps to perform an injection with the connected self-injection system constituent parts: a disposable 2-step autoinjector for self-injection (AI), a reusable connected monitoring module (ADD-ON) to track device usage, guide patients throughout the injection process, and wirelessly transmit that information to a companion mobile app (APP) installed on a smartphone.
illustrates the research design and describes how eye-tracking provided input to two design iterations of user interface adaptations of the connected self-injection system. A total of three user interface design versions of the connected self-injection system were thus evaluated. The usability of each version was investigated in an independent and separate study of formative testing using eye-tracking as a research method (ETS1-3) based on single site visits [Citation34,Citation60,Citation61]. The insights obtained in eye-tracking studies ETS1 and ETS2 guided the subsequent Design Iterations A and B, respectively.
Table 1. Overview of study design. The table illustrates how the study advanced in iterations between eye-tracking studies (ETS1-3) and modifications to the connected self-injection system’s user interface elements (Design Iteration A & B).
A total of 35 injection-naïve participants without any cognitive or dexterity impairments participated in the study. Participants had normal or corrected-to-normal vision. Participants were recruited anew for each experiment (n1 = 10, n2 = 14, n3 = 11) to control for learning effects [Citation62,Citation63]. During simulated self-injection, all participants wore eye-tracking glasses.
The single steps of the experiment and the following data analysis is shown in . The study was carried out in a controlled laboratory environment. All participants were briefed 24 hours before the actual eye-tracking test. Before data acquisition, a standardized 3-point calibration was performed [Citation47]. The briefing included a presentation of the 2-step AI (without ADD-ON or APP) and demonstration of its correct usage. Participants were then confronted with the connected self-injection system as part of the introduction to the actual eye-tracking experiment and asked to simulate a self-injection following the instructions provided by the APP. Participants simulated use of the connected self-injection system by injecting into an injection pad (Ypsomed AG, Burgdorf, Switzerland) attached to their thigh while sitting next to a table in order to include realistic point-of-use data while simulating self-injections. A complete data set consisting of scene video, gaze data and audio data was recorded for each eye-tracking experiment.
Figure 2. Illustration of the single steps of the experiment and the following data analysis. Video analysis of eye tracking data was performed to evaluate product effectiveness and efficiency, and AOI analysis to quantify the product ease of use.
Eye-tracking-derived usability indicators were computed in order to establish its relationship with three key dimensions of drug delivery device usability: product effectiveness, product efficiency, and product ease of use. These indicators and the corresponding dimensions of medical device usability are defined and introduced below.
First, product effectiveness was defined as the extent to which participants successfully completed a given use step. Eye-tracking data were used to code product effectiveness from the first-person perspective [Citation64], thus enabling fine-grained analysis of participants’ contextual engagement with the connected self-injection system. Specifically, a four-point rating scale (1–4) was used for coding the extent to which a given use step was successfully completed. The ordinal scale included the following items: (1) user error (i.e. requiring moderator intervention); (2) temporary interruption (i.e. close call); (3) user hesitation (i.e. use difficulty); and (4) uninterrupted completion (i.e. successful use). A matrix was then constructed depicting product effectiveness per use step and participant. Descriptive statistics for overall product effectiveness and effectiveness per use step were computed for each eye-tracking study.
Second, product efficiency was derived from the duration of each use step. Eye-tracking data were used to precisely determine the timing of transition points between use steps. The duration of the overall injection process as well as the duration of each use step was assessed separately for each eye-tracking study.
Third, an area of interest (AOI) analysis [Citation65] was used to assess product ease of use. Eye-tracking data showed how long a participant’s gaze focused on a given user interface element; that is, the dwell time on an AOI. Whereas long dwell times on an AOI reflect intensive cognitive efforts, short dwell times correspond to simple interface elements and thus to better product ease of use [Citation49,Citation66]. The user interface of the connected self-injection system was dissected in distinct user interface elements/AOIs as depicted in . The SMI BeGaze 3.6 software was used to compute dwell times per AOI and use step for each eye-tracking study, ETS1-3. Not all AOIs were relevant for all use steps. To establish a basis for the assessment of the amount of visual attention directed to the relevant AOIs, the authors jointly discussed and agreed as to which ones were relevant for successful completion of a given use step. Thus, the amount of visual attention to selected AOIs was used to assess whether and how patient attention had shifted toward relevant user interface elements.
Figure 3. Illustration of the areas of interests (AOIs) for the system constituent parts. AOIs were used as analytical categories to assess if and when participants’ gaze hits a given user interface element.
In addition to the collection of eye tracking data, the participants were asked to evaluate their level of satisfaction directly after having used the connected self-injection system. The evaluation was performed using a 5-point Likert scale from 1 (low satisfaction) to 5 (high satisfaction).The participants were also asked whether and how overall satisfaction of engaging with the product system could be further increased.
3. Results
Eye tracking could be successfully used to quantify the degree of success in task completion and task duration as well as dwell time on different interface elements/AOIs. Detailed analysis of these data allowed the assessment the three key dimensions of medical device usability: product effectiveness, efficiency, and ease of use.
3.1. Product effectiveness
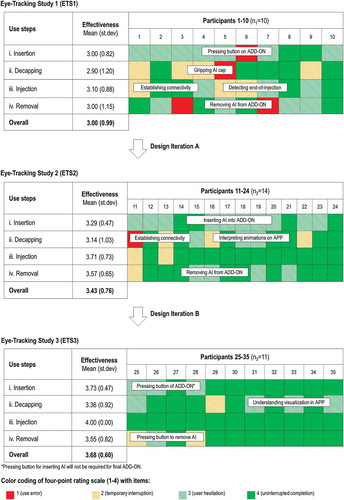
Eye-tracking data revealed situations of user hesitation, process interruption, and unintended action. presents the evolution of product effectiveness (overall and per use step) over the course of the three eye tracking studies. First, eye-tracking data highlight how the mean value of overall product effectiveness, measured on a scale from 1 to 4, improved from 3.00 (ETS1) to 3.43 (ETS2) and 3.68 (ETS3). Importantly, the occurrence of use errors was reduced from 0.4 errors per user for the first version to 0.14 errors per user for the second and 0 errors per user for the last version of the system. At the same time, the overall variability in the extent to which participants successfully executed self-injection decreased, thus pointing to a more robust design of the process; the standard variation for product effectiveness decreased from 0.99 (ETS1) to 0.76 (ETS2) and 0.60 (ETS3). The results based on eye-tracking data thus provide evidence that usability challenges that had been identified were successfully addressed as a part of Design Iterations A or B. Changing the unit of analysis from overall to product effectiveness per use step, similar patterns of improvement could be observed (see ). During ETS1, mean values of product effectiveness per use step varied between 2.90 (use step: ‘ii. Decapping’) and 3.10 (use step: ‘iii. Injection’). As part of iteratively modifying the design of the product system’s user interface elements, the mean values for product effectiveness for the concluding study (ETS3) varied between 3.55 (use step: “iv. Removal) and 4.00 (use step: ‘iii. Injection’). The eye tracking results thus illustrate how the occurrence of usability challenges could either be completely eliminated or significantly reduced throughout the study (see ).
Figure 4. Evolution of product effectiveness over time. Mean and standard deviation (st.dev) of product effectiveness are reported per use step for each eye-tracking study (ETS1-3). Product effectiveness was evaluated by the participants’ degree of success in performing the corresponding task using a four-point rating scale (1–4). The ratings of product effectiveness for each participant (n = 35) are color-coded. The text boxes provide additional information qualitatively explaining the source of unintended user action, interruption of the process, or user hesitation.
3.2. Product efficiency
The second dimension of product usability evaluated by eye-tracking data was product efficiency. This dimension was derived from the duration required to complete the overall use process or a given specific use step. presents the mean and standard deviation of overall duration for each eye-tracking study. The results illustrate how mean overall duration step-wise decreased from 86.1 sec (ETS1) to 81.4 sec (ETS2) and 58.1 sec (ETS3), thus providing evidence of improved overall efficiency in product usage. In particular, overall product efficiency improved as a result of Design Iteration B. Furthermore, Design Iteration B resulted in a notable reduction in overall variation as reflected by the diminishing standard deviation in duration of product usage.
Figure 5. Evolution of product efficiency over time. Mean (standard deviation of) duration [sec] are reported per self-injection use step for each eye-tracking study (ETS1-3). Eye-tracking was used to assess the transition points between use steps in order to accurately assess their duration.
![Figure 5. Evolution of product efficiency over time. Mean (standard deviation of) duration [sec] are reported per self-injection use step for each eye-tracking study (ETS1-3). Eye-tracking was used to assess the transition points between use steps in order to accurately assess their duration.](/cms/asset/2575efce-a962-4340-875a-814d6e837a3e/iedd_a_1563070_f0005_b.gif)
Because eye-tracking allows the accurate definition of transition points between consecutive use steps, the duration per individual use step can be analyzed (see ). The results show that product efficiency improved most notably for use step ‘ii. Decapping’, where the mean duration was 27.8 sec during ETS1 and the mean duration for ETS3 decreased to 7.6 sec. Interestingly – and contrary to the overall trend of increasing product efficiency – the duration of use step ‘i. Insertion’ increased between ETS1 (18.5 sec) and ETS3 (25.3 sec). In line with the overall reduction, the duration of the use steps ‘ii. Decapping’ and ‘iii. Injection’ showed pronounced decreases between ETS2 and ETS3 (from 22.3 to 7.6 sec for ‘ii. Decapping’ and from 21.9 to 13.1 sec for ‘injection’). Contrary to the overall trend, the duration for ‘iv. Removal’ dropped sharply from ETS1 to ETS2 but then increased somewhat in ETS3 (mean values of 19.7, 11.3 and 12.8 sec, respectively).
3.3. Product ease of use
The AOI analysis serves as a basis to study the duration and patterns of how the participants’ gaze reaches a given user interface element of the connected self-injection system, which reflects the product ease of use. presents the results on an aggregated level, thereby unveiling the user guidance toward relevant AOIs required to complete a given use step. highlights participants’ gaze per individual AOI. The results are shown both as the absolute dwell time (in sec) and the relative visual attention (in %). The data show how these values evolved over time (i.e. ETS1-3), illustrating how ease of use changed throughout the study. thus illustrates how the overall dwell time across all use steps decreased, marginally from ETS1 to ETS2 and more substantially from ETS2 to ETS3 (from 53.8 to 52.6 to 41.9 sec). The cumulated dwell times for the individual use steps re-emphasize the results for product efficiency, with dwell times for ‘i. Insertion’ increasing from ETS1 to ETS2 to ETS3 (values of 13.1, 15.7 and 18.7 sec, respectively), a strong drop between ETS2 and ETS3 for ‘ii. Decapping’ (from 17.0 to 6.4 sec) and ‘iii. Injection’ (from 13.1 to 9.3 sec), and finally, for ‘iv. Removal’, a decrease between ETS1 and ETS2 followed by an increase in ETS3 (values of 9.7, 6.8 and 7.5 sec, respectively).
Table 2. Evolution of AOI dwell time over time. Absolute [sec] and relative (%) dwell time per AOI are reported separately for each eye-tracking study (ETS1-3). Decreasing dwell time on AOI corresponds with increasing ease of use. Those AOIs relevant for successful completion of a given use step are color-coded in green.
Figure 6. Evolution of product ease of use over time. Product ease of use is measured by mean dwell time across all areas of interest (AOIs) and use steps. Absolute overall dwell time [sec] and relative dwell time on AOIs relevant for completion of given use step (%) are reported for each eye-tracking study ETS1-3. Decreasing dwell time on AOI relates with increasing ease of use.
![Figure 6. Evolution of product ease of use over time. Product ease of use is measured by mean dwell time across all areas of interest (AOIs) and use steps. Absolute overall dwell time [sec] and relative dwell time on AOIs relevant for completion of given use step (%) are reported for each eye-tracking study ETS1-3. Decreasing dwell time on AOI relates with increasing ease of use.](/cms/asset/f062ec73-fc37-474c-ae6f-b72a16f0bdd9/iedd_a_1563070_f0006_b.gif)
The analysis of the relative dwell times devoted to the AOIs that do or do not prove relevant for the successful completion of a given use step further underscores how user guidance improved as a result of iteratively optimizing the design (see ). Overall, the relative dwell time ‘lost’ on irrelevant AOIs decreased from 15% in ETS1 to 6.5% in ETS2 and then remained all but unchanged in ETS3, at 6.9%. Looking at the individual use steps, relative dwell time on the irrelevant user interface elements decreased significantly between ETS1 and ETS2 and then remained unchanged in ETS3 for all use steps except ‘ii. Decapping’ where it stayed the same between ETS1 and ETS2 and then dropped between ETS2 and ETS3. The results also show that use step ‘i. Insertion’ had the highest relative dwell time spent on irrelevant AOIs, almost twice as much as any other use step in ETS1 and more than 5 times as much as other use steps in ETS3.
also depicts the distribution of dwell times per individual AOI. The high overall proportion of visual attention on the APP-related AOIs is striking. As such, 38.2% of the attention was paid to the animation and 20.6% to the textual instructions included in the APP. Relative dwell time on the animation further increased to 53.5% in ETS3. Similar patterns were found for the other use steps. However, a noticeable exception is the evolution of visual attention on the textual instructions provided in the APP during use step ‘ii. Decapping’. Having simplified the textual instructions as part of Design Iteration B, the mean dwell time decreased from 52.4% in ETS2 to 33.0% in ETS3. Simultaneously, the relative dwell time on the cap increased from 7.9% in ETS1 to 10.6% in ETS2 and 31.3% in ETS3. These results provide indications that the participant’s visual attention indeed shifted to those user interface elements that prove the most relevant at a given point in time.
3.4. User satisfaction
Across all participants, the satisfaction reported directly after product use was rated high with an average of 4.6 on the 5-point Likert-type scale. As most effective drivers for further improvement, the participants named (i) clear instructions, (ii) simple feedback signals, (iii) easy pen insertion and removal and (iv) comfortable user interface elements.
4. Discussion
Throughout the study, all three eye tracking derived usability indicators improved as a result of the modifications made to the design of the connected self-injection system.
Consider the evolution of product effectiveness over time (see ). The relatively high initial values in the first study highlight the connected self-injection system’s maturity at the outset of the study. Nevertheless, the insights generated with help of eye-tracking during ETS1 successfully guided subsequent Design Iteration A, where product effectiveness increased. These improvements can be explained by modifications resulting in clearer and more highlighted user interface elements of the ADD-ON and by the addition of more detail to the video-enhanced animations of the APP. The results suggest that such animations are particularly suitable for conveying information about the location of user interface elements as well as the relative orientation of the systems’ constituent parts. After Design Iteration B, three out of four use steps showed a further increase in mean product effectiveness. The improvement of textual instructions on the APP likely reflects the reasons for this pattern. The findings re-emphasize how short and simple instructions as well as a clear designation of the corresponding interface elements (e.g. ‘Press button’ or ‘Remove cap’) are helpful to users.
Video-based eye-tracking not only enables the categorization of user behaviors but also provides a series of vignettes that unveil how users engaged with the connected self-injection system. The first series of vignettes that can be gleaned in depict the evolution of product effectiveness for use step ‘i. Insertion’. Participants at first (i.e. ETS1) repeatedly struggled with locating the button on the ADD-ON in order to insert the AI effortlessly into the ADD-ON (mean value of product effectiveness: 3.00). As part of Design Iteration A, improvements were made to the video-based animations included in the APP (i.e. adding hands visualizing the interaction) as well as to the texture of the ADD-ON button. Modifying these user interface elements increased the mean value of product effectiveness for the corresponding use step ‘i. Insertion’ to 3.29 (ETS2). Moreover, revising the textual instructions on the APP during Design Iteration B further improved mean product effectiveness to 3.73 (ETS3). The second series of vignettes relates to product effectiveness for use step ‘iii. Injection’. Video-based eye-tracking revealed that some participants initially were confused by the occurrence of both visual (e.g. animations on APP, LEDs on ADD-ON and window of AI) and acoustical (e.g. sound from ADD-ON and audible clicks from AI) feedback elements. Mean product effectiveness for the use step ‘perform injection’ of the first product system design amounted to 3.10 (ETS1). After stepwise adaptation of the feedback patterns during Design Iteration A and B, the mean product effectiveness for use step ‘iii. Injection’ increased to 3.71 (ETS2) and to the maximum score of 4.00 during ETS3 (see ). Here, each participant thus could successfully complete the injection process without interruption or hesitation.
Interestingly, eye-tracking data similarly highlights those instances where no modification was made to a given user interface element. For instance, consider the patterns in how user interface elements relevant to use step ‘iv. Insertion’ were altered. Video-based animations included in the APP were modified as part of Design Iteration A. As a result, the mean value for product effectiveness increased from 3.00 (ETS1) to 3.57 (ETS2). However, no changes were made to relevant user interface elements during Design Iteration B. This again was directly reflected in the product effectiveness, which remained unchanged at 3.55 for ETS3.
Eye-tracking data were further used to study the second dimension of drug delivery tool usability; that is, efficiency of product usage. Specifically, eye-tracking data were used to precisely define transition points between use steps – a methodological challenge that has received limited attention in the literature to date. On an aggregated level, the results for task duration underscore how the duration of the overall injection process could be stepwise reduced. However, the study uncovers divergent effects when changing the unit of analysis from the overall injection process to the duration per use step. Whereas mean duration for use step ‘ii. Decapping’ as well as use step ‘iv. Removal’ decreased as result of both Design Iteration A and B, the study highlights how the duration of use step ‘i. Insertion’ in fact increased as a result of the first design optimization loop (i.e. Design Iteration A). These insights highlight a fundamental trade-off between product effectiveness and efficiency: the diverging trend for product efficiency has to be interpreted in the light of steadily increasing product effectiveness for a corresponding use step. This effect becomes evident when studying how the mobile app contents were revised. On the one hand, the study demonstrates how short and precise textual instructions may noticeably reduce the occurrence of user hesitation and thus enable more efficient product usage. On the other hand, the results similarly underscore how the inclusion of revised animations may well require additional time for sense-making yet dramatically improve product effectiveness. The results illustrate how eye-tracking enables a more fine-grained analysis of patient engagement with the self-injection system that most likely would go unnoticed when using standard usability test methods.
The third dimension of drug delivery tool’s usability – product ease of use – could also be assessed from the eye tracking data. Specifically, the analysis of mean dwell time on AOI – inversely related to the ease of use – allows one to draw conclusions as to how visual attention evolves over time per user interface element and use step. One the one hand, the study shows how mean dwell time decreased stepwise for selected user interface elements. These insights underscore that less visual attention and thus less cognitive effort was required to engage with certain user interface elements as the redesign of the connected self-injection device progressed. In so doing, the results illustrate how eye-tracking provides new approaches to ‘objectify’ evaluation procedures around product ease of use. On the other hand, the results show how visual attention was successfully directed toward those user interface elements that proved relevant for a given use step. As such, relative attention to the relevant AOIs incrementally increased for most of the use steps as a result of Design Iteration A and B, respectively. Furthermore, mean dwell time consistently decreased for certain AOIs and use steps. For instance, the dwell time of the AOI ‘primary LED’ (indicating injection status) decreased from 2.4 sec to 0.8 sec. Similarly, the dwell time on the AOI ‘housing’ decreased from 3.7 sec in ETS1 to 2.5 sec in ETS3. Due to the design modifications during design iterations A and B, less visual attention on certain AOIs was required to effectively complete a use step. These results thus indicate that ease of use could be step-wise improved for various user interface elements, which in turn improved overall product ease-of use.
The high level of satisfaction reported by the participants after using of the injection system points to a basic acceptance of digitally enhanced drug delivery tools. This observation is supported by studies with significantly larger numbers of participants [e.g. Citation2,Citation22], which similarly have reported high to very high user satisfaction.
Drug delivery is about to experience a global trend toward the adoption of digitally enriched technologies that propel novel mechanisms for self-care. For instance, consider flash or continuous glucose monitoring systems where sensors may well act as display devices, alerts in case of hypoglycemia and hyperglycemia, and also wirelessly transmit glucose data to a reader or a mobile application. Similarly, the interplay between an infusion pump, a remote control, and the companion mobile application needs to be carefully understood. The many advantages for patients are accompanied by a new set of development challenges. In particular, these challenges relate to orchestrating the interplay between various constituent parts of a product system user interface. For instance, the results presented here illustrate how the integration of an ADD-ON and APP into the product system has significant implications for how users engage with the core self-injection device. Consequences may relate to user hesitation, temporary interruptions or even unintended user action. Formative usability testing must thus closely guide the fragile process of developing multicomponent product systems and constantly monitor usability along its three critical dimensions: product effectiveness, product efficiency and product ease-of-use. In this context, mobile eye-tracking is ideally suited to complement traditional formative usability methods because it enables a more detailed analysis of the user-product interaction. On the one hand, product usage is assessed from the immediate vicinity and thus allows one to recognize details that cannot be seen ‘from the outside’. On the other hand, the shifting visual attention along the workflow becomes visibly apparent by adopting the user’s point of view. Eye-tracking thus provides a solid methodological foundation to analyze when certain information is discovered and whether it is correctly interpreted. The eye-tracking data obtained in the study facilitated a deep contextual understanding of user engagement with the product system and enabled assessing the extent to which users successfully completed a given use step on a high level of granularity. Furthermore, objective data generated throughout the eye tracking studies portrayed user behaviors in such clear and illuminating ways that the path for product optimization became evident to the cross-functional new product development team.
The insights must be interpreted in the light of the study’s limitations. First, the participants were healthy adults with no dexterity restrictions or cognitive impairments. Future research shall advance the understanding around whether and how the system can be used effectively and efficiently for certain specific patient populations. Second, the study included simulated injection into a foam cushion rather than subcutaneous self-administration of the medicine. Thus, the results must be translated to actual clinical use with care. However, it should be noted that the method used in this study could be transferred to such environments and potentially create valuable insights.
5. Conclusions
The results show that eye-tracking could be used to effectively guide product development and improve product usability of a connected self-injection system. Usability indicators derived from eye-tracking data allowed the assessment of the evolution of three key dimensions of product usability: (i) participants’ ability to successfully execute a use step (product effectiveness), (ii) the duration required to complete given use step (product efficiency), and (iii) the patterns of how participants’ gaze hits areas of interests (product ease of use). Based on these indicators, the interplay between the connected system’s constituent parts and thus overall product performance could be significantly improved during two design iterations. The results illustrate how eye tracking holds great promise to improve the design and development process of medical devices beyond connected self-injection systems. Specifically, the digital transformation has the potential to radically transform the way users engage with healthcare technologies. It results in a series of software-enhanced multicomponent product systems used in both critical care and home-use environments that may require distribution of visual attention and thereby increase the cognitive workload of the users. Formative usability evaluation thus will increasingly focus on how to design and implement visual feedbacks in connected product systems. Cloud-platform integrated inhalers [e.g. Citation67], sensor-augmented smart insulin pump systems [e.g. Citation68] or mobile ECG measuring using smartphones and wearables for patient self-care [e.g. Citation69] all reflect such cases where digital features and physical artifacts become intertwined to realize advanced user interfaces. The importance of eye-tracking thus continues to grow as it augments the standard usability method toolbox to meaningfully guide the development of effective, efficient, and easy-to-use healthcare technologies.
Author contributions
A Schneider, C Jordi, and Q Lohmeyer conceived and planned the experiments. Q Lohmeyer carried out the experiments and analyzed the data. J Lange aided in interpreting the results. A Schneider, C Jordi, J Lange and Q Lohmeyer wrote the manuscript in consultation with M Meboldt.
Declaration of interest
A Schneider, C Jordi and J Lange are employed by Ypsomed AG. The authors have no other relevant affiliations or financial involvement with any organization or entity with a financial interest in or financial conflict with the subject matter or materials discussed in the manuscript apart from those disclosed.
Reviewer disclosures
Peer reviewers on this manuscript have no relevant financial or other relationships to disclose.
Acknowledgments
The authors express their gratitude to all participants of the eye-tracking study. Furthermore, we thank Daniela Hagmann for her valuable research assistance. We also thank Philipp Richard, Thomas Weinhold, and Ian Thompson for their feedback on earlier drafts of the document.
Additional information
Funding
References
- Limmroth V, Gerbershagen K. Single-use autoinjector for once-weekly intramuscular injection of IFNβ-1a. Expert Opin Drug Deliv. 2014;11(12):1969–1978.
- Weller I, Saake A, Schreiner T, et al. Patient satisfaction with the BETACONNECT™ autoinjector for interferon beta-1b. Patient Prefer Adherence. 2015;9:951–959.
- Brand-Schieber E, Munjal S, Kumar R, et al. Human factors validation study of 3 mg sumatriptan autoinjector, for migraine patients. Med Devices (Auckl). 2016;9:131–137.
- Paul C, Lacour JP, Tedremets L, et al. Efficacy, safety and usability of secukinumab administration by autoinjector/pen in psoriasis: a randomized, controlled trial (JUNCTURE). J Eur Acad Dermatol Venereol. 2015;29(6):1082–1090.
- Torjman MC, Machnicki R, Lessin J, et al. Evaluation of an investigational wearable injector in healthy human volunteers. Expert Opin Drug Deliv. 2017;14(1):7–13.
- Van Den Berghe G, Wouters P, Weekers F, et al. Intensive insulin therapy in critically Ill patients. N Eng J Med. 2001;345(19):1359–1367.
- Hirsch IB, Farkas-Hirsch R, Skyler JS. Intensive insulin therapy for treatment of type I diabetes. Diabetes Care. 1990;13(12):1265–1283.
- Zambanini A, Newson RB, Maisey M, et al. Injection related anxiety in insulin-treated diabetes. Diabetes Res Clin Pract. 1999;46(3):239–246.
- Graff MR, McClanahan MA. Assessment by patients with diabetes mellitus of two insulin pen delivery systems versus a vial and syringe. Clin Ther. 1998;20(3):486–496.
- Asakura T, Seino H, Nakano R, et al. A comparison of the handling and accuracy of syringe and vial versus prefilled insulin pen (FlexPen). Diabetes Technol Ther. 2009;11(10):657–661.
- Lteif AN, Schwenk WF. Accuracy of pen injectors versus insulin syringes in children with type 1 diabetes. Diabetes Care. 1999;22(1):137–140.
- Walters DP, Smith PA, Marteau TM, et al. Experience with NovoPen®, an injection device using cartridged insulin, for diabetic patients. Diabet Med. 1985;2(6):496–497.
- Klonoff D, Nayberg I, Thonius M, et al. Accuracy and injection force of the Gla-300 injection device compared with other commercialized disposable insulin pens. J Diabetes Sci Technol. 2015;10(1):125–130.
- Pfützner A. FlexPen for the delivery of insulin: accuracy, injection force and patient preference. Expert Rev Med Devices. 2009;6(2):115–123.
- Clarke A, Spollett G. Dose accuracy and injection force dynamics of a novel disposable insulin pen. Expert Opin Drug Deliv. 2007;4(2):165–174.
- Bailey T, Campos C. FlexTouch(R) for the delivery of insulin: technical attributes and perception among patients and healthcare professionals. Expert Rev Med Devices. 2012;9(3):209–217.
- Penfornis A. Performance of a new reusable insulin pen. Diabetes Technol Ther. 2011;13(3):373–379.
- Israël-Bultman H, Hyllested-Winge J, Kolaczynski M, et al. Comparison of preference for NovoPen(®) 4 with previous insulin pen treatments after 12 weeks in adult patients with type 1 and type 2 diabetes: a multicenter observational study. Clin Ther. 2011;33(3):346–357.
- Martin JM, Llewelyn JA, Ristic S, et al. Acceptability and safety of a new 3.0 ml re-usable insulin pen (HumaPen) in clinical use. Diabetes Nutr Metab. 1999;12(5):306–309.
- Ignaut DA, Schwartz SL, Sarwat S, et al. Comparative device assessments: humalog KwikPen compared with vial and syringe and FlexPen. Diabetes Educ. 2009;35(5):789–798.
- Barone DA, Singer BA, Merkov L, et al. Survey of US patients with multiple sclerosis: comparison of the new electronic interferon beta-1b autoinjector (BETACONNECT™) with mechanical autoinjectors. Neurol Ther. 2016;5(2):155–167.
- Bailey TS, Stone JY. A novel pen-based Bluetooth-enabled insulin delivery system with insulin dose tracking and advice. Expert Opin Drug Deliv. 2017;14(5):697–703.
- Årsand E, Muzny M, Bradway M, et al. Performance of the first combined smartwatch and smartphone diabetes diary application study. J Diabetes Sci Technol. 2015;9(3):556–563.
- Hanauer DA, Wentzell K, Laffel N, et al. Computerized automated reminder diabetes system (CARDS): e-mail and SMS cell phone text messaging reminders to support diabetes management. Diabetes Technol Ther. 2009;11(2):99–106.
- Schwartz FL, Guo A, Marling CR, et al. Analysis of use of an automated bolus calculator reduces fear of hypoglycemia and improves confidence in dosage accuracy in type 1 diabetes mellitus patients treated with multiple daily insulin injections. J Diabetes Sci Technol. 2012;6(1):150–152.
- Barnard K, Parkin C, Young A, et al. Use of an automated bolus calculator reduces fear of hypoglycemia and improves confidence in dosage accuracy in patients with type 1 diabetes mellitus treated with multiple daily insulin injections. J Diabetes Sci Technol. 2012;6(1):144–149.
- Rodbard D. Continuous glucose monitoring: a review of successes, challenges, and opportunities. Diabetes Technol Ther. 2016;18(Suppl 2):S3–S13.
- Rodbard D. Continuous glucose monitoring: a review of recent studies demonstrating improved glycemic outcomes. Diabetes Technol Ther. 2017;19(S3):S25–S37.
- Vadlapatla R, Wong EY, Gayakwad SG. Electronic drug delivery systems: an overview. J Drug Delivery Sci Technol. 2017;41:359–366.
- Roth EM, Bujas-Bobanovic M, Louie MJ, et al. Patient and physician perspectives on mode of administration of the PCSK9 monoclonal antibody alirocumab, an injectable medication to lower LDL-C levels. Clin Ther. 2015;37(9):1945–1954.e6.
- Burmester GR, Rubbert-Roth A, Cantagrel A, et al. A randomised, double-blind, parallel-group study of the safety and efficacy of subcutaneous tocilizumab versus intravenous tocilizumab in combination with traditional disease-modifying antirheumatic drugs in patients with moderate to severe rheumatoid arthritis (SUMMACTA study). Ann Rheum Dis. 2014;73(1):69–74.
- Lange J, Richard P, Bradley N. Usability of a new disposable autoinjector platform device: results of a formative study conducted with a broad user population. Med Devices (Auckl). 2015;8:255–264.
- Schiff M, Koo J, Jin E, et al. Usability and acceptability of the abatacept pre-filled autoinjector for the subcutaneous treatment of rheumatoid arthritis. Adv Ther. 2016;33(2):199–213.
- Schneider AE, Lange J. Pen devices for self-injection: contrasting measured injection force with users’ perceived ease of injection. Expert Opin Drug Deliv. 2018 Feb;15(2):115–125. doi:10.1080/17425247.2018.1415884.
- Shogbon AO, Ngo D, Jacob B, et al. Nurses’ perceptions and satisfaction with the use of insulin pen devices compared with insulin vial and syringes in an inpatient setting. Diabetes Technol Ther. 2014;16(11):742–746.
- Thakur K, Biberger A, Handrich A, et al. Patient perceptions and preferences of two etanercept autoinjectors for rheumatoid arthritis: findings from a patient survey in Europe. Rheumatol Ther. 2016;3(2):245–256.
- Guo X, Sommavilla B, Vanterpool G, et al. Evaluation of a new durable insulin pen with memory function among people with diabetes and healthcare professionals. Expert Opin Drug Deliv. 2012;9(4):355–356.
- Klonoff D, Nayberg I, Erbstein F, et al. Usability of the Gla-300 injection device compared with three other commercialized disposable insulin pens: results of an Interview-based survey. J Diabetes Sci Technol. 2015;9(4):936–938.
- Haak T, Edelman S, Walter C, et al. Comparison of usability and patient preference for the new disposable insulin device Solostar versus Flexpen, lilly disposable pen, and a prototype pen: an open-label study. Clin Ther. 2007;29(4):650–660.
- Böhler S, Landgraf W, Schreiber SA. [Evaluation of a new disposable insulin pen and injection habits of diabetes patients in everyday clinical practice]. MMW Fortschr Med. 2010;151(Suppl 4):179–187.
- Ramadan WH, Khreis NA, Kabbara WK. Simplicity, safety, and acceptability of insulin pen use versus the conventional vial/syringe device in patients with type 1 and type 2 diabetes mellitus in Lebanon. Patient Prefer Adherence. 2015;9:517–528.
- Antinori-Lent KJ. Analysis of comparison of patient preference for two insulin injection pen devices in relation to patient dexterity skills. J Diabetes Sci Technol. 2012;6(4):917–920.
- Siegmund T, Blankenfeld H, Schumm-Draeger PM. Comparison of usability and patient preference for insulin pen needles produced with different production techniques: “thin-wall” needles compared to “regular-wall” needles: an open-label study. Diabetes Technol Ther. 2009;11(8):523–528.
- Klausmann G, Hramiak I, Qvist M, et al. Evaluation of preference for a novel durable insulin pen with memory function among patients with diabetes and health care professionals. Patient Prefer Adherence. 2013;7:285–292.
- Polanyi M. The tacit dimension. New York: Doubleday & Company Inc.; 1966.
- Nonaka I. A dynamic theory of organizational knowledge creation. Organ Sci. 1994;5(1):14–37.
- Duchowski AT. Eye tracking methodology. London: Springer; 2017.
- Asan O, Yang Y. Use eye trackers for usability evaluation of health information technology: a systematic literature review. JMIR Hum Factors. 2015;2(1):e5.
- Mussgnug M, Singer D, Lohmeyer Q, et al. Automated interpretation of eye-hand coordination in mobile eye tracking recordings. Künstl Intell. 2017;31(4):331–337.
- Rayner K. Eye movements in reading and information processing: 20 years of research. Psychol Bull. 1998;124(3):372–422.
- König P, Wilming N, Kietzmann TC, et al. Eye movements as a window to cognitive processes. J Eye Movement Res. 2016;9(5):3,1–16.
- Duchowski AT. A breadth-first survey of eye-tracking applications. Behav Res Meth Ins C. 2002;34(4):455–470.
- Bojko A. Eye tracking the user experience: a practical guide to research. Brooklyn, New York: Rosenfeld Media; 2013.
- Dehoratius RJ, Brent LH, Curtis JR, et al. Satisfaction with subcutaneous golimumab and its auto-injector among rheumatoid arthritis patients with inadequate response to adalimumab or etanercept. Patient. 2018;11(3):361–369.
- Hudry C, Lebrun A, Bertrand M, et al. Evaluation of usability and acceptance of a new autoinjector intended for methotrexate subcutaneous self-administration in the management of rheumatoid arthritis. Rheumatol Ther. 2017;4(1):183–194.
- Kivitz A, Segurado OG. HUMIRA® Pen: a novel autoinjection device for subcutaneous injection of the fully human monoclonal antibody adalimumab. Expert Rev Med Devices. 2007;4(2):109–116.
- Callis Duffin K, Bagel J, Bukhalo M, et al. Phase 3, open‐label, randomized study of the pharmacokinetics, efficacy and safety of ixekizumab following subcutaneous administration using a prefilled syringe or an autoinjector in patients with moderate‐to‐severe plaque psoriasis (UNCOVER‐A). J Eur Acad Dermatol Venereol. 2017;31:107–113.
- Matfin G, Van Brunt K, Zimmermann AG, et al. Safe and effective use of the once weekly dulaglutide single-dose pen in injection-naïve patients with type 2 diabetes. J Diabetes Sci Technol. 2015;9(5):1071–1079.
- Andre AD, Brand-Schieber E, Ramirez M, et al. Subcutaneous sumatriptan delivery devices: comparative ease of use and preference among migraineurs. Patient Prefer Adherence. 2017;11:121–129.
- Pfützner A, Forst T, Niemeyer M, et al. Assessment for ease of use and preference of a new prefilled insulin pen (FlexTouch Degludec U100/U200) versus the SoloSTAR insulin pen by patients with diabetes and healthcare professionals. Expert Opin Drug Deliv. 2014;11(9):1381–1389.
- Pfützner A, Schipper C, Niemeyer M, et al. Comparison of patient preference for two insulin injection pen devices in relation to patient dexterity skills. J Diabetes Sci Technol. 2012;6(4):910–916.
- Ahmann A, Szeinbach SL, Gill J, et al. Comparing patient preferences and healthcare provider recommendations with the pen versus vial-and-syringe insulin delivery in patients with type 2 diabetes. Diabetes Technol Ther. 2014;16(2):76–83.
- Lim WH, Chan D, Boudville N, et al. Patients’ perceptions of subcutaneous delivery of darbepoetin alfa by autoinjector prefilled pen versus prefilled syringe: a randomized, crossover study. Clin Ther. 2012;34(9):1948–1953.
- Mussgnug M, Waldern MF, Meboldt M, et al. Mobile eye tracking in usability testing: designers analysing the user-product interaction. In: Weber, editor. The 20th International Conference on Engineering Design (ICED15). Glasgow: The Design Society; 2015. p. 349–358.
- Holmqvist K, Andra C, Lindström P, et al. A method for quantifying focused versus overview behavior in AOI sequences. Behav Res. 2011;43:987–998.
- Jacob RJK, Karn KS. Eye tracking in human-computer interaction and usability research: ready to deliver promises. In: Radach R, Hyona J, Deubel H, editors. The mind’s eye: cognitive and applied aspects of eye movement research. Amsterdam: Elsevier; 2003. p. 573–605.
- Merchant RK, Inamdar R, Quade RC. Effectiveness of population health management using the propeller health asthma platform: a randomized clinical trial. J Allergy Clin Immunol Pract. 2016;4(3):455–463.
- Danne T, Kordonouri O, Holder M, et al. Prevention of hypoglycemia by using low glucose suspend function in sensor-augmented pump therapy. Diabetes Technol Ther. 2011;13(11):1129–1134.
- Cheung CC, Krahn AD, Andrade JG. The emerging role of wearable technologies in detection of arrhythmia. Can J Cardiol. 2018;34(8):1083–1087.