
ABSTRACT
Objectives
Many current subcutaneous (SC) biologic therapies may require >1 mL volume or have increased viscosity, necessitating new delivery system approaches. This study evaluated 2-mL large-volume autoinjector (LVAI) delivery performance across varying solution viscosities and design inputs to assess the design space and identify configurations that produce practical injection times.
Methods
Investigational LVAI delivery duration and volume, depot location, and tissue effects were examined in both air and in vivo models across various pre-filled syringe (PFS) cannula types (27 G Ultra-thin wall [UTW], 27 G special thin wall [STW], or 29 G thin-wall [TW]), drive spring forces (SFLOW or SFHIGH), and Newtonian solutions (2.3–50 centipoise [cP]).
Results
Within each design configuration, increasing PFS internal diameters and spring forces reduced delivery times, while increasing viscosity increased times. The 27 G UTW PFS/SFHIGH combination achieved shorter delivery times across all injection conditions, with 2 mL in vivo durations <15 seconds at ≤31 cP and routinely <20 seconds at 39 and 51 cP, with nominal and transitory tissue effects.
Conclusion
PFS cannula and spring force combinations can be tailored to achieve various injection durations across viscosities, while UTW PFS enables faster rates to potentially better accommodate human factors during LVAI injection, especially at high viscosity.
1. Introduction
Parenteral biotherapies have been developed to treat a wide variety of diseases such as cancer, diabetes, and various autoimmune diseases [Citation1] (e.g. multiple sclerosis, rheumatoid arthritis, psoriatic arthritis). Subcutaneous (SC) injections can offer numerous advantages over IV infusion for biologics, including rapid delivery, fewer infusion-related reactions, greater patient treatment satisfaction with reduced pain and discomfort, and the opportunity for at-home delivery/self-administration [Citation2–7]. SC injections have also shown non-inferiority to IV administration in terms of efficacy, safety, and/or pharmacokinetics (PK) for some biologics [Citation8–13]. It is anticipated that longer life expectancies will drive a proportional increase of patients with chronic conditions, and biotherapies will continue to expand as first-line treatment options for such conditions. These factors highlight the importance for adjunctive technology developments to reduce treatment burden and cost for both patients and healthcare institutions [Citation14]. Advancing self-administered combination products such as large-volume SC delivery provides an avenue to address both current and future chronic care needs.
Autoinjectors (AI) utilizing pre-filled syringe (PFS) primary drug containers are widely accepted for SC delivery, with a variety of devices already in commercial use and more under development [Citation14,Citation15] for biotherapy applications. AI devices address several SC delivery challenges, including improved patient adherence to prescribed treatment regimens compared to syringe delivery methods [Citation16,Citation17], which suggests that AI use could improve therapeutic outcomes in some patients.
Because SC delivery of biologics may require higher mass doses to achieve their intended pharmacological effects, these formulations are often characterized by higher viscosities due to more concentrated solutions and/or higher injectate volumes when concentration is not possible or preferred [Citation14]. Although high viscosity, large-volume SC injections are reported to be well tolerated [Citation18–21], and pain perception has been reported not to be affected by injection speed [Citation22,Citation23], either situation may present unique design challenges for AI device development. SC delivery of high viscosity formulations is associated with higher fluid path injection pressure and time requirements. Similarly, higher dosing volumes are associated with higher interstitial pressures at the injection site [Citation24–27] contributing to increased injection duration. ‘Insufficient injection duration’ errors resulting in incomplete dosages or injectate leakage remain one of the most reported errors associated with hand-held AI and pen injector platforms [Citation28]. Extended delivery and hold time requirements may be addressable with user training, and longer duration injections were found acceptable during human factors testing [Citation29]. However, a general guideline of 15–20 seconds maximum injection duration has been historically promulgated for maximizing ease-of-use and AI effectiveness, and is reflected in many current AI instructions for use (IFU, ). AI IFUs vary regarding injection time recommendations with some reporting a single total expected injection time, while others include an additional post-injection hold time which may contribute to the overall injection duration period. Regardless, minimizing overall required AI injection durations including hold times while expanding the range of usable solution viscosities may be beneficial for maintaining the compliance benefits associated with AI use and maximizing AI utility for developing biotherapies.
Table 1. Approved drugs in autoinjection devices: indication, manufacturer, volumes, and injection times.
Reducing AI injection duration for high viscosity biotherapeutics may be accomplished by modifying critical system components that regulate delivery rate, such as cannula inner diameter, cannula length, and drive spring force. The combined effect of these components is known to affect injection forces and delivery duration, especially of viscous injectates [Citation30,Citation31]. Our previous studies have shown that the feasibility of rapid high-volume, high viscosity (2.3 to 30 centipoise [cP]) SC injections in vivo with a prototype large-volume AI (LVAI) device using 2 PFS cannula types – an investigational ultra-thin wall (UTW) cannula and a commercial special thin wall (STW) cannula – with minimal tissue effects [Citation32]. The present study expands on that work, empirically exploring AI injection times by varying combinations of key design parameters such as drive spring and PFS cannula type, across solution viscosities, and including the impact of in vivo SC tissue injection with assessment of the resultant injection site effects through preclinical testing simulating clinical use conditions.
2. Methods
2.1. LVAI device platform and solutions for injection
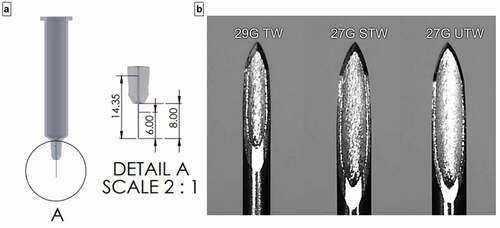
An early design embodiment of an investigational single-use push-on-skin 2-mL LVAI device (Becton Dickinson [BD], Pont-de-Claix, France; investigational device not for sale) was utilized to examine the system performance using different PFS cannula types and drive spring force combinations. With the exception of springs, internal device and housing components were produced using pilot scale injection molding and constructed into upper and lower sub-assemblies. LVAI devices were manually assembled with filled PFS components and weighed for subsequent gravimetric dose determination. LVAI device components included cap removal to disengage PFS needle shield, viewing window to monitor plunger displacement, and automatic needle shielding post-delivery. In this study, LVAI delivery performance was assessed both in air and in vivo for three 2.25 mL PFS (BD Neopak™, Pont-de-Claix, France) cannula types each with 8-mm external cannula length, 14.4-mm total cannula length with FluroTec® stoppers: a 27 G investigational Ultra-Thin Wall (UTW), a commercial 27 G special thin wall (STW), and an investigational 29 G Thin-Wall (TW) cannula; and 2 drive spring forces: SFLOW (23 N) <SFHIGH (39 N). The UTW cannula cross-sectional lumen area is approximately 30% greater than the STW cannula. All LVAI configurations targeted 6.0-mm needle penetration depth (i.e. needle extension beyond the LVAI body) post-activation (), the target depth previously optimized for 2-mL SC deposition [Citation32].
Figure 1. (a) PFS needle dimensions- overall length 14.4 mm, exposed length 8 mm, target extension length/tissue insertion depth 6.0 mm. (b) Microscopic images (95X) of 29 G TW, 27 G STW, and 27 G UTW PFS cannula. G = gauge; PFS = prefilled syringe; TW = thin wall; STW = special thin wall; UTW = ultra-thin wall.
Commercial radiographic contrast media without formulation modification were used to investigate lower range viscosity solutions at nominal viscosities of 2.3 cP, 5.8 cP, 11.8 cP, and 20.4 cP at 20°C (Omnipaque™ 140 mg, 240 mg, 300 mg, and 350 mg iodine/mL, respectively; GE Healthcare, Oslo, Norway). Custom contrast injection solutions were formulated to examine higher injectate viscosities (30 cP, 40 cP, and 50 cP) using iohexol contrast (reagent grade, Sigma-Aldrich Histodenz™) with dextran (Dextran 40 MW 40,000, pharmaceutical grade, Pharmacosmos, Holbaek, Denmark) as a viscosity modifier. Rheological characterization of solution viscosity across shear rates was completed by Brookfield LVDV III+ rheometer (AMATEK Brookfield, Middleborough, MA, USA) at 20°C using a CPE-40 spindle; actual measured viscosities reported (). Solution density measurements were completed using a DMA 4500 M densitometer (Anton Paar, Graz, Austria) at 20°C. Syringes were manually filled with 2.0-mL contrast solution by positive displacement pipette, vacuum stoppered, and evaluated using a visual gauge to confirm a ± 5% fill accuracy.
Table 2. Delivery time (seconds) into air and in vivo swine tissue (mean ± SD; n value) for LVAI devices and placebo combinations at varying PFS internal cannula dimension, formulation viscosity, and LVAI spring force.
2.2. Study design and procedures
A fractional design of experiments (DOE) design was employed to evaluate the impact of critical LVAI system components (PFS, spring force) on delivery performance endpoints, both in air and in vivo, across the range of solution viscosities, 2.3 to 50 cP (). Experimental endpoints included injection performance (device function, delivery success, delivered volume, delivery time), depot location and injection site effects (wheal/edema, erythema, leakage) including resolution post-injection.
For in vivo studies, the LVAI devices were tested on the flanks of 30 to 40 kg anesthetized female Yorkshire swine as previously described [Citation32]. Swine exhibit dermal and SC tissue morphological and compositional similarities to humans [Citation33], providing a reasonable translational correlation for in vivo injection device assessment at clinically relevant delivery rates and volumes. All preclinical procedures and animal care were performed under an approved Institutional Animal Care and Use Committee (IACUC) protocol in accordance with National Research Council standards of care and ethics in an AALAC (Association for Assessment and Accreditation of Laboratory Animal Care) accredited facility.
2.2.1. Benchtop delivery characterization
Prior to in vivo testing, six LVAI device configurations were tested to examine delivery performance (delivery time and delivered volume) against atmosphere across solutions of varying viscosity (2.3 to 50 cP). Fluid delivery from activated devices was captured and measured using a balance with integrated real-time data acquisition of weight and time. A custom MATLAB® script interrogated the weight versus time profiles to identify delivery start and end times, and calculated injection duration, and therefore do not reflect any additional post-injection hold time. The final accumulated weight from the delivery was utilized to calculate delivered volume using the solution density [delivery volume (mL) = mass/placebo density].
2.2.2. In vivo delivery characterization
In vivo system performance assessments were first evaluated on a subset of device configurations at selected min/max viscosity levels to explore the anticipated max/min boundary conditions of delivery time within the DOE design space. LVAI performance was subsequently characterized at all intermediate viscosity levels to generate the comprehensive in vivo data set across LVAI PFS and drive spring force configurations, with all data pooled for analysis.
Swine were anesthetized, placed under a C-arm fluoroscope (Glenbrook Technologies LabScope™, Randolph, NJ, USA), and positioned to enable device insertion perpendicular (90°) to the skin surface and the fluoroscope beam path. Prior to administration, a standardized array of 6 injection sites were identified and numbered from anterior to posterior on the flank of the animal, and dermal thickness at the targeted injection sites measured using fluoroscopy. For each procedure, manual activation of a LVAI (90° push-on-skin activation without skin pinch) was performed to administer 2 mL of contrast agent to the flank. Photographs or 3D-scans of injection sites were taken at baseline prior to injection and immediately post-injection (T-0); photographs and scans were for reference and/or exploratory wheal-dimensional analysis only and not used for post-hoc score grading. Replicates of each device configuration were equally distributed across all injection site locations.
The time of infusate delivery was determined with a stopwatch while monitoring PFS stopper translation within the viewing window of the LVAI device. Calculation of delivered volume was completed gravimetrically using the mass difference between LVAI system pre- and post-delivery and solution density. Videos during delivery were also obtained to enable exploration of video analysis of stopper translation measurements as alternative means to capture delivery time and measure delivered volume. LVAI devices were held against the injection site for an additional standardized 3 seconds post-delivery, removed, and inspected for leakage from tissue. For consistency and injection time comparison versus bench testing, reported in vivo delivery times do not include post-injection hold time. Measurable observed leakage was collected with absorbent sponges and subsequently quantified by gravimetric analysis [Citation34]. Visible leakage below the lower level of accurate quantification (~10 µl) by gravimetric analysis was recorded as an independent classification.
A numerical grading scale [Citation35] utilized in prior swine [Citation32,Citation36] and human delivery studies [Citation20,Citation21] was employed to score injection-induced erythema and edema (wheal) site effects at T-0, T-1 hour T-2 hours, and T-4 hours while the animal was under anesthesia. Once injection site tissue effects resolved that site was not scored at future time points. If site effects did not resolve by T-4 hours, an additional observation was completed at T ~ 24 hours while the animal was ambulatory. The occurrence rate for scores in each category was analyzed across device configurations and injectate viscosities at these time points.
Immediately following T-0 external injection site tissue assessments, a 2D image of the fluoroscopically opaque depot was acquired to assess tissue localization (intradermal [ID], subcutaneous, or intramuscular [IM]), including measurements of dermal thickness and both upper (closest to the skin surface) and lower (farthest from the skin surface) depot margin in situ position. Measurements were made in a straight line roughly perpendicular to the skin surface from the upper depot margin’s closest proximity to the skin surface. Images were calibrated against a 1.0-mm graduated radiopaque scale placed within the field of view, with 2D fluoroscope measurements having an accuracy of ±0.1 mm although animal repositioning during scanning may have contributed to higher variance.
2.3. Statistical analyses
Combinations of device configurations and viscosities were compared for all endpoints. Multiple comparisons were made between device configuration within viscosity and between viscosity within device configuration using a contrast method, with linear mixed effect models for elapsed time of delivery, depot location, and dermal thickness change following the injection (pre – post), as applicable. Significance of effects (p < 0.05) was determined using Analysis of Variance (ANOVA) tables based on the linear mixed effect models. Injection site tissue effects (erythema and edema [wheal] scores reformatted as binary variable with scores larger than 0 considered notable erythema or edema, respectively) and leakage between device and skin were assessed using categorical analysis methods described by [Citation37] with Bonferroni adjustment for multiple comparisons.
3. Results
3.1. Delivery time
3.1.1. Benchtop (In Air)
Six LVAI device configurations were tested with 2.3 to 50 cP placebo formulations: n = 5–8/configuration, N = 178 (). All tested LVAI configurations functioned properly and delivered injectate; within each configuration, an apparent linear relationship of increasing delivery time with increasing viscosity was observed (). Both device configuration and viscosity had statistically significant effects on delivery time (p < 0.001). Predictably, within PFS type the higher spring force (SFHigh) enabled shorter delivery times compared to lower spring forces (SFLow) at equivalent viscosity. The 27 G UTW PFS, with largest internal diameter paired with drive spring SFHigh achieved delivery times <15 seconds for all tested solutions up to viscosity of 51 cP. The 27 G STW PFS with SFHigh configuration produced similar results, with <15 second delivery up to 39 cP.
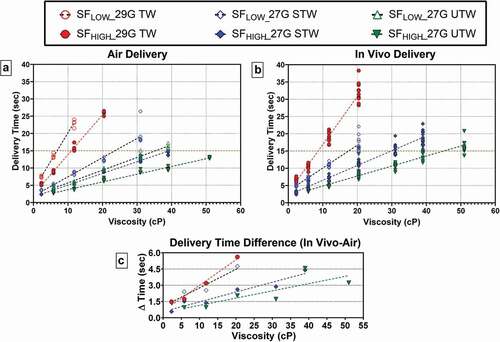
Figure 2. Delivery time as a function of LVAI device PFS/Spring Force combination and viscosity for both (a) injection in air, n = 5–8 per configuration and (b) in vivo injection, n = 10–17 per configuration. Within each PFS/Spring Force, delivery time increased with increasing viscosity. Dotted red line represents nominal 15-second injection duration. (c) Differences in mean injection times (?T) between in vivo and air delivery for paired configurations (?T = MeanTinvivo- MeanTair). G = gauge; PFS = prefilled syringe; SFLOW = Low Spring Force; SFHIGH = High Spring Force; TW = thin wall; STW = special thin wall; UTW = ultra-thin wall. In air delivery times were extracted from gravimetric weight vs time curves. To allow direct comparison, presented in vivo delivery times do not include the additional standardized 3 second hold time post-injection completion.
3.1.2. In vivo
The comprehensive in air delivery results informed the expected spectrum of injection duration performance, from which four LVAI device configurations (29 G TW, SFHigh; 27 G STW, SFLow; 27 G STW, SFHigh; and 27 G UTW, SFHigh) spanning the in vitro range were selected for further in vivo characterization. In total, 248 injections (n = 10–17/configuration) were completed over a multi-week period on Yorkshire swine (n = 15). Of these, 246 injections were available for analysis; n = 2 were excluded (all endpoints) due to incomplete cannula insertion during use.
A positive correlation between delivery time and injectate viscosity ()) similar to in air delivery was observed within each LVAI configuration. Increased drive spring force in combination with larger PFS inner diameters reduced delivery times at equivalent viscosities (SFHigh <SFLow; 27 G UTW <27 G STW <29 G TW), while increasing viscosity levels increased delivery time within each configuration. Each LVAI configuration achieved in vivo delivery within 15 seconds at multiple viscosity levels; at 39 cP and 51 cP, 100% and 93% of deliveries were <20 seconds using 27 G UTW cannula.
ANOVA analysis indicated viscosity, device configuration, and their interaction were significant factors for delivery time (p < 0.001). Significant differences between viscosity levels within device configuration were observed for all except four comparisons (SFHigh −27 G STW: 2.3 cP versus 5.8 cP, 5.8 cP versus 11.8 cP; SFHigh −27 G UTW: 5.8 cP versus 11.8 cP, 39 cP versus 51 cP), which was attributed to the relative similarity of the delivery times (<2 seconds mean difference) at lower viscosity levels, and the higher delivery time variation (standard deviation >2 seconds) at 39 cP viscosity (Supplemental Table S1). Significant differences between device configurations within viscosity were observed for all except two comparisons: SFHigh 29 G TW versus SFLow 27 G TW at 2.3 cP and SFHigh 27 G STW versus SFHigh 27 G UTW at 5.8 cP (Supplemental Table S2). As both drive spring force and PFS fluid path geometry regulate flow instances of similar delivery durations generated by different LVAI configurations within viscosity were anticipated.
3.1.3. In air/In vivo delivery time comparison
Paired delivery time data from delivery into atmosphere and in vivo and were compared to evaluate the contribution of tissue to overall delivery time. For each LVAI configuration, in vivo delivery durations were higher than air deliveries within each viscosity level, with an observed positive correlation between mean difference in delivery time and viscosity (). Delivery time variation was larger in vivo than in air deliveries, and delivery time variability typically increased with higher injectate viscosities (, Supplemental Figure S1).
3.2. Delivered volume and injectate leakage
3.2.1. Benchtop (In Air)
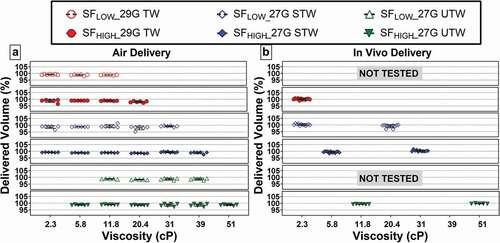
The delivered volume for in air deliveries across all LVAI device configurations was within ±5% (1.90–2.10 mL) of the target 2-mL fill volume (). ANOVA indicated a statistically significant effect of viscosity on delivered volume (p < 0.001), whereas device configuration and viscosity/device interaction were not significant. Subsequent contrast-based multiple comparison tests were performed, which demonstrated a statistically significant lower delivered volume in the 20.4 cP group compared to the 2.3, 5.8, 11.8, 31, and 39 cP groups. Despite this statistically significant difference, it is not considered as a clinically relevant difference as mean differences between groups (0.01 mL) were well within the ±0.10 mL fill variation limits and all delivered volume measurements were within the identified, acceptable range of 2 mL ±5% target volume.
Figure 3. % Delivery volume for (a) injection in air, and (b) in vivo as a function of the nominal 2.0-mL target fill volume. G = gauge; SFLOW = Low Spring Force; SFHIGH = High Spring Force; TW = thin wall; STW = special thin wall; UTW = ultra-thin wall.
3.2.2. In vivo
Delivered volume for the initial tested device configuration subset were also within 2 mL ±5% target volume (). For the remainder of in vivo-tested devices, gravimetrically measured delivered volume is not reported due to random undetectable errors during pre-/post-LVAI weight measurements originating from transient electrostatic charge buildup on balance electronics. Because all PFS fills were verified within 2 ml ±5% fill by visual fill gauge inspection prior to use, full dose delivery was deduced based on visually observed complete stopper movement from start to end positions in captured videos and lack of quantifiable injection site leakage for any 2-mL LVAI delivery across tested configurations and viscosities. In 15% of deliveries, a fluid sheen on the skin surface at the injection site was observed, but was judged to be below a 10 µL level of quantification based on historical data from similar studies.
3.3. In vivo deposition location
In situ depot location metrics were determined via fluoroscopic imaging (). The majority (99.6%) of 2-mL depositions were exclusively in the SC tissue space; one delivery (SFHigh 27 G STW, 5 cP) with predominantly SC deposition had a minute amount of observable ID injectate, potentially within the insertion track (Supplemental Figure S2). This injection was not associated with shallow SC delivery per top of deposition measurements () nor quantifiable leakage.
Figure 4. (a) Representative fluoroscopic images of 2-mL depositions in tissue at all tested solution viscosities. Under fluoroscopy the skin appears as light gray contrast with the air above (white) and the slightly darker gray subcutaneous tissue boundary below. All contrast media injection depots (black) appear as dark oblate spheroids within the SC space with observable top and bottom margins. The interface between the dermal and subcutaneous space is also evident in the images, typically found less than 3 mm from the surface of the skin. A radiopaque scale used for distance measurement calibration is shown in top-middle panel. (b) Scatter plot of individual depth measurements from the surface of the skin to the top and bottom of deposition by PFS and viscosity. Areas enclosed by colored boxes represent top of depot measurements. Arrow indicates device in which ID injectate was observed. Pink line represents pre-injection dermal thickness measurements (2.4 ± 0.19 mm; Mean ± SD) pooled across all injections. G = gauge; SFLOW = Low Spring Force; SFHIGH = High Spring Force; PFS = pre-filled syringe; TW = thin wall; STW = special thin wall; UTW = ultra-thin wall.
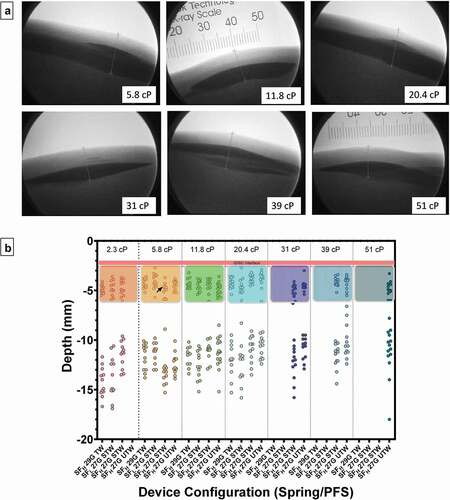
ANOVA indicated viscosity as a statistically significant factor for distance between skin surface to top of deposition (p = 0.005), and similarly viscosity (p = 0.045) and device/viscosity interaction (p < 0.001) as statistically significant for distance to the bottom of deposition. Despite this apparent statistical significance, viscosity impact on depot location is likely negligible in this case as only a single instance of statistical significance for either depot top and bottom location were identified from contrast multiple comparisons between viscosity levels within LVAI configuration or between LVAI device configurations within viscosity levels, respectively, (Supplemental Tables S3–5).
3.4. Injection site effects-dermal thickness
Dermal thickness was measured via 2-D fluoroscopy before and immediately after the injections and the difference calculated. Dermal thickness did not have appreciable changes due to 2-mL LVAI SC deliveries. The change in dermal thickness across LVAI device configurations was ±0.5 mm, which is within the estimated measurement error. Neither LVAI device configuration nor viscosity had a statistically significant effect on changes in dermal thickness.
3.5. Tissue response relative to viscosity and PFS configuration
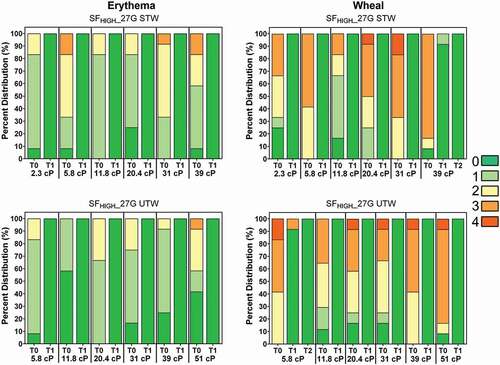
Injection-induced erythema (redness) and edema (wheal) were each recorded immediately following injection using the Organization for Economic Co-operation and Development (OECD) grading scale (0 = none; 1 = slight, 2 = well-defined, 3 = moderate, 4 = severe) at T-0, T-1 hour, T-2 hours, and T-4 hours while the animal was under anesthesia (, Supplemental Figure S3). Erythema resolved quickly post-injection with 100% of injections lacking observable erythema at T = 1 hour. Wheal observations also resolved quickly post-injection: at T = 1 hour, 95.5% of injections lacked observable wheals (score = 0) and 99.6% had resolved to scores ≤1. No statistically significant differences were observed for any difference of proportion comparisons for non-zero erythema (at T0) or wheal (at T0 and T = 1 hour) per LVAI configuration and viscosity.
Figure 5. Observed erythema (left) and wheal (right) scores (0–4) by viscosity over time expressed as a percentage of total injections for LVAI SFHIGH 27 G STW (top) and UTW (bottom) device configurations immediately after injection (T0) and through resolution. Regardless of injection test condition, all erythema resolved to non-detectable levels (Score = 0; dark green) by T-60 minutes (T1) post-injection; all wheal scores resolved within 2 hours (T2) post injection. Erythema and wheal scores for other injection conditions are included in Supplemental Figure S3. G = gauge; SFLOW = Low Spring Force; SFHIGH = High Spring Force; TW = thin wall; STW = special thin wall; UTW = ultra-thin wall.
4. Discussion
A recent human factors study [Citation29] showed feasibility that users and caregivers were physically capable of applying sufficient injection force to manage extended LVAI hold times up to approximately 30 seconds for 2-mL injections with limited errors. However, limitations of the study included conduct of injections under supervised conditions into a foam media rather than at-home self-injection, and without injection duration acceptability or preference data reported. Conversely, several other published studies demonstrate that extended hold time may increase the probability of failure modes such as inaccurate dosing due to early removal, decreased therapy adherence, or pose additional self-administration challenges for those with dexterity issues [Citation28]. Other prior studies suggest tolerability for rapid injection is greater than previously thought [Citation18,Citation22,Citation23]. Therefore, adjusting key AI device parameters to speed flow rates and shortening delivery times may enable successful SC deliveries for higher volume and viscosity injectates, addressing a key ease-of-use consideration for clinical utility. Similarly, the majority of AI devices in use still recommend injection duration of <15 seconds, for injectate volumes ranging from 0.3 to 2.25 mL (), indicating that while longer injection durations may be feasible, current clinical practice remains minimization of total injection times.
Dimensional influences of needle inner diameter, needle length, and syringe diameter on flow are well documented in literature as defined by Hagen–Poiseuille law [Citation38–40]. The empirical results presented in this study show that as expected per Hagen–Poiseuille, a higher LVAI spring force provides shortened delivery times compared to the lower spring force within PFS at equivalent viscosity levels. Likewise, configurations with a greater PFS cannula internal diameter elicited shortened delivery times compared to a higher gauge/smaller internal diameter cannula (27 G UTW <27 G STW <29 G TW). Multiple LVAI configurations achieved in vivo delivery within the 15 second injection time currently common in clinical use (). Moreover, at the highest viscosity levels tested, 100% and 93% of deliveries were <20 seconds using the 27 G UTW cannula at 39 cP and 51 cP, respectively. Because user hold time remains a major source of injection failure and errors [Citation28], minimizing current delivery times is an appropriate first step for SC injection optimization. Establishing whether longer hold times are feasible and patient acceptable in routine non-clinical environments will be essential to inform optimal LVAI system performance and design input criteria.
Primary container and needle dimensions, system frictional forces, injectate rheology, and target tissue space properties influence injection mechanics and delivery time [Citation38,Citation39,Citation41]. Changes in SC interstitial fluid hydrostatic pressure, governed by interstitial volume and extracellular matrix elasticity [Citation24–27], can occur due to the injected fluid volume. To assess contribution of tissue resistive forces on overall SC 2-mL administration time, comparisons were conducted between reference measurements in air and in vivo deliveries. Injection into tissue extended injection times for all tested configurations with respect to in vitro durations, with absolute increases in magnitude commensurate with increasing viscosity; relative injection timing increased 20–45% from mean in vitro atmospheric injection durations. At the maximum viscosity level tested (51 cP), use of the SFHIGH 27 G UTW configuration produced a mean in vivo delivery time just over 15 seconds. These results suggest that in clinical practice, 2-mL self-administration of high viscosity solutions within currently utilized timeframes is feasible even for high viscosity solutions.
A critical performance parameter for all parenteral injection devices is consistent delivery to the target tissue space, as delivery into different tissue beds is known to affect pharmacokinetic profiles. Inadvertent injections into the IM space are generally associated with increased pain [Citation42,Citation43], alteration of formulation onset of action, peak concentration, and duration of action [Citation42,Citation44]. Alternatively, shallow SC injections may increase potential for site leakage and generation of more prominent and longer lasting injection site effects (erythema/wheal) [Citation32,Citation45]. Several factors are determinants of needle penetration depth and subsequent deposition location, needle extension length being the primary. In our prior studies [Citation32], the impact of AI needle extension length was investigated with 6-mm needle extension length selection to affect a balance between calculated IM risk potential and increased injection site reactions. Additionally, injection site selection, device/tissue interface geometry, and distribution of applied force to the injection site, should be considered to minimize underlying tissue compression and inadvertent IM injections [Citation46]. In this study, in vivo injections consistently produced well-defined depots within the subcutaneous space independent of delivery rate and fluid viscosity. Fluoroscopic assessment of depots indicated no significant differences between configurations for top of depot depth measurements. Instances of bottom depot depth measurement differences between device configurations may be attributable to slight variations in SC tissue structure producing non-homogeneous depot dispersion/spreading.
The injection device interface, depot location, and mechanical changes in skin properties in combination with physio-chemical properties of the formulation [Citation42,Citation47,Citation48] all contribute to the magnitude of observed injection site effects. SC delivery also produces localized interstitial pressure increases [Citation15], and the delivered volume may impart local tissue distension to the extracellular matrix [Citation24,Citation36]. Rapid reduction and resolution of local tissue effects were observed with no significant differences between device configurations or viscosity. These results suggest that increased 2-mL delivery rates and higher viscosity administrations achieved using UTW cannula did not increase ID/IM risk potential or increase local tissue effects. Prior studies indicate that both injection-related discomfort and local site reactions are main drivers for therapy adherence [Citation42,Citation49–51]. Therefore, abating such occurrences are key considerations for optimizing patient-centric SC delivery system design.
Understanding how critical components within LVAI systems enable/regulate injectate delivery and drive deposition location will further inform the development of devices and PFS containers that are tailored to the delivery of modern biologics. The bench and preclinical translational research presented here examined the delivery performance impact of key LVAI components in an early design embodiment under realistic use scenarios. This may ultimately inform product development and potentially mitigate patient risks when moving into the clinical setting.
A limitation of this study includes use of an investigational LVAI embodiment including various investigational PFS components utilizing a small number of trained device users. Subsequent human factor or clinical device performance studies in broader end-user populations are necessary to confirm pain and acceptability in addition to potential human factors benefits. A translational preclinical animal model was used to characterize device performance and resulting SC depositions. However, this in vivo fluoroscopy model obviated the necessity for ionizing radiation use in human subjects while enabling visualization and dimensional characterization of in situ depots. In human subjects, alternative imaging methods such as ultrasound imaging [Citation20] may be more feasible for deposition evaluation although with potentially less precise depot characterization. Biological models with representative human tissue characteristics, such as swine, provide effective translational models to assess device/tissue interactions including depot location and injection site effects that are not predictable by bench characterization alone. While swine are a well-accepted preclinical model for human skin and SC tissue administrations, there are minor differences in tissue physiology. Injection site reactions may not directly correlate with responses in humans due to these differences.
Also in this study, a range of Newtonian placebo solutions with viscosities (2.3–50 cP) were examined to cover a broad range of potential biotherapy formulations expected to be mechanically feasible for LVAI delivery. However, a comprehensive listing of marketed or developing product viscosities and rheological properties is not readily available. The placebo formulations tested were designed to mimic only pharmaceutical rheological properties and therefore both injection site effects and ultimate injection performance may differ for various active biopharmaceutical formulations [Citation42,Citation47,Citation48,Citation52–55]. Future deeper examination of depot dispersion kinetics as a function of solution viscosity could also be of value. Additionally, drug formulations including particle suspensions or solutions which undergo a sol-gel phase transition into an in situ gel depot upon exposure to physiological conditions have numerous additional unique characteristics that may impact injectability. Among these are particle size, shape, settling/resuspension characteristics and aggregation/agglomeration potential for suspensions, or viscoelastic flow behavior and sol-gel transition rate for in situ gel formers. While outside the scope of this present work, a comprehensive assessment of these unique formulation properties and their potential interaction with LVAI delivery systems is warranted.
5. Conclusions
This study confirms the feasibility of rapid injections for higher viscosity formulations using various PFS cannula diameters and LVAI drive spring forces. The investigational PFS cannula and LVAI embodiment successfully delivered 2-mL injectates in vivo using all tested device combinations, and mechanical and in vivo performance was not compromised by altering the PFS cannula diameter or drive spring force. As expected, injectate delivery time improved with UTW cannula and higher drive spring forces and was proportional to injectate viscosity. Injectate was consistently deposited within the SC tissue, which was not impacted by delivery duration or injectate viscosity. Delivery times were consistent but nominally longer in vivo versus in vitro. Tissue effects (erythema/wheal) typically resolved within an hour with no significant differences among device configurations. Reduced delivery times with UTW PFS cannula may improve a known challenge for SC injections and increase the potential range of formulation viscosities and volumes applicable for LVAI use.
Declaration of interest
All authors are or were employees and potential stockholders of BD, which sponsored this work. The authors have no other relevant affiliations or financial involvement with any organization or entity with a financial interest in or financial conflict with the subject matter or materials discussed in the manuscript apart from those disclosed.
Reviewer disclosures
Peer reviewers on this manuscript have received an honorarium from Expert Opinion on Drug Delivery for their review work, but have no other relevant financial relationships to disclose.
Supplemental_Figures.docx
Download MS Word (790.2 KB)Supplemental_Tables.docx
Download MS Word (54.9 KB)Acknowledgments
We thank the numerous extended team members from BD who contributed to the successful planning, organization, execution, and analysis of this work, including Benjamin Selvage and other Research Animal Facility staff members for preclinical study execution, Wen Yue and Didier Morel for design and data analysis discussions, and LuWanda Chandler for placebo formulation and filling assistance. The authors thank BD Medical Pharmaceutical Systems R&D (Marc Flippe, Vincent Herin) and Medical Affairs (Stanislav Glezer, Claire Lageat) for device development/supply and review of study design. The authors thank Jessica Reece of NC Biotechnology Center for assistance in reference research. We also thank Britta Jacobsen, PhD, of Whitsell Innovations for editorial and writing assistance.
Supplementary material
Supplemental data for this article can be accessed online at https://doi.org/10.1080/17425247.2022.2116425
Additional information
Funding
References
- Bittner B, Richter W, Schmidt J. Subcutaneous administration of biotherapeutics: an overview of current challenges and opportunities. BioDrugs. 2018 Oct;32(5):425–440.
- Pivot X, Gligorov J, Muller V, et al. Preference for subcutaneous or intravenous administration of trastuzumab in patients with HER2-positive early breast cancer (PrefHer): an open-label randomised study. Lancet Oncol. 2013 Sep;14(10):962–970.
- Stoner KL, Harder H, Fallowfield LJ, et al. Intravenous versus subcutaneous drug administration. Which do patients prefer? A systematic review. Patient. 2014 Jul 12. DOI:10.1007/s40271-014-0075-y.
- Stewart D, Aucoin JS, Crosbie T, et al. Update on the subcutaneous administration of rituximab in Canadian cancer centres. Curr Oncol. 2020 Apr;27(2):113–116.
- Usmani SZ, Mateos MV, Hungria V, et al. Greater treatment satisfaction in patients receiving daratumumab subcutaneous vs. intravenous for relapsed or refractory multiple myeloma: COLUMBA clinical trial results. J Cancer Res Clin Oncol. 2021 Feb;147(2):619–631.
- Overton PM, Shalet N, Somers F, et al. Patient preferences for subcutaneous versus intravenous administration of treatment for chronic immune system disorders: a systematic review. Patient Prefer Adherence. 2021;15:811–834.
- Jin JF, Zhu LL, Chen M, et al. The optimal choice of medication administration route regarding intravenous, intramuscular, and subcutaneous injection. Patient Prefer Adherence. 2015;9:923–942.
- Mateos MV, Nahi H, Legiec W, et al. Subcutaneous versus intravenous daratumumab in patients with relapsed or refractory multiple myeloma (COLUMBA): a multicentre, open-label, non-inferiority, randomised, phase 3 trial. Lancet Haematol. 2020 May;7(5):e370–e380.
- Schreiber S, Ben-Horin S, Leszczyszyn J, et al. Randomized controlled trial: subcutaneous vs intravenous infliximab CT-P13 maintenance in inflammatory Bowel disease. Gastroenterology. 2021 Jun;160(7):2340–2353.
- Salar A, Avivi I, Bittner B, et al. Comparison of subcutaneous versus intravenous administration of rituximab as maintenance treatment for follicular lymphoma: results from a two-stage, phase IB study. J Clin Oncol. 2014 Jun 10;32(17):1782–1791.
- Marcucci G, Silverman L, Eller M, et al. Bioavailability of azacitidine subcutaneous versus intravenous in patients with the myelodysplastic syndromes. J Clin Pharmacol. 2005 May;45(5):597–602.
- Merz M, Salwender H, Haenel M, et al. Subcutaneous versus intravenous bortezomib in two different induction therapies for newly diagnosed multiple myeloma: an interim analysis from the prospective GMMG-MM5 trial. Haematologica. 2015 Jul;100(7):964–969.
- Stohl W, Schwarting A, Okada M, et al. Efficacy and safety of subcutaneous belimumab in systemic lupus erythematosus: a fifty-two-week randomized, double-blind, placebo-controlled study. Arthritis Rheumatol. 2017 May;69(5):1016–1027.
- Badkar AV, Gandhi RB, Davis SP, et al. Subcutaneous delivery of high-dose/volume biologics: current status and prospect for future advancements. Drug Des Devel Ther. 2021;15:159–170.
- Collins DS, Sanchez-Felix M, Badkar AV, et al. Accelerating the development of novel technologies and tools for the subcutaneous delivery of biotherapeutics. J Control Release. 2020 May 10;321:475–482.
- Tornero Molina J, Lopez Robledillo JC, Casamira Ruiz N. Potential benefits of the self-administration of subcutaneous methotrexate with autoinjector devices for patients: a review. Drug Healthc Patient Saf. 2021;13:81–94.
- Asche CV, Shane-McWhorter L, Raparla S. Health economics and compliance of vials/syringes versus pen devices: a review of the evidence. Diabetes Technol Ther. 2010 Jun;12(Suppl 1):S101–8.
- Berteau C, Filipe-Santos O, Wang T, et al. Evaluation of the impact of viscosity, injection volume, and injection flow rate on subcutaneous injection tolerance. Med Devices (Auckl). 2015;8:473–484.
- Dias C, Abosaleem B, Crispino C, et al. Tolerability of high-volume subcutaneous injections of a viscous placebo buffer: a randomized, crossover study in healthy subjects. AAPS PharmSciTech. 2015 Oct;16(5):1101–1107.
- Woodley WD, Morel DR, Sutter DE, et al. Clinical evaluation of large volume subcutaneous injection tissue effects, pain, and acceptability in healthy adults. Clin Transl Sci. 2022 Jan;15(1):92–104.
- Woodley WD, Yue W, Morel DR, et al. Clinical evaluation of an investigational 5 mL wearable injector in healthy human subjects. Clin Transl Sci. 2021 May;14(3):859–869.
- Heise T, Nosek L, Dellweg S, et al. Impact of injection speed and volume on perceived pain during subcutaneous injections into the abdomen and thigh: a single-centre, randomized controlled trial. Diabetes Obes Metab. 2014 Oct;16(10):971–976.
- Zijlstra E, Jahnke J, Fischer A, et al. Impact of injection speed, volume, and site on pain sensation. J Diabetes Sci Technol. 2018 Jan;12(1):163–168.
- Doughty DV, Clawson CZ, Lambert W, et al. Understanding subcutaneous tissue pressure for engineering injection devices for large-volume protein delivery. J Pharm Sci. 2016 Jul;105(7):2105–2113.
- Collins DS, Kourtis LC, Thyagarajapuram NR, et al. Optimizing the bioavailability of subcutaneously administered biotherapeutics through mechanochemical drivers. Pharm Res. 2017 Oct;34(10):2000–2011.
- Sequeira JAD, Santos AC, Serra J, et al. Subcutaneous delivery of biotherapeutics: challenges at the injection site. Expert Opin Drug Deliv. 2019 Feb;16(2):143–151.
- Kinnunen HM, Mrsny RJ. Improving the outcomes of biopharmaceutical delivery via the subcutaneous route by understanding the chemical, physical and physiological properties of the subcutaneous injection site. J Control Release. 2014 May 28;182:22–32.
- Weinhold T, Del Zotto M, Rochat J, et al. Improving the safety of disposable auto-injection devices: a systematic review of use errors. AAPS Open. 2018 Oct 18;4(1):7.
- Schneider A, Mueller P, Jordi C, et al. Hold the device against the skin: the impact of injection duration on user’s force for handheld autoinjectors. Expert Opin Drug Deliv. 2020 Feb;17(2):225–236.
- Zhang Q, Fassihi MA, Fassihi R. Delivery considerations of highly viscous polymeric fluids mimicking concentrated biopharmaceuticals: assessment of injectability via measurement of total work done “WT.” AAPS PharmSciTech. 2018 May;19(4):1520–1528.
- Allmendinger A, Fischer S, Huwyler J, et al. Rheological characterization and injection forces of concentrated protein formulations: an alternative predictive model for non-Newtonian solutions. Eur J Pharm Biopharm. 2014 Jul;87(2):318–328.
- Roberts BC, Rini C, Klug R, et al. Novel cannula design improves large volume auto-injection rates for high viscosity solutions. Drug Deliv. 2022 Dec;29(1):43–51.
- Swindle MM, Makin A, Herron AJ, et al. Swine as models in biomedical research and toxicology testing. Vet Pathol. 2012 Mar;49(2):344–356.
- Laurent PE, Pettis R, Easterbrook W, et al. Evaluating new hypodermic and intradermal injection devices. Med Device Technol. 2006 Mar;17(2):16–19.
- OECD. Guidelines for the testing of chemicals, section 4, test no. 404: acute dermal irritation/corrosion. Paris France: OECD Publishing; 2015.
- Kang DW, Oh DA, Fu GY, et al. Porcine model to evaluate local tissue tolerability associated with subcutaneous delivery of protein. J Pharmacol Toxicol Methods. 2013 May-Jun;67(3):140–147.
- Agresti A. Categorical data analysis. 2nd ed. Hoboken, New Jersey: John Wiley & Sons, Inc. (Wiley Series in Probability and Statistics); 2002.
- Allmendinger A, Fischer S. Tissue resistance during large-volume injections in subcutaneous tissue of minipigs. Pharm Res. 2020 Sep 4;37(10):184.
- Shahriar M, Rewanwar A, Rohilla P, et al. Understanding the effect of counterpressure buildup during syringe injections. Int J Pharm. 2021 Jun 1;602:120530.
- Watt RP, Khatri H, Dibble ARG. Injectability as a function of viscosity and dosing materials for subcutaneous administration. Int J Pharm. 2019 Jan 10;554:376–386.
- Yildiz A, Lenau TA. In vitro simulation of tissue back-pressure for pen injectors and auto-injectors. J Pharm Sci. 2019 Aug;108(8):2685–2689.
- Usach I, Martinez R, Festini T, et al. Subcutaneous injection of drugs: literature review of factors influencing pain sensation at the injection site. Adv Ther. 2019 Nov;36(11):2986–2996.
- St Clair-Jones A, Prignano F, Goncalves J, et al. Understanding and minimising injection-site pain following subcutaneous administration of biologics: a narrative review. Rheumatol Ther. 2020 Dec;7(4):741–757.
- Gradel AKJ, Porsgaard T, Lykkesfeldt J, et al. Factors affecting the absorption of subcutaneously administered insulin: effect on variability. J Diabetes Res. 2018;2018:1205121.
- Shi GH, Connor RJ, Collins DS, et al. Subcutaneous injection performance in yucatan miniature pigs with and without human hyaluronidase and auto-injector tolerability in humans. AAPS PharmSciTech. 2021 Jan 6;22(1):39.
- Rini C, Roberts BC, Morel D, et al. Evaluating the impact of human factors and pen needle design on insulin pen injection. J Diabetes Sci Technol. 2019 May;13(3):533–545.
- Wang W. Tolerability of hypertonic injectables. Int J Pharm. 2015 Jul 25;490(1–2):308–315.
- Shi GH, Pisupati K, Parker JG, et al. Subcutaneous injection site pain of formulation matrices. Pharm Res. 2021 May;38(5):779–793.
- Graham S, Weinman J, Auyeung V. Identifying potentially modifiable factors associated with treatment non-adherence in paediatric growth hormone deficiency: a systematic review. Horm Res Paediatr. 2018;90(4):221–227.
- Bolge SC, Goren A, Tandon N. Reasons for discontinuation of subcutaneous biologic therapy in the treatment of rheumatoid arthritis: a patient perspective. Patient Prefer Adherence. 2015;9:121–131.
- Salaffi F, Di Carlo M, Farah S, et al. Adherence to subcutaneous anti-TNFalpha agents in patients with rheumatoid arthritis is largely influenced by pain and skin sensations at the injection site. Int J Rheum Dis. 2020 Apr;23(4):480–487.
- Chabra S, Gill BJ, Gallo G, et al. Ixekizumab citrate-free formulation: results from two clinical trials. Adv Ther. 2022 Jun;39(6):2862–2872.
- Thomaidou E, Ramot Y. Injection site reactions with the use of biological agents. Dermatol Ther. 2019 Mar;32(2):e12817.
- Ionova Y, Wilson L, Mallela KMG. Biologic excipients: importance of clinical awareness of inactive ingredients. PLoS One. 2020;15(6):e0235076.
- Yoshida T, Otaki Y, Katsuyama N, et al. New Adalimumab formulation associated with less injection site pain and improved motivation for treatment. Mod Rheumatol. 2019 Nov;29(6):949–953.