
ABSTRACT
Introduction: End-stage renal disease (ESRD) patients depend on dialysis for removal of toxic waste products, fluid overload relief and maintenance of electrolyte balance. Dialysis prolongs millions of lives. To some extent, ESRD has become a manageable disease with a steadily growing dialysis population of increasing average age and associated comorbidity. During 7 decades many technical refinements have been developed e.g. sodium profiling, blood volume, ultrafiltration variation based on blood pressure measurement, urea kinetics etc. Despite its large potentials, in-line electrolyte monitoring lags behind in dialysis treatment.
Areas covered: In this paper, we review the state of technologies available for in-line monitoring of the electrolytes sodium, potassium and calcium during hemodialysis.
Expert commentary: We concluded that individual optimization of dialysate composition should be able to improve hard medical outcomes, but practical clinical implementation stands/falls with reliable and affordable in-line ion-selective sensing technology. Optical ion-selective microsensors and microsystems form a promising pathway for individualizing the dialysis treatment.
1. Introduction
The kidneys are responsible for essential processes such as removal of toxic waste products, fluid overload as well as for maintaining the balance for acid–base (pH) and electrolytes (e.g. Na+, K+, Ca2+). A patient who reaches end-stage renal disease, and who is not (yet) eligible for renal transplantation, is dependent on chronic dialysis treatment modalities, such as peritoneal dialysis or hemodialysis (HD). HD usually is performed intermittently during 4 h 3 days/week. The underlying physical principles are convection and diffusion between blood and dialysate across a semi-permeable membrane (dialyzer). Diffusive solute transport facilitates the passage of fluid components across the dialyzer membrane down a concentration gradient. The diffusive transport is mainly responsible for the removal of small solutes and is dependent of dialysate flow rate [Citation1]. Through convection, water and sodium are removed by a hydraulic and osmotic pressure differences across the membrane. The presence of non-diffusible proteins on the blood side of the membrane cause charge imbalance across the membrane and hence the Gibbs–Donnan effect should be considered in solute transport by diffusion or convection [Citation2,Citation3]. The dialyzer in a HD machine allows the solutes to diffuse between blood and dialysate such that, during the course of treatment, the plasma composition is aimed to be reestablished to normal values. For both processes, molecular size and dialyzer membrane pore-size determine which fluid components can cross the dialyzer. Dialysate is the fluid used in dialysis whose function is removal of waste material from blood and transport of useful substances, such as bicarbonate, into the blood. In most outpatient centers, the same dialysate composition is used for all patients. presents the physical principle of dialysis.
Figure 1. Physical principles of dialysis.
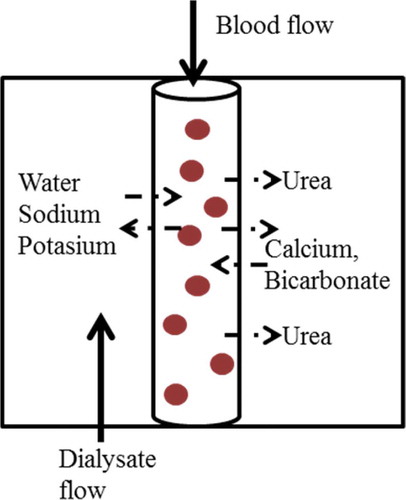
In combination with the dialyzer membrane characteristics, the diffusive flux is defined by the concentration gradient between blood and dialysate. Thus, the diffusible substance (Na+, K+, Ca2+, and bicarbonates) has a major consequence on diffusion flux.
1.1. Need of electrolyte monitoring during dialysis
Technological innovations in dialysis equipment have improved the quality and safety of HD treatment since the invention of dialysis, but there is plenty of room left for further improvements. Ideally, dialysis technology would fully replace the failed kidney functions and rehabilitate the patient with a minimum cost to the society. However, we still are far from reaching this goal. The natural kidney is capable of maintaining complete homeostasis in a time constant fashion with complex sensing and bio-feedback mechanisms to react upon changing circumstances. In contrast to the natural kidney, conventional HD instrumentation is based on a so-called one-size-fits-all approach, where a variant patient–dialysate exchange gradient exists which can be modified from time to time, based on clinical evaluation. In most outpatient centers, dialysate is prepared with a fixed concentration without taking into account the interindividual differences in plasma concentration of different electrolytes (Na+, K+, Ca2+). Though most patients bear the procedure well, some tolerate it badly. This has incited a great deal of research into the prescription of an individual dialysate and so personalizes the dialysis treatment [Citation4–Citation6]. The wide difference in interindividual and to a lesser extent intraindividual, pre-dialytic serum concentrations of important electrolytes can lead to profound variations in the intradialytic electrolyte balance leading to complications. summarizes the possible complications arising from diffusive influx or diffusive loss of Na+, K+, and Ca2+ during HD treatment. Therefore, the ‘one-size-fits-all’ approach might be abandoned and dialysate could be prescribed on an individual basis instead of on a facility level. On-line monitoring of ionic mass balance and blood concentrations of vital electrolytes during dialysis can enable such an individualized and tailored dialysis prescription, thereby preventing or at least mitigating the complications listed in .
Table 1. Summary of complications arising from electrolytes imbalance (insufficient or excessive removal) during HD.
1.2. Search methods
In this paper, we review the state of the technology available for on-line monitoring of electrolytes during HD, focusing on sodium, potassium, and calcium. The primary literature databases used to obtain relevant articles and reviews were Scopus, PubMed, SciFinder, and Google Scholar. The literature search keywords included on-line monitoring, dialysis, individualization of dialysate, ion-selective electrodes (ISEs), flame photometry, chemical sensors, optical sensors, microsystem technology, and lab-on-chip in medical diagnostics. The articles referred to in this work have been published over the last seven decades with a focus on electrolyte monitoring in HD.
2. On-line monitoring in dialysis
The dialysance of the mobile electrolytes through the dialyzer corrected for ultrafiltration and recirculation can be considered as effective ionic dialysance. As sodium is by far the most represented electrolyte in the dialysate, a considerable amount of work has been done to monitor sodium during dialysis. In the early days of dialysis, a low-sodium dialysate was used to avoid the chronic complications, but with the reduced treatment time, a different approach of varying the sodium concentration during the procedure was adapted [Citation12–Citation15]. One disadvantage of this method was the need for frequent blood sampling.
Along with HD time and potassium dialysance, the removal of potassium is mainly dependent on the concentration difference between dialysate and pre-dialysis plasma potassium. But, unlike sodium, dialysate potassium concentration individualization has received much less attention in the literature, although different dialysate potassium concentrations can be prescribed. A variable concentration of potassium (potassium profiling) during HD treatment was proposed for a fluent removal of potassium [Citation16]. On-line potassium dialysate monitoring during dialysis is a matter of utmost relevance due to the aging dialysis population. On-line monitoring of potassium will not only allow for the calculation of potassium mass balance but will also provide a noninvasive way to estimate plasma potassium at inlet and outlet. Ideally, dialysis equipment should be able to assess blood potassium concentrations directly and continuously without the need of blood sampling.
Calcium mass balance is complicated as next to removal by convection, also depending on the pre-dialytic plasma calcium concentration during dialysis, either diffusive gain or loss can occur [Citation17]. Therefore, what the perfect dialysate calcium concentration is in HD is a difficult question to answer. There is no one-size-fits-all; dialysis calcium concentration is a two-edged sword since both positive as well as negative calcium balance can be good or lead to complications [Citation18,Citation19]. Hence an integrated quantitative assessment of intradialytic calcium mass balance will help in the individualization of dialysate calcium in HD [Citation20]. The typical concentrations of substances commonly used in dialysate are listed in [Citation21]. The concentration of these substances can change considerably under special clinical conditions.
Table 2. Composition of substances in commercial dialysate [Citation21].
2.1. Conductivity measurements
Although conductivity measurement is not ion-selective, history has learned that even such a limited in-line measurement can hugely improve routine dialysis. A conductivity method to measure on-line ionic dialysance was described first by Polaschegg [Citation22]. The measurement principle involved using a pair of conductivity sensors at the dialyzer inlet and outlet to measure the concentration difference. Not only is conductivity measurement noninvasive and inexpensive but also the linear correlation between the conductivity and sodium content has been used to estimate the sodium concentrate in the dialysate and patient’s plasma. In fact, researchers also demonstrated a biofeedback system to automatically determine the water plasma and dialysate conductivity [Citation15,Citation23,Citation24]. Conductivity measurement has resulted into the availability of on-line clearance monitors on various contemporary dialysis monitors (like Diascan® Hospal-gambro; OCM; Fresenius). This provides an estimated assessment (surrogate measurement) of urea clearance [Citation25], given the strong relation between diffusive sodium and urea transport [Citation26]. As already mentioned, the main drawback of conductivity measurement is that, it is not specific for ion type distinction; hence, it only enables an approximate calculation of ionic mass balance as a surrogate of sodium balance and plasma conductivity as a surrogate of plasma sodium [Citation27,Citation28]. Also, due to the effect of bicarbonate ions on conductivity measurements, neither dialysate nor plasma conductivity can be considered a full substitute for equivalent sodium concentrations (despite the strong interrelation).
2.2. Ion-selective electrodes
As the name indicates, ISE can discriminate between ions. An ideal ISE would respond to only one single type of ion in a mixed solution. In practice, however, this is not the case. All ISEs are subject to crosstalk from other ions to some extent. This crosstalk can lead to problems depending on the application. In typical dialysate the sodium concentrate is about a factor 100 larger than for potassium and calcium, which tightens the need for ion-crosstalk reduction.
The most common and frequently used ISE is the glass pH electrode (for H+). Basically, ISEs are a special class of electrochemical sensors where a potentiometric signal is measured as output. In brief, a galvanic cell is formed by immersing a pair of electrodes in a solution. The difference in potential of the two electrodes known as electromotive force (EMF) is then measured. If the potential of one of the electrodes (reference electrode) is constant while the other electrode (indicator electrode) follows the Nernst equation, then the EMF can be measured [Citation29]. Basically, measured EMF of calibrator fluid(s) and sample are translated into the activity of the ionic species of the sample by means of the Nernst equation. Once calibrated with known concentrations of solution, the EMF can then be related to the analyte concentration of a sample solution (provided the Nernst equation is met). ISEs can be classified based on the type of membrane material as glass, crystalline, and polymeric, respectively. One of the most important applications of ISEs is in clinical off-line analysis to measure electrolytes in samples of whole blood, saliva, urine, and plasma [Citation30,Citation31]. In most clinical laboratories, sodium and potassium concentrations are measured using multichannel analyzers by indirect ISE potentiometry [Citation32]. The first clinical application of ISEs for Na and K flux measurement was reported by Gotch et al. in combination with a variable volume single-pool sodium model [Citation33]. The system called Ionoflow® (Fresenius AG, Bad Homburg, Germany) was used to sample dialysate continuously with a double channel sampling pump. This device however did not end up in the market as a commercial product [Citation34]. Most modern ISEs use a passive polymeric membrane comprising of ionophores which determines the ion-selectivity and thus forms the most significant part of the electrode [Citation35,Citation36]. Even though ISEs are well-established techniques in clinical chemistry, they suffer from chemical and electronic interference. The EMF can e.g. already change due to sample stirring [Citation37,Citation38]. Such limitations and the bulk size of the ISEs undermine its integration in the in-line monitoring of electrolytes during dialysis [Citation39]. Also, mainly due to membrane aging/fouling, the standard electrode potential of an ISE changes over time so that it needs frequent recalibration which is not practical in continuous on-line measurement [Citation37,Citation40]. A common characteristic shared by all membrane-based electrochemical ISEs is that, the underlying principle leans on the Nernst equation and non-Nernstian behavior distorts the measurements [Citation41].
2.3. Optical measurements
Whereas electrochemical methods are routinely used for assessment of ion concentrations in watery solutions, optical sensors offer potential benefits like e.g. inherent immunity to electromagnetic interference, intrinsically contactless ‘through the window’ interaction (laser-induced breakdown spectroscopy), no damage to the host system (molecular fluorescence based sensors). This offers improved biocompatibility and less vulnerability to fouling, the absence of electrical currents, and the potential of simultaneous measurements of multiple substances. The basic components needed for optical measurement are a light/illuminating source (e.g. a light emitting diode (LED) or a laser module), the fluid (stream) to be measured, an optical spectral sorting element (e.g. filter or grating), a detector for optical readout (photodiode or a charge-coupled device), and a signal processor.
Within the field of dialysis, optical sensors namely ultraviolet (UV) absorbance and near-infrared (NIR) spectroscopy have already been used to estimate urea in spent dialysate to improve the dialysis dosage. The UV absorbance method utilizes a UV-light source (190–400 nm), a UV-transparent sample holder (cuvette), and a photodetector. UV absorbance measurement in spent dialysate was first reported by Gál et al. [Citation42]. This group utilized UV-transmittance at 254 nm to demonstrate the possibility of continuously monitoring the removal of low and medium molecular uremic toxins. Almost 20 years later, Vasilevski et al. [Citation43] presented a work aimed to monitor dialysate during HD using UV-absorbance. Soon after, Fridolin et al. [Citation44] described the monitoring of solutes in spent dialysate using UV-absorbance. They compared measurements on collected dialysate samples with on-line measurements. The spectrophotometer was connected to the fluid outlet of the dialysis machine and the spent dialysate passed through a cuvette. The first real clinical application using UV technology was presented by Uhlin et al. [Citation45]. UV-absorbance was used to calculate the dialysis dose at Kt/V. The UV-absorbance method has been commercialized since then and now is available as a dialysis dose monitor in terms of urea-based parameters [Citation46].
Figure 2. Schematic illustration of a fluorescent PET sensor molecule. The fluorophore part is responsible for fluorescence emission and the receptor is designed for a particular cation (Na+, K+, Ca2+). [Left: In absence of the targeted analyte, fluorescence is absent (OFF-state). Right: If an analyte (indicated by “A”) is captured by the receptor, the molecule will emit light fluorescence when excited (ON-state)].
![Figure 2. Schematic illustration of a fluorescent PET sensor molecule. The fluorophore part is responsible for fluorescence emission and the receptor is designed for a particular cation (Na+, K+, Ca2+). [Left: In absence of the targeted analyte, fluorescence is absent (OFF-state). Right: If an analyte (indicated by “A”) is captured by the receptor, the molecule will emit light fluorescence when excited (ON-state)].](/cms/asset/fdfcd36b-28f5-497b-a92d-63869d731491/ierd_a_1230494_f0002_oc.jpg)
NIR (750–2500 nm) spectrometry is also demonstrated for on-line monitoring of urea during dialysis. Cho et al. [Citation48] designed a temperature-controlled acousto-optical filter-based spectrometer to measure urea concentration in spent dialysate. In comparison to UV-absorbance, NIR spectroscopy is more complicated because of the added optical principles of interference and diffraction.
2.3.1. Flame photometry
The first optical technique (1949) to determine sodium and potassium in blood and urine to be used for dialysis was based on photoelectric flame photometry [Citation49]. In the same year but later on, flame photometry was used to determine calcium as well [Citation50]. Flame photometry is an atomic emission spectroscopy technique used to determine the concentration of certain metal ions. The solution is nebulized and injected into a nonluminous gas flame resulting in emission of a characteristic flame coloring. The spectral emission ‘fingerprint’ of the flame identifies the element while the intensity tells the concentration of the elements [Citation51]. This technique is well established and widely used in clinical laboratories for electrolyte concentration measurement but (due to the needed flame and maintenance-sensitive nebulizer) highly impractical for on-line measurement.
2.3.2. Fluorescent photoinduced electron transfer sensors
The principles of supramolecular chemistry [Citation52] have enriched the field of analytical science. This has resulted in the development of sensor molecules for cations (Na+, K+, Ca2+) based on fluorescent photoinduced electron transfer (PET) process [Citation53–Citation56]. The fluorescent PET sensor design is based on a ‘fluorophore–spacer–receptor’ format (). In the absence of an analyte, e.g. a cationic species, an electron gets transferred from the receptor to the fluorophore which results in quenching the fluorescence process. This is called an ‘OFF’ state of the sensor. If an analyte is present, then there will be emission of fluorescence signal from the fluorophore. This is called an ‘ON’ state of the sensor. Fluorescence intensity gives the specific analyte concentration. The choice of fluorophore can be entirely based on excitation and emission wavelengths, whereas the receptor can be chosen based on the analyte to be determined. Therefore, cheap and stable visible spectrum (400–700 nm) light sources like LEDs or small lasers can be used for excitation.
PET sensors have been used to analyze samples of whole blood in a static medium [Citation57]. The PET molecules are fixed on a substrate which acts like a cassette. After injecting the sample into this cassette, it is inserted into an optical readout device. This technology has resulted into an electrolyte analyzer for laboratories that utilizes a LED as an excitation source and photodiodes to collect the fluorescence emission [Citation58]. Even though this device is capable of measuring all essential electrolytes at physiological range, it is a table-top lab device to be used for off-line analysis on samples and cannot be used for on-line monitoring of electrolytes during dialysis. Englich et al. [Citation59] used the PET sensor molecule for sodium and coated it on a microstructured optical fiber tip. They were able to measure the sodium concentration but the experimental setup is complicated and not (yet) practical for clinical treatment.
2.3.3. Laser-induced breakdown spectroscopy
Another potential optical technology for ion concentration measurement is based on the principle of laser-induced breakdown spectroscopy (LIBS) [Citation60,Citation61]. The elemental analysis in LIBS is very similar to flame photometry, but instead of a gas flame, it uses a strongly focused laser pulse to produce a minuscule (typically 2–3-µm diameter) plasma discharge (the ‘breakdown’) directly in the fluid stream (so no nebulizer is needed either). Due to the high plasma temperature neighboring atoms are excited and, when falling back to their ground state, send out light with a characteristic spectral line pattern. Just as in flame photometry, the elemental composition can then be determined by resolving the spectrum of the resulting emission spectrum [Citation62]. The atom-specific spectral peak amplitudes indicate specific ion concentration. LIBS thus is a truly ‘through-the-window’ measurement technology that does not require any direct contact with the fluid. The absence of an ion-selective membrane circumvents drift problems from membrane fouling issues or other Nernst equation disturbances. illustrates the principle of LIBS and its possible implementation of ion measurement in the spent dialysate. The advantages of LIBS include real time analysis of multiple elements (in principle, all elements if the laser power is high enough), no sample preparation, and high sensitivity (down to ppm level, if laser power is high enough). Rehse et al. [Citation63] reviewed the potential biomedical applications of LIBS technology. LIBS has also been commercialized for elemental analysis [Citation64]. For a detailed review about existing portable LIBS systems and its uses, the readers are requested to refer to the review by Rakovský et al. [Citation65]. The application of LIBS technology for the on-line determination of electrolytes within flowing dialysate has only recently been suggested and demonstrated in principle [Citation66,Citation67].
Figure 3. Principle of laser induced breakdown spectroscopy (LIBS): a tiny volume inside the dialysate stream is temporarily atomized by a focused high-energy pulsed laser. Light emitted from this high-temperature spark is collected and dispersed, where the atoms present in the specimen can be identified by specific peaks in the atomic emission spectrum. [Citation67,Citation68].
![Figure 3. Principle of laser induced breakdown spectroscopy (LIBS): a tiny volume inside the dialysate stream is temporarily atomized by a focused high-energy pulsed laser. Light emitted from this high-temperature spark is collected and dispersed, where the atoms present in the specimen can be identified by specific peaks in the atomic emission spectrum. [Citation67,Citation68].](/cms/asset/ced4995b-a19f-49c9-82d4-f9140151df43/ierd_a_1230494_f0003_oc.jpg)
Technological evolutions have made dialysis simpler and comfortable. However, these technological advancements also revealed the need to revolutionize other technical fields, e.g. online monitoring during dialysis treatment. There are various established and potential technologies available to measure individual ion concentrations. Some of them are already available as commercial products for sample analysis, but so far, no peer-reviewed publications or device can be found for routine real-time online measurement of essential electrolytes during dialysis. Therefore, the in vivo performance, and the influence of complexed ions on the measurements of the different techniques has yet to be assessed. A summary of the available technologies for electrolyte and urea monitoring with its advantages and disadvantages is presented in .
Table 3. Summary of electrolyte and urea monitoring technologies.
3. Microsystem technologies as an enabling additional technology for electrolyte monitoring
The development of microsystems technologies has provided a plethora of innovative ideas in medical diagnostics. It has the potential to manufacture high-precision devices in a very cost-effective way. Some of the examples include a simple pressure and temperature sensor [Citation71]. Recent developments in the field of rapid prototyping applying soft lithography using polymeric materials for lab-on-a-chip [Citation72,Citation73] microfluidic devices, provide a platform for point-of-care (POC)-based devices [Citation74–Citation76]. However, these technologies have not yet been employed in nephrology in general and HD in particular.
There are inherent advantages of microsystem technologies, namely, (1) smaller sizes ranging from micrometers to nanometers, (2) fast response time due to the small samples sizes, (3) high precision, (4) cost-effectiveness, and (5) ease of integration make it attractive to be used in biomedical devices. Miniaturization leads to different challenges of detection in microfluidic systems compared to macro-systems. Small sample volume also means less number of analytes; hence, the detection can be difficult. Therefore, sensitivity and scalability are the two important factors affecting the choice of detection method. The detection system can be based either on electrochemical (conductivity, potentiometric), electrical (impedance), or optical (absorbance, reflectance, fluorescence). One of the most sensitive sensing techniques is based on molecular fluorescence with advantages in terms of specificity, sensitivity, and possibility to detect.
Microfluidic systems based on electro-osmotic flow or electrophoretic separation have employed ion concentration measurement using conductivity detection. This detection scheme is capable of simultaneously analyzing multiple ions in both contact and contactless modes [Citation77,Citation78]. An earlier portable critical care analyzer system called i-STAT is based on ion-selective potentiometric sensing [Citation79,Citation80]. The system consists of a hand-held analyzer and a disposable cartridge. The cartridge contains a series of ion-sensitive electrodes over which the analysis fluid passes. This commercial system is used as a POC system to analyze whole blood. The i-STAT system is also evaluated in an HD unit to analyze sodium, potassium, pH, ionized calcium, etc. [Citation81]. The researchers suggested that i-STAT system also can analyze sodium, potassium, pH, and ionized calcium in dialysate fluid. Liao et al. [Citation82] fabricated a microfluidic sensor for multiple ion analysis. They used polydimethylsiloxane (PDMS) to fabricate micro-pumps and a microchannel with ISEs patterned on a glass substrate to analyze pH, calcium, and potassium. The device showed good sensitivity and was reproducible. There are numerous review papers summarizing the use of ion-selective microfluidic sensors for the analysis of various ions and metals in fluid for clinical and environmental applications [Citation77,Citation83,Citation84].
The optical sensing schemes in microfluidic devices can be classified as ‘off-chip’ and ‘on-chip,’ respectively. The off-chip approach uses the exterior coupling of optical components into the device, whereas the on-chip approach applies optical functionalities that are integrated into the device. The optical components used in such sensing systems are LEDs or laser light as light source, optical fibers, or integrated waveguides for light guiding, lenses and filters, and a photodiode or charged-coupled device for detection [Citation85–Citation87]. The basic optical components of such a system are shown in . Optical sensing can be implemented either by measuring the direct change in light intensity, e.g. absorbance [Citation88], fluorescence [Citation89], chemiluminescence [Citation90] or change in the wavelength [Citation91], or phase of polarization of light [Citation92].
Figure 4. Schematic diagram of a simple microfluidic optical sensor setup.
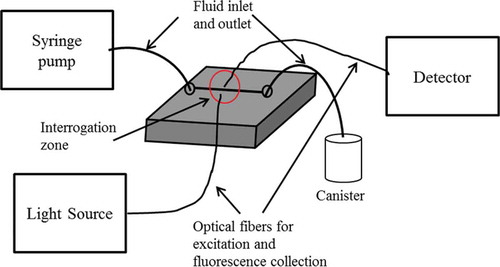
One of the popular ‘off-chip’ methods is spectroscopic detection. The advantages include high sensitivity and low background noise. In order to couple the external macroscopic elements into the microscopic detection areas, fiber-coupling grooves can be fabricated in a single-step fabrication process for the integration of commercial optical fibers [Citation93]. Caglar et al. [Citation88] used optical fiber and fabricated ball lens for light coupling in absorbance measurement. They immobilized arsenazo III onto polymer beads to detect calcium ions in urine with a detection limit of 2.68 × 10⁻⁵ M. The sensor could be reused and regenerated after rinsing with HCl solution. Destandau et al. [Citation94] fabricated a device in PDMS and glass substrate for fluorometric determination of potassium ions (K+) based on a fluorescent molecular sensor calix-bodipy. The device consisted of a Y-shaped microchannel molded in PDMS and fixed on a glass substrate plus optical fibers for excitation and fluorescence light collection. The group performed flow injection analysis of the aqueous solution potassium ions with a detection limit of 0.5 mM.
MEMS technologies have enabled the integration of mechanical and electrical components along with the fluidic part. This has boosted the concept of ‘on-chip’ detection method in microfluidic sensors. Many MEMS-fabricated passive optical components like mirrors, lenses, and filters have been reported and demonstrated [Citation95–Citation97]. Even though integration of such optical components is promising, it is still in its infancy stage. Nevertheless, the numbers of groups working on such integration technologies have increased with time, resulting in the development of miniaturized light sources and optical detectors. The integration of waveguides and lenses can improve the optical path length for absorbance measurement or light focusing for fluorescence measurement. Readers looking for more details are referred to more comprehensive dedicated reviews and articles on optical detection techniques in microfluidic and sensing application, such as [Citation85–Citation87,Citation98–Citation102]. Faye et al. [Citation103] fabricated a portable sensor for lead (Pb2+) detection in a microfluidic device made of PDMS. Calix-DANS3-OH was grafted on the wall of a PDMS microchannel and upon Pb2+ complexation fluorescence quenching was observed up to a detection limit of 2 × 10⁻⁷ M.
Hisamoto et al. [Citation104] demonstrated a capillary-assembled microchip for sensing of Na+, K+, Ca2+. Their multifunctional microchip (called capillary-assembled microchip) consisted of a microchannel network fabricated in PDMS embedded with chemically functionalized square capillaries. The network and outer diameter of capillaries has the same diameter [Citation105]. The ion sensing square capillaries for Na+, K+, Ca2+ were prepared by attaching ion-selective optode membranes to the inner walls of the capillaries. The device could simultaneously analyze sodium with a working range of 10–5–1 M, potassium with a working range of 10−5–10−1 M, and calcium with a working range of 10–5 M.
4. Expert commentary
Over the last few decades, there have been considerable technological advancements in the field of dialysis in terms of blood volume monitoring, biofeedback systems, conductivity measurement, and urea monitoring. The driving force behind on-line monitoring during dialysis treatment is the desire for continuous measurement of physiological data from patients in real time. As of today, real time on-line monitoring is possible for blood volume changes, urea, dialysate conductivity, and thermal energy balance. Blood volume monitoring has been implemented using mechanical [Citation106,Citation107], electrical [Citation108,Citation109], and optical [Citation110] methods. The first routine on-line dialysis adequacy monitoring, DiaSens [Citation70], is based on UV-absorbance measurement technology. Another device which performs continuous real time monitoring of dialysis dose in spent dialysate is Adimea (B. Braun Avitum) [Citation111].
In terms of on-line monitoring of essential electrolytes, the major breakthrough so far has been the dialysate conductivity measurement. This has also resulted in a few commercial products, like Diacontrol (Gambro-Hospal, Lund, Sweden) and OCM (Fresenius Medical Care) as a plasma conductivity target feedback control. The software incorporated in the dialysis machine measures the dialysance at the in- and outlet of the dialyzer. Nevertheless, the system measures ionic mass balance only as a surrogate of net sodium removal and plasma conductivity as a surrogate of plasma sodium concentration. A direct way to on-line measure the electrolyte concentration in spent dialysate would be more preferable, which is also expressed in the present safety standard for dialysis equipment [Citation39].
5. Five-year view
The advancements in microfluidic platforms, the continuous miniaturization of detector elements, and the smart integration of micro optical elements – all envision the future of ion sensing in microdevices. MEMS technologies have resulted in start-up companies with some great POC devices [Citation75]. But this remains a relatively underutilized technology in dialysis care in general and on-line monitoring of electrolytes in particular. The authors see a development of such devices for individualized dialysis treatment with on-line monitoring technologies. This is likely due to low manufacturing cost, smart molecular sensor, smaller device size, and availability. The smaller dimension and relatively simple fabrication of microdevices using polymeric materials [Citation112] make such technologies a perfect platform for the development of a single-use device for on-line monitoring in dialysis. A portable device will not only help in the development of biofeedback control units but also in the development of an intelligent artificial kidney [Citation113]. Once a reliable method has been identified, industrial manufacturing technologies for cheap production of precise optics in large quantities can be implemented (like e.g. used to thousand-fold reduce prices of CD-ROM equipment during the last decades).
Key issues
The use of the same dialysate composition for all patients can result in complications during dialysis and motivates the search to methods enabling individualized dialysis treatment.
Presently, only conductivity measurements are available for routine use. However, these measurements are not fully ion-specific.
Ion selective electrodes (ISEs) offer some advantages in ion selectivity compared to regular conductivity measurements. Modern ISEs comprise of a passive polymeric ion selective membranes,, but the bulk size makes it impractical for a device which can be integrated into the existing dialysis machine for electrolyte monitoring. Also, the ageing and fouling of membrane hinders its use.
Several optical technologies like flame photometry, UV absorbance and NIR spectrometry have been demonstrated as a potential tool for determination of ionic concentration and urea measurement respectively. But, these technologies have not been applied in on-line monitoring of electrolytes in dialysis.
The development in the field of supramolecular chemistry has results in some highly selective sensor molecules for essential electrolytes like sodium, potassium and calcium.
Laser induced breakdown spectroscopy offers through the window non-invasive way of measuring multiple ions.
Microsystem technologies remain underutilized in the field of nephrology. The technological development in this field can offer a cheap and easily operational sensor for one time use. It will be important in future to integrate such opto-fluidic microdevices in the existing dialysis systems for on-line monitoring of essential electrolytes.
Declaration of interest
The authors have no relevant affiliations or financial involvement with any organization or entity with a financial interest in or financial conflict with the subject matter or materials discussed in the manuscript. This includes employment, consultancies, honoraria, stock ownership or options, expert testimony, grants or patents received or pending, or royalties.
Additional information
Funding
References
- Leypoldt JK. Solute fluxes in different treatment modalities. Nephrol Dial Transpl Nephrol Dial Transplant Theor Asp Ren Replace Ther. 2000;15:3–9.
- Stiller S, Mann H. The Donnan effect in artificial kidney therapy. Life support systems: the journal of the European Society for Artificial Organs. 1985;4(4):305–318.
- Locatelli F, La Milia V, Violo L, et al. Optimizing haemodialysate composition. Clin Kidney J. 2015;8:580–589.
- Palmer BF. Individualizing the dialysate in the hemodialysis patient. Semin Dial. 2008;14:41–49.
- Locatelli F, Buoncristiani U, Canaud B, et al. Haemodialysis with on-line monitoring equipment: tools or toys? Nephrol Dial Transpl. 2005;20:22–33.
- Schindler JG, Schindler MM, Herna K, et al. Ion-selective electro-analyser with tubular solid contact flow-through sensors for continuous bioelectrochemically controlled hemodialysis of K+, Na+, Ca2+, Cl- and pH. Biomed Tech (Berl). 1991;36:271–284.
- De Paula FM, Peixoto AJ, Pinto LV, et al. Clinical consequences of an individualized dialysate sodium prescription in hemodialysis patients. Kidney Int. 2004;66:1232–1238.
- Usvyat LA, Barth C, Bayh I, et al. Interdialytic weight gain, systolic blood pressure, serum albumin, and C-reactive protein levels change in chronic dialysis patients prior to death. Kidney Int. 2013;84:149–157.
- Tang H, Wong S, Chu K, et al. Sodium ramping reduces hypotension and symptoms during haemodialysis. Hong Kong Med J. 2006;1212:10–14.
- Kovesdy CP, Regidor DL, Mehrotra R, et al. Serum and dialysate potassium concentrations and survival in hemodialysis patients. Clin J Am Soc Nephrol. 2007;2:999–1007.
- Kyriazis J, Glotsos J, Bilirakis L, et al. Dialysate calcium profiling during hemodialysis: use and clinical implications. Kidney Int. 2002;61:276–287.
- Ogden DA. A double blind crossover comparison of high and low sodium dialysis. Proc Clin Dial Transplant Forum. 1978;8:157–165.
- Bijaphala S, Bell AJ, Bennett CA, et al. Comparison of high and low sodium bicarbonate and acetate dialysis in stable chronic hemodialysis patients. Clin Nephrol. 1985;23:179–183.
- Oliver MJ, Edwards LJ, Churchill DN. Impact of sodium and ultrafiltration profiling on hemodialysis-related symptoms. J Am Soc Nephrol. 2001;12:151–156.
- Gotch FA, Lam MA, Prowitt M, et al. Preliminary clinical results with sodium-volume modeling of hemodialysis therapy. Proc Clin Dial Transplant Forum. 1980;10:12–17.
- Buemi M, Aloisi E, Coppolino G, et al. The effect of two different protocols of potassium haemodiafiltration on QT dispersion. Nephrol Dial Transpl. 2005;20:1148–1154.
- McIntyre CW. Calcium balance during hemodialysis. Semin Dial. 2007;21:38–42.
- Di Iorio B. Relevance of QT dispersion in haemodialysis patients. Nephrol Dial Transpl. 2010;25:1357–9; author reply 1360.
- Drüeke TB, Touam M. Calcium balance in haemodialysis–do not lower the dialysate calcium concentration too much (con part). Nephrol Dial Transpl. 2009;24:2990–2993.
- Kaku Y, Ookawara S, Miyazawa H, et al. New method for the approximation of corrected calcium concentrations in chronic kidney disease patients. Ther Apher Dial. 2016;20:46–52.
- Daugirdas JT, Blake P, Ing TS, et al. Handbook of dialysis, fourth edition. Dial Transpl. 2007;36:322–322.
- Polaschegg H-D. On-line dialyser clearance using conductivity. Pediatr Nephrol. 1995;9: S9–S11.
- Locatelli F. On-line monitoring and convective treatment modalities: short-term advantages. Nephrol Dial Transplant. 1999;14:92–97.
- Locatelli F, Andrulli S, Filippo SD, et al. Effect of on-line conductivity plasma ultrafiltrate kinetic modeling on cardiovascular stability of hemodialysis patients. Kidney Int. 1998;53:1052–1060.
- Petitclerc T. Do dialysate conductivity measurements provide conductivity clearance or ionic dialysance? Kidney Int. 2006;70:1682–1686.
- Gotch FA, Panlilio FM, Buyaki RA, et al. Mechanisms determining the ratio of conductivity clearance to urea clearance. Kidney Int Suppl. 2004;66:S3–S24.
- Bosetto A, Bene B, Petitclerc T. Sodium management in dialysis by conductivity. Adv Ren Replace Ther. 1999;6:243–254.
- Moret KE, Beerenhout CH, Kooman JP. Variations in predialytic plasma conductivity in dialysis patients: effect on ionic mass balance and blood pressure. Asaio J. 2011;57:53–61.
- O’Hayre RP. Fuel cell fundamentals. John Wiley & Sons; 2006. p. 409.
- Levy GB. Determination of sodium with ion-selective electrodes. Clin Chem. 1981;27:1435–1438.
- Cowell DC, Browning DM, Clarke S, et al. Sodium and potassium ion selective electrodes: a review of theory and calibration. Med Lab Sci. 1985;42:252–261.
- Burnett RW, Covington AK, Fogh-Andersen N, et al. Recommendations for measurement of and conventions for reporting sodium and potassium by ion-selective electrodes in undiluted serum, plasma or whole blood. International Federation of Clinical Chemistry and Laboratory Medicine (IFCC). IFCC Sci Div Clin Chem Lab Med. 2000;38:1065–1071.
- Gotch F, Evans M, Metzner K, et al. An on-line monitor of dialyzer Na and K flux in hemodialysis. ASAIO Trans. 1990;36:M359–61.
- Lindsay RM, Schneditz D. Online monitoring and feedback-control, in replacement of renal function by dialysis. Dordrecht: Springer Netherlands; 2004. p. 555–584.
- Oesch U, Ammann D, Simon W. Ion-selective membrane electrodes for clinical use. Clin Chem. 1986;32:1448–1459.
- Mikhelson KN. Ion-selective electrodes. Berlin: Springer; 2013.
- Dimeski G, Badrick T, John AS. Ion Selective Electrodes (ISEs) and interferences-A review. Clin Chim Acta. 2010;411:309–317.
- Bakker E, Pretsch E. Peer reviewed: the new wave of ion-selective electrodes. Anal Chem. 2002;74:420 A–426 A.
- International Electrochemical Commission. Medical electrical equipment-part 2-16: particular requirements for the basic safety and essential performance of haemodialysis, haemodiafiltration and haemofiltration equipment. Geneva (Switzerland): International Electrochemical Commission IEC; 2012.
- Ružička J, Tjell JC. Ion-selective electrodes in continuous-flow analysis. Anal Chim Acta. 1969;47:475–482.
- Rumenjak V, Milardović S, Kruhak I, et al. The study of some possible measurement errors in clinical blood electrolyte potentiometric (ISE) analysers. Clin Chim Acta. 2003;335:75–81.
- Gál G, Gróf J, Kiss E. Continuous monitoring of the efficiency of haemodialysis by recording the UV transmittance of the dialysis solution. Acta Chir Hung. 1983;24:231–239.
- Vasilevski AM, Kornilov NV. Monitoring the dialysis liquid during hemodialysis from the extinction spectra in the UV region. J Opt Technol. 1999;66:692.
- Fridolin I, Magnusson M, Lindberg LG. Measurement of solutes in dialysate using UV absorption. Opt Diagnostics Sens Biol Fluids Glucose Cholest Monit. 2001;2:40–47.
- Uhlin F, Fridolin I, Lindberg L-G, et al. Estimation of delivered dialysis dose by on-line monitoring of the ultraviolet absorbance in the spent dialysate. Am J Kidney Dis. 2003;41:1026–1036.
- Castellarnau A, Werner M, Günthner R, et al. Real-time Kt/V determination by ultraviolet absorbance in spent dialysate: technique validation. Kidney Int. 2010;78:920–925.
- Uhlin F, Fridolin I. Optical monitoring of dialysis dose. Model Control Dial Syst. 2013;2:867–916.
- Cho DS, Olesberg JT, Flanigan MJ, et al. On-line near-infrared spectrometer to monitor urea removal in real time during hemodialysis. Appl Spectrosc. 2008;62:866–872.
- Domingo WR, Klyne W. A photoelectric flame photometer. Biochem J. 1949;45:400–408.
- Baker RW. The determination of calcium in serum by flame photometry. Biochem J. 1955;59:566–571.
- Pungor E. Flame photometry theory. London: D. Van Nostrand Company, Ltd; 1967.
- Anslyn EV. Supramolecular analytical chemistry. J Org Chem. 2007;72:687–699.
- De Silva AP, Moody TS, Wright GD. Fluorescent PET (photoinduced electron transfer) sensors as potent analytical tools. Analyst. 2009;134:2385–2393.
- He H, Mortellaro MA, Leiner MJP, et al. A fluorescent chemosensor for sodium based on photoinduced electron transfer. Anal Chem. 2003;75:549–555.
- He H, Mortellaro MA, Leiner MJP, et al. A fluorescent sensor with high selectivity and sensitivity for potassium in water. J Am Chem Soc. 2003;125:1468–1469.
- He H, Jenkins K, Lin C. A fluorescent chemosensor for calcium with excellent storage stability in water. Anal Chim Acta. 2008;611:197–204.
- Tusa JK, He H. Critical care analyzer with fluorescent optical chemosensors for blood analytes. J Mater Chem. 2005;15:2640.
- OPTI LION Electrolyte Analyzer from OPTI Medical Systems; [cited 2016 Jun 22]. Available from: http://www.optimedical.com/products-services/opti-lion.html
- Englich FV, Foo TC, Richardson AC, et al. Photoinduced electron transfer based ion sensing within an optical fiber. Sensors (Basel). 2011;11:9560–9572.
- Cremers DA, Multari RA, Knight AK. Laser-induced breakdown spectroscopy. Encycl Anal Chem. New York: Wiley; 2000;11.
- Radziemski L, Cremers D. A brief history of laser-induced breakdown spectroscopy: from the concept of atoms to LIBS 2012. Spectrochim Acta Part B At Spectrosc. 2013;87:3–10.
- Knopp R, Scherbaum FJ, Kim JI. Laser induced breakdown spectroscopy (LIBS) as an analytical tool for the detection of metal ions in aqueous solutions. Anal Bioanal Chem. 1996;355:16–20.
- Rehse SJ, Salimnia H, Miziolek AW. Laser-induced breakdown spectroscopy (LIBS): an overview of recent progress and future potential for biomedical applications. J Med Eng Technol. 2012;36:77–89.
- Laser Induced Breakdown Spectroscopy (LIBS) - Ocean Optics; [cited 2016 Jun 22]. Available from: http://oceanoptics.com/product/laser-induced-breakdown-spectroscopy-libs/
- Rakovský J, Čermák P, Musset O, et al. A review of the development of portable laser induced breakdown spectroscopy and its applications. Spectrochim Acta Part B At Spectrosc. 2014;101:269–287.
- Klomp D, Wieringa F, Van Beijnum F, et al. LIBS SENSOR FOR IN-LINE K+, Na+ and Ca2+ MONITORING, in ERA-EDTA. Amsterdam: 51st ERA-EDTA Congress; 2014.
- Wieringa FP. 61st Annual Conference of American Society for Artificial Internal Organs (ASAIO) “Ion Selective Sensing” The Netherlands: TNO Science & Industry, Lecture during ASAIO; 2015.
- Daniel S. Cardiovascular protection: how to balance benefit/risk by fluid and electrolytes management. In: 53rd Congress ERA-EDTA, Vienna. 2016.
- BWB Technologies. Available from: http://www.bwbtech.com/bwb_xp_flame_photometers_products.htm
- Measurement of Dialysis Adequacy. Available from: http://ldiamon.eu/products/measurement-of-dialysis-adequacy/
- Abeysinghe DC, Dasgupta S, Jackson HE, et al. Novel MEMS pressure and temperature sensors fabricated on optical fibers. J Micromech Microeng. 2002;12:229–235.
- Qin D, Xia Y, Whitesides GM. Soft lithography for micro- and nanoscale patterning. Nat Protoc. 2010;5:491–502.
- Whitesides GM. The origins and the future of microfluidics. Nature. 2006;442:368–373.
- El-Ali J, Sorger PK, Jensen KF. Cells on chips. Nature. 2006;442:403–411.
- Chin CD, Linder V, Sia SK. Commercialization of microfluidic point-of-care diagnostic devices. Lab Chip. 2012;12:2118–2134.
- Soper SA, Brown K, Ellington A, et al. Point-of-care biosensor systems for cancer diagnostics/prognostics. Biosens Bioelectron. 2006;21:1932–1942.
- Evenhuis CJ, Guijt RM, Macka M, et al. Determination of inorganic ions using microfluidic devices. Electrophoresis. 2004;25:3602–3624.
- Wang J, Chen G, Muck A. Movable contactless-conductivity detector for microchip capillary electrophoresis. Anal Chem. 2003;75:4475–4479.
- Erickson KA, Wilding P. Evaluation of a novel point-of-care system, the i-STAT portable clinical analyzer. Clin Chem. 1993;39:283–287.
- Jacobs E, Vadasdi E, Sarkozi L, et al. Analytical evaluation of i-STAT portable clinical analyzer and use by nonlaboratory health-care professionals. Clin Chem. 1993;39:1069–1074.
- Gault MH, Harding CE. Evaluation of i-STAT portable clinical analyzer in a hemodialysis unit. Clin Biochem. 1996;29:117–124.
- Liao WY, Weng CH, Bin Lee G, et al. Development and characterization of an all-solid-state potentiometric biosensor array microfluidic device for multiple ion analysis. Lab Chip. 2006;6:1362–1368.
- Johnson RD, Gavalas VG, Daunert S, et al. Microfluidic ion-sensing devices. Anal Chim Acta. 2008;613:20–30.
- Qu S, Chen X, Chen D, et al. Poly(methyl methacrylate) CE microchips replicated from poly(dimethylsiloxane) templates for the determination of cations. Electrophoresis. 2006;27:4910–4918.
- Kuswandi B, Huskens NJ, Verboom W. Optical sensing systems for microfluidic devices: A review. Anal Chim Acta. 2007;601:141–155.
- Götz S, Karst U. Recent developments in optical detection methods for microchip separations. Anal Bioanal Chem. 2006;387:183–192.
- Song F, Xiao J, Seo S-W. Heterogeneously integrated optical system for lab-on-a-chip applications. Sensors Actuators A Phys. 2013;195:148–153.
- Caglar P, Tuncel SA, Malcik N, et al. A microchip sensor for calcium determination. Anal Bioanal Chem. 2006;386:1303–1312.
- Chabinyc ML, Chiu DT, McDonald JC, et al. An integrated fluorescence detection system in poly(dimethylsiloxane) for microfluidic applications. Anal Chem. 2001;73:4491–4498.
- Liu B-F, Ozaki M, Utsumi Y, et al. Chemiluminescence detection for a microchip capillary electrophoresis system fabricated in poly(dimethylsiloxane). Anal Chem. 2003;75:36–41.
- Jin Z, Su Y, Duan Y. An improved optical pH sensor based on polyaniline. Sensors Actuators B Chem. 2000;71:118–122.
- Cote GL, Fox MD, Northrop RB. Noninvasive optical polarimetric glucose sensing using a true phase measurement technique. IEEE Trans Biomed Eng. 1992;39:752–756.
- Sharma M, Frijns A, Mandamparambil R, et al. A spectroscopic technique for local temperature measurement in a micro-optofluidic system. IEEE Sens J. 2016;16:5232–5235.
- Destandau E, Lefèvre JP, Chouai Fakhr Eddine A, et al. A novel microfluidic flow-injection analysis device with fluorescence detection for cation sensing. Application to potassium. Anal Bioanal Chem. 2007;387:2627–2632.
- Shih T-K, Chen C-F, Ho J-R, et al. Fabrication of PDMS (polydimethylsiloxane) microlens and diffuser using replica molding. Microelectron Eng. 2006;83:2499–2503.
- Camou S, Fujita H, Fujii T. PDMS 2D optical lens integrated with microfluidic channels: principle and characterization. Lab Chip. 2003;3:40.
- Ateya DA, Erickson JS, Howell PB, et al. The good, the bad, and the tiny: a review of microflow cytometry. Anal Bioanal Chem. 2008;391:1485–1498.
- Mogensen KB, Klank H, Kutter JP. Recent developments in detection for microfluidic systems. Electrophoresis. 2004;25:3498–3512.
- Estevez MC, Alvarez M, Lechuga LM. Integrated optical devices for lab-on-a-chip biosensing applications. Laser Photon Rev. 2012;6:463–487.
- Mogensen KB, Eriksson F, Gustafsson O, et al. Pure-silica optical waveguides, fiber couplers, and high-aspect ratio submicrometer channels for electrokinetic separation devices. Electrophoresis. 2004;25:3788–3795.
- Chabinyc ML, Chiu DT, McDonald JC, et al. An integrated fluorescence detection system in poly(dimethylsiloxane) for microfluidic applications. Anal Chem. 2001;73:4491–4498.
- Hofmann O, Wang X, Cornwell A, et al. Monolithically integrated dye-doped PDMS long-pass filters for disposable on-chip fluorescence detection. Lab Chip. 2006;6:981–987.
- Faye D, Lefevre J-P, Delaire JA, et al. A selective lead sensor based on a fluorescent molecular probe grafted on a PDMS microfluidic chip. J Photochem Photobiol Chem. 2012;234:115–122.
- Hisamoto H, Yasuoka M, Terabe S. Integration of multiple-ion-sensing on a capillary-assembled microchip. Anal Chim Acta. 2006;556:164–170.
- Hisamoto H, Nakashima Y, Kitamura C, et al. Capillary-assembled microchip for universal integration of various chemical functions onto a single microfluidic device. Anal Chem. 2004;76:3222–3228.
- Greenwood RN, Aldridge C, Cattell WR. Serial blood water estimations and in-line blood viscometry: the continuous measurement of blood volume during dialysis procedures. Clin Sci. 1984;66:575–583.
- Oda M, Hokama S, Sugaya K, et al. New blood volume monitoring method for hemodialysis: A-V pressure gradient measurement by synchronized one-point reading. Artif Organs. 2004;28:683–689.
- Chamney PW, Krämer M, Rode C, et al. A new technique for establishing dry weight in hemodialysis patients via whole body bioimpedance. Kidney Int. 2002;61:2250–2258.
- Maeda K, Shinzato T, Yoshida F, et al. Newly developed circulating blood volume-monitoring system and its clinical application for measuring changes in blood volume during hemofiltration. Artif Organs. 1986;10:452–459.
- Dormanesh B, Tofangchiha S, Abouei V, et al. Design and construct an optical device to determine relative blood volume in patients undergoing hemodialysis. Iran Red Crescent Med J. 2014;16:e15603.
- Adimea Real-time monitoring of the dialysis dose for optimising the treatment quality; [cited 2016 Jun 22]. Available from: http://www.bbraun-dialysis.com/cps/rde/xchg/av-dialysis-en-int/hs.xsl/products.html?id=00020743840000000002&prid=PRID00005208
- Xia Y, Kim E, Whitesides GM. Micromolding of polymers in capillaries : applications in microfabrication. Chemistry of Materials. 1996;8(7):1558–1567.
- Kooman JP, Joles JA, Gerritsen KG. Creating a wearable artificial kidney: where are we now? Expert Rev Med Devices. 2015;12:373–376.