
 ?Mathematical formulae have been encoded as MathML and are displayed in this HTML version using MathJax in order to improve their display. Uncheck the box to turn MathJax off. This feature requires Javascript. Click on a formula to zoom.
ABSTRACT
Introduction: Peripheral arterial disease (PAD) may cause symptoms due to impaired tissue perfusion of the lower extremity. So far, assessment of PAD is mainly performed by determination of stenosis or occlusion in the large arteries and does not focus on microcirculation. Several diagnostic techniques have been recently introduced that may enable tissue perfusion measurements in the lower limb; however, most have not yet been implemented in clinical daily practice. This systematic review provides an overview of these diagnostic techniques and their ability to accurately detect PAD by peripheral tissue perfusion.
Areas covered: A literature search was performed for articles that described a diagnostic technique to determine tissue perfusion in patients with known PAD compared with healthy controls.
Expert opinion: So far, transcutaneous oxygen measurements are most often used to measure tissue oxygenation in PAD patients, but evidence seems too low to define this technique as a gold standard, and implementing this technique for home monitoring is difficult. New potentially suitable diagnostic tests should be non-invasive, contact-free, and quick. Further research is needed for all of these techniques before broad implementation in clinical use is justified, in hospital, and for home monitoring.
1. Introduction
Peripheral arterial disease (PAD) is a common disease [Citation1–Citation4]. The number of people with PAD worldwide has increased by 24% in the past 10 years [Citation5]. Patients with PAD often suffer from decreased mobility, severe pain, lower quality of life, and multiple morbidities. Within 10 years after being diagnosed with PAD, 2% of the patients will undergo major limb amputation [Citation3]. The first symptomatic stage of PAD is usually manifested by intermittent claudication, which progresses into chronic limb-threatening ischemia (CLI) in 15% of these patients. PAD does not progress linearly from claudication to CLI in every patient. Sometimes patients develop CLI without ever having claudication. Accurate and easy accessible diagnostic techniques are necessary for early detection and treatment of PAD.
Many invasive and non-invasive techniques are available for assessing diminished arterial inflow of blood caused by PAD. The ankle/brachial index (ABI) is clinically the most used non-invasive measurement [Citation2,Citation4,Citation6]. Other non-invasive diagnostic methods include Doppler color ultrasound imaging, toe systolic blood pressure, and the treadmill test [Citation7]. Besides non-invasive diagnostics, more invasive techniques using intravenous contrast agents are performed for detection of stenosis or occlusion of the macrovasculature, such as computed tomography angiography (CTA), digital subtraction angiography (DSA), or magnetic resonance angiography (MRA). All these techniques, however, focus on blood flow in the larger arteries of the lower extremity and are not able to assess the microcirculation and saturation of peripheral tissue.
Several techniques have been recently introduced that may enable tissue perfusion measurements in the lower extremity. Studies with non-invasive techniques include hyperspectral imaging (HSI), laser Doppler perfusion imaging (LDPI), laser speckle contrast imaging (LSCI), near-infrared (NIR) spectroscopy (NIRS), spectrophotometry, transcutaneous oxygen measurements (TcPo2) and vascular optical tomography imaging (VOTI). Other diagnostic techniques using endogenous or exogenous contrast agents include magnetic resonance perfusion imaging (MRI perfusion), contrast-enhanced ultrasound (CEUS) and NIR fluorescence imaging with indocyanine green (ICG). All of these techniques focus on assessment of the microcirculation of the skin or muscle in the lower extremity, but act on different mechanisms.
The aim of this systematic review is to provide an overview of diagnostic techniques that are currently available to determine tissue perfusion in patients with PAD and healthy controls. We will discuss the techniques according to their ability and quality assessment to detect PAD when tissue perfusion in healthy controls is compared with patients with known PAD.
2. Methods
This systematic review was conducted in accordance to the Preferred Reporting Items for Systematic Review and Meta-Analysis (PRISMA) statement [Citation8]. The review protocol was prospectively registered in the PROSPERO database.
2.1. Literature search
Four electronic databases were searched for eligible articles: PubMed, EMBASE, CINAHL, and Cochrane Central Register of Controlled Trials. The search was performed with the help of Medical Subject Headings terms for “peripheral arterial disease’’, “diagnostic techniques’’, “microcirculation’’ and “lower extremity’’. The complete search strategy is available in Appendix 1. Studies published between January 2009 and January 2019 were considered. Titles and abstracts of the studies were independently reviewed by two authors (KFM, SFK), blinded to the authors and journal titles. Items in which there was disagreement were discussed by the two screeners. Articles considered for inclusion were independently reviewed by the two authors, and consensus was reached for inclusion. If consensus could not be reached, adjudication from a third author (JPdV) was sought.
2.2. Selection criteria
Articles were eligible if they included a diagnostic technique to determine tissue perfusion. Selected studies had to determine tissue perfusion in patients with PAD and compare this to tissue perfusion in healthy controls. The included articles were published in English, included human subjects, and had a full text available.
Exclusion criteria were case reports, case-series studies, studies with fewer than 10 participants, reviews, commentaries, letters to the editor, or conference abstracts. Studies investigating the correlation between tissue perfusion and clinical outcomes without comparison to healthy controls were excluded, as were studies investigating the use of tissue perfusion measurements to determine effect of treatment. Studies using hyperemia and exercise testing before the measurements of tissue perfusion were excluded, except for studies describing baseline measurements before hyperemia or exercise testing.
2.3. Data extraction and quality assessment
Study details were extracted from the articles using a predefined abstract form and categorized according to diagnostic tests for measuring tissue perfusion. The following data were extracted: study design, number of patients and healthy controls, the method of assessing PAD, characteristics of the measurement protocol, and outcome. The outcome of interest was the differences in tissue perfusion between PAD patients and healthy controls. The technical properties and clinical application within PAD are described for each technique. Statistical comparison and accuracy of the diagnostic techniques was scored if available in the included studies. Data were collected using Review Manager 5.3. software (The Nordic Cochrane Centre, the Cochrane Collaboration, 2014, Copenhagen, Denmark). Quality assessment of the studies was performed according to the Quality Assessment of Diagnostic Accuracy studies (QUADAS-2) method [Citation9].
3. Description of techniques and main results
The search resulted in 3129 records, of which 859 were duplicates or irrelevant to the topic. After detailed evaluation of the titles and abstracts, 205 articles were selected for full-text assessment. After assessment of these 205 articles, 20 articles were found to be eligible for inclusion. Of the remainder, 89 were excluded because no comparison was made between PAD and healthy controls, 58 could not be assessed because only an abstract was available, 20 articles were excluded due to the use of hyperemia or exercise testing, and 18 articles for other reasons. The review process is outlined in detail in .
Figure 1. Flowchart for the selection process of included studies.
Studies are categorized according to the diagnostic technique. In , data extraction is provided for perfusion measurement techniques that were investigated in more than two studies in the literature. These techniques will be described in more detail in the text. summarizes the diagnostic techniques that are described in fewer than two studies. In two articles, Chiang et al. [Citation10] and Pawlaczyk et al. [Citation11], not one but two different perfusion measurement techniques are described. Bias and quality assessment with Quadas-2 is shown in and , respectively.
Table 1. Overview of the diagnostic techniques with more than two studies, CEUS, MRI perfusion, NIRS and TcPO2.
Table 2. Overview of the diagnostic techniques with less than three studies, HSI, LDPM, LSCI, ICG, spectrophotometry and VOTI.
Figure 2. Bias and quality assessment of the included studies according to QUADAS-2.
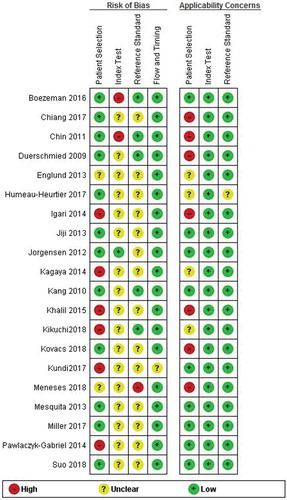
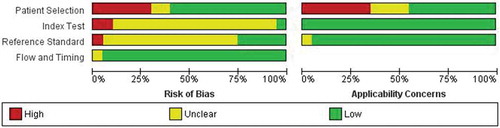
Figure 3. Graphical display is bias and quality assessment according to QUADAS-2.
3.1. CEUS assessment
3.1.1. Technical background
CEUS uses microbubbles to assess the microvascular blood flow in patients with PAD. The microbubbles increase the intensity of Doppler signals from the blood for several minutes after injection and are 1000 times more reflective than body tissue. They can expand and contract through pressure changes of sound waves of the ultrasound beam and vibrate strongly especially at high frequencies [Citation13]. The microbubbles, with a diameter that varies between 1 and 5 µ, cannot penetrate the endothelium but are able to traverse the microcirculation [Citation14].
3.1.2. Application within PAD
Three prospective studies investigated the use of CEUS in PAD, as reported in . Duerschmied et al. [Citation15], Kundi et al. [Citation14], and Meneses et al. [Citation16] published prospective cohort studies and used different types of microbubble contrast agents. These three studies measured muscle perfusion, but on different spots at the lower limb.
Duerschmied et al. [Citation15] analyzed time intensity curves and compared the time to peak (TTP) intensities between 58 healthy controls and 52 patients with PAD. The TTP intensity is the duration from the increase in contrast density until its peak. They showed a significant difference between these two groups (36.9 seconds versus 18.9 seconds, p < 0.001).
Kundi et al. [Citation14] included 13 patients with PAD and 8 healthy controls. TTP and peak perfusion (PEAK) at rest were not significantly different between PAD patients and healthy controls.
Meneses et al. [Citation16] determined whole-leg blood flow and vascular conductance in both groups sitting and when supine. Both positions showed no significant difference at rest in PAD patients versus healthy controls.
3.2. MRI perfusion
3.2.1. Technical background
MRI is capable of producing three-dimensional detailed anatomical imaging by measuring the interaction between an external magnetic field and protons within the body after applying radiofrequency pulses. MRI perfusion imaging is facilitated by means of exogenous and endogenous contrast agents. Contrast-enhanced perfusion techniques measure the T1 or T2/T2* effect of paramagnetic contrast agents, such as gadolinium, on tissue using T1- or T2-weighted imaging sequences [Citation17].
Arterial spin labeling (ASL), blood oxygen level-dependent (BOLD) imaging, and intravoxel incoherent motion (IVIM) are perfusion techniques that do not require administration of an exogenous contrast agent. In ASL, arterial blood is used as an endogenous contrast agent by magnetically labeling the inflowing blood with radiofrequency pulses. Perfusion contrast is given by the difference in magnetization between a labeled and unlabeled control image induced by the exchange of magnetization at tissue level [Citation18]. Because most ASL MRI techniques acquire the perfusion-weighted images at a fixed time after the initial labeling of the arterial blood, it might be that the magnetic label may not reach the imaging plane, leading to an underestimation of peripheral blood flow. BOLD MRI has been based on the paramagnetic properties of deoxyhemoglobin as an intrinsic contrast agent [Citation19]. An increase of tissue perfusion results in a higher oxyhemoglobin and lower deoxyhemoglobin concentration in the small vessels and local microcirculation of PAD patients. IVIM is based on diffusion-weighted imaging (DWI) using different b-values to measure the signal intensity of diffusion. Quantitative parameters, such as the diffusion coefficient, pseudodiffusion coefficient, and the relative perfusion fraction, can be calculated [Citation20].
3.2.2. Application within PAD
Three prospective studies were found describing the use of MRI perfusion in PAD, as reported in . Jiji et al. [Citation21] included 11 patients with PAD (ABI >0.4 and <0.9) and 16 healthy controls to determine the reproducibility and utility of measurements at rest by contrast-enhanced calf perfusion MRI. They generated a time intensity curve, whereby the slope of the curve represented the tissue function. Results showed no difference in tissue function between patients with PAD and healthy controls.
Englund et al. [Citation22] used ASL and BOLD imaging to assess tissue perfusion in the skeletal muscle of 10 individuals (five patients with PAD and five healthy controls). The method that they used was called Perfusion, Intravascular Venous Oxygen, and T2* (PIVOT) and mean baseline T2* values showed a 1 ms difference (not significant) between patients suffering from PAD versus healthy controls.
Suo et al. [Citation23] integrated ASL, BOLD and IVIM MRI imaging in a single-experimental setup and investigated the ability of these techniques to diagnose and asses the severity of PAD. They included 14 patients with PAD and 10 healthy controls. Baseline T2* values of BOLD MRI (ms), ASL-blood flow (mL/100 g/min) and IVIM-f (%) were specified for different muscle groups between age-matched healthy controls and patients with PAD. According to Suo et al. [Citation23] T2* was the only perfusion-related parameter that showed significant differences between age-matched healthy controls and patients with PAD. Values derived from four muscle groups in the lower extremity are provided in .
3.3. Near-infrared spectroscopy
3.3.1. Technical background
NIRS is a non-invasive technique to determine muscle tissue oxygenation [Citation24–Citation26]. Wavelengths of red and NIR laser light illuminate the tissue at a depth of 1 to 3 cm, depending on the device used. The devices consist of a laser light source and photo detectors. The light is partly absorbed and scattered by the examined tissue, and the light that is reflected back is recorded by the detectors. NIRS uses the absorption spectra of the tissue chromophores oxyhemoglobin and deoxyhemoglobin to calculate the tissue saturation. These values can be expressed as tissue oxygen saturation (Sto2), regional hemoglobin oxygen saturation (rSo2) or skeletal muscle oxygen saturation (Smo2) [Citation27–Citation30].
3.3.2. Application within PAD
Four prospective cohort studies investigated the use of NIRS in PAD. Mesquita et al. [Citation28] studied NIRS in 26 patients with PAD and 31 healthy controls. PAD assessment was done with ABI, and participants were categorized in a healthy group (ABI >0.9), and two patient groups: mild PAD (ABI >0.7 to <0.9) and severe PAD (ABI >0.3 to <0.7). Results show that Sto2 was significantly lower in patients with PAD than in healthy controls (severe PAD: 54.2, mild PAD: 53.0 versus 63.5 in controls; p < 0.05).
Kagaya et al. [Citation29] investigated 20 patients with PAD and 20 healthy controls. Assessment of PAD was done according to Rutherford classification. Only patients with Rutherford 4, 5, or 6 were included. Results show significantly lower Sto2 values in patients with PAD compared with healthy controls.
Boezeman et al. [Citation27] studied 61 patients with PAD and 30 healthy controls. Assessment of PAD was performed by diagnostic imaging, and afterward, patients were categorized in Fontaine classification 3 or 4. Results showed significantly lower rSo2 at all but one of the examined area’s on the lower extremity and upper arm (). The area of the proximal part of the upper leg was not suitable for examination because of the thickness of the skin.
Miller et al. [Citation30] included eight patients with PAD and eight healthy controls. PAD was assessed by an ABI <0.9, and all patients were classified as Fontaine 2. The results of this study showed no significant difference in Smo2 between PAD patients and healthy controls.
3.4. Transcutaneous oxygen measurements
3.4.1. Technical background
TcPo2 is a non-invasive imaging method to quantify skin oxygenation. The Clark electrode that is used is based on amperometry and consists of several components: a voltage source, an electron receiver, an electron donor, an electrolyte solution, and a permeable membrane. The electron donor is placed in the electrolyte solution to produce electrons. The electrode can be heated from 37°C to 45°C on the skin surface, which causes capillaries to dilate and oxygen to be released. The higher the oxygen in the tissue, the more oxygen reacts with the electrons at the electron receiver and Po2 can be measured [Citation31]. TcPo2 has been claimed to predict wound healing and asses PAD [Citation10].
3.4.2. Application within PAD
Three prospective cohort studies investigated the use of TcPo2 in PAD. Pawlaczyk et al. [Citation11] included 79 patients with Rutherford classes 0 to 1, 137 patients with Rutherford classes 3 to 4, and 27 healthy controls. TcPo2 was significantly lower in patients with PAD compared with healthy controls (class 0 to 1: 19.76 ± 12.2, class 3 to 4: 47.54 ± 14.86 versus 64.30 ± 7.25 in controls; p < 0.001).
Chiang et al. [Citation10] focused on the comparison of different techniques, including TcPo2 measurements. This prospective study included 150 PAD patients and 20 healthy controls. The PAD patients were subdivided according to Rutherford classification. TcPo2 and TcPco2 values were stated for PAD patients and healthy controls; however, a statistical comparison between the groups was not performed.
The third included study, by Kovacs et al. [Citation32], showed significantly lower values for PAD patients compared with healthy controls (42 ± 15 versus 55 ± 9; p < 0.005). The authors measured Doppler ultrasound, TcPo2, and toe pressure at rest and after exercise in 120 patients with PAD and 30 healthy controls.
3.5. Hyperspectral imaging
3.5.1. Technical background
HSI determines spectroscopy values of oxyhemoglobin and deoxyhemoglobin [Citation33–Citation36]. Wavelengths of visible light illuminate and penetrate the upper 1 to 2 mm of the skin. A spectrometer within the camera collects the light that is reemitted by the skin [Citation37]. From the collected light, data are represented as a hypercube [Citation33]. Each pixel in a hypercube represents the local reflectance spectrum of the tissue at a specific location with a size of 0.1 mm. From these differences in absorption spectra, spectroscopy can be performed to determine oxygenation levels of the tissue.
3.5.2. Application within PAD
Two prospective cohort articles investigating tissue perfusion with the OxyVu Hyperspectral imaging Tissue Oxygenation Mapping System (HyperMed Inc. Memphis, TN) have been published [Citation10,Citation38]. The authors used a skin target with an area of 204 mm2 and calculated the oxyhemoglobin and deoxyhemoglobin values in a region of interest of 1 cm around the target [Citation35,Citation39,Citation40]. Overall oxygen saturation of the skin is calculated as oxy/(oxy+deoxy) × 100%. Chiang et al. [Citation10] compared hyperspectral oxygen saturations with TcPo2 and TcPco2 values and showed a strong relationship between deoxyhemoglobin and TcPco2 (p = 0.0001).
3.6. Laser Doppler perfusion monitoring
3.6.1. Technical background
Laser Doppler perfusion monitoring (LDPM) uses NIR laser light with a wavelength of 780 nm to measure tissue perfusion of the skin [Citation11,Citation41]. The penetration depth of the laser is approximately 0.3 to 0.5 mm [Citation42]. The light is scattered or partly absorbed by the skin and subcutaneous tissue. The light that is reflected by the red blood cells will change due to the Doppler effect [Citation43]. The frequency of the light is changed by the reflection and detected with use of an optical fiber. The measurements of the skin microcirculatory blood flow are expressed in perfusion units (PU) [Citation44].
3.6.2. Application within PAD
One prospective study has been published using LDPM, as listed in . Pawlacyzk et al. [Citation11] studies LDPM in 216 patients with PAD and 27 healthy controls. Results showed no significant differences between patients with varying Rutherford degrees and healthy controls.
3.7. Laser speckle contrast imaging
3.7.1. Technical background
LSCI is based on laser light to visualize the microcirculation of the skin [Citation43,Citation45–Citation47]. Light is scattered back from the skin, creating an interference pattern called a laser speckle pattern. The speckle pattern images changes in time, mainly due to the flow of red blood cells in the microcirculation [Citation48]. This leads to blurring of the speckle pattern, which will cause change in laser speckle contrast. The images are recorded, and the blood perfusion can be expressed as an arbitrary unit, PU, or LSCI index [Citation45]. An additional parameter that can be calculated from LSCI is the beat strength of skin perfusion (BSSP). This is an average amplitude of dynamic cutaneous blood flow changes, synchronized with heart beats [Citation46].
3.7.2. Application within PAD
Two prospective studies investigated the use of LSCI in PAD. The details are reported in . Both studies concluded that LSCI values were significantly lower in PAD patients compared with healthy controls in every measured location on the foot.
3.8. NIR fluorescence imaging with ICG
3.8.1. Technical background
The principle of fluorescence imaging is to illuminate contrast agents, for example ICG with an absorption maximum at 800 nm. The region of interest in a tissue is illuminated with NIR light at a wavelength of 750 to 800 nm while observing with the camera at longer wavelengths (700–900 nm) [Citation49,Citation50].
3.8.2. Application within PAD
Two articles have been published on NIR fluorescence imaging with ICG as a contrast agent. One was a retrospective cohort study [Citation51] and the other a clinical pilot study [Citation52].
Igari et al. [Citation51] included 14 patients with PAD and 9 patients without PAD to evaluate the accuracy of ICG angiography to diagnose PAD. Quantitative parameters, such as the magnitude of intensity from ICG onset to the maximum intensity (Imax) and the half value of the maximum intensity (T1/2), showed no significant difference between PAD and controls. However, the time from ICG onset to maximum intensity (Tmax), the time elapsed from the maximum intensity to 90% of the Imax and to 75% of the Imax (Td 90% and Td 75%), and the rate of intensity measured 60 sec after the Tmax to the Imax (IR 60 seconds) were significantly different. The authors investigated the accuracy of the diagnostic technique and showed a sensitivity of 82.6% and specificity of 73.3% after setting the highest diagnostic value of Td 90% as the cutoff (25 seconds).
Kang et al. [Citation52] showed a sensitivity of 92% and a specificity of 90% with a set value of 24.4%/min perfusion rate as the cutoff. They included 34 participants (10 healthy controls and 24 PAD patients) and found significantly higher values for healthy controls than for PAD patients.
3.9. Spectrophotometry
3.9.1. Technical background
Spectrophotometry, or micro-lightguide spectrophotometry is a non-invasive technique for determining microcirculation in the skin by means of continuous white and laser light [Citation53,Citation54]. The white light that is scattered by the tissue chromophores and the wavelength-dependent absorption spectra are both recorded [Citation55]. The amount of reflected laser light is changed by the movement of red blood cells and collected to determine blood flow. The spectrophotometry determines the oxygen saturation, which is expressed as an arbitrary unit (So2) [Citation56].
3.9.2. Application within PAD
One prospective cohort study was found in the literature search [Citation56]. Details are provided in . Results showed that So2 was significantly lower in patients with PAD than in healthy controls. There were no significant differences between the groups.
3.10. Vascular optical tomography imaging
3.10.1. Technical background
VOTI is a non-invasive, contrast-free imaging modality that uses NIR light to illuminate the tissue of interest. Back-scattered light and light that is transmitted through the foot is captured by a detector. Spatial maps of hemoglobin can be produced, which can be translated to total hemoglobin (HbT) time traces within a region of interest.
3.10.2. Application within PAD
One diagnostic pilot study by Khalil et al. [Citation57] describes the use of VOTI in PAD in a pilot study of 10 PAD patients and 20 healthy controls. No statistical analyses were performed in rest.
4. Discussion
Assessment of microcirculation is essential to diagnose PAD, because symptoms of chronic limb-threatening ischemia are a direct result of insufficient tissue perfusion. However, the decision making in treatment of PAD patients is still mainly based on diagnostics regarding the macrovasculature. Also, the post-treatment follow-up is focused on patency of the large lower limb arteries and less on the status of the microcirculation.
This systematic review provides an overview of the current available diagnostic techniques to determine tissue perfusion in PAD patients and healthy controls. We identified 20 studies describing 10 different techniques. Comparing results and drawing firm conclusions is difficult because of substantial heterogeneity in different aspects, such as inclusion criteria, diagnosis and severity of PAD, vascular risk factors, and comorbidity of patients, and the selection of healthy controls. Another limitation is that most of the studies included a (too) small number of patients and controls, except for the studies with focus on TcPo2 measurements. To compare new diagnostic techniques, such as HSI and LSCI with TcPo2 more large prospective cohort trials should be performed. 13 of the 20 studies are at risk of bias when assessing the index test and reference standard. The reason for this is that in these studies no details were provided who performed the index test and reference standard and whether these measurements were performed blinded.
It is also important to consider the different technical working mechanisms of the diagnostic techniques described in this systematic review. Most of these techniques measure the blood flow or blood circulation in a specific region of interest in tissue. Examples are contrast-enhanced ultrasound, MRI perfusion, laser Doppler perfusion monitoring, LSCI, NIR fluorescence imaging with ICG, and spectrophotometry. For the measurement of tissue composition or the concentration of oxyhemoglobin and deoxyhemoglobin NIRS, hyperspectral imaging, VOTI, or TcPo2 measurements should be used. Local skin temperature is a result of various physiological factors, such as blood flow, blood circulation, tissue composition and oxygen saturation, and may therefore also indicate tissue perfusion. However, this review was limited to techniques that are indicative for one of these physiological factors. Thermal imaging, which can be measured with various techniques, including microwave radiometry thermometry [Citation58] or infrared thermography [Citation59] is therefore not included in this systematic review.
Another important difference between the diagnostic devices is the penetration depth of the techniques. Most of the techniques enable determination of the superficial skin perfusion such as TcPO2, HSI, NIRS, LDPM, LSCI, Near-infrared fluorescence imaging with ICG, spectrophotometry and VOTI. These perfusion measurements are different from the techniques such as CEUS, MRI and NIRS, that have a greater penetration depth and therefore measure muscle perfusion.
Tissue perfusion at rest in skeletal muscle in the limb is quite low and difficult to measure for most of these techniques. A method to increase flow such as cuff occlusion, hyperemia or exercise can be necessary to increase sensitivity to differences between patients with PAD and healthy controls. However, hyperemia or exercise testing can be performed in many different ways, which lead to an increase in heterogeneity of the diagnostic values to determine tissue perfusion in patients with PAD. Therefore, manuscripts focusing only on measurements under hyperemic conditions or exercise were excluded from this review. Manuscripts including measurements at rest as well as under hyperemic conditions have been included.
TcPo2 is often seen as the gold standard to measure tissue oxygenation. This technique is applied in several medical fields, including pediatric intensive care and diabetic foot ulcers [Citation10,Citation60]. So far, it seems reliable in differentiation between PAD patients and controls, although the total number of included controls was <70. However, TcPo2 also has some limitations; for example, the intra-operator variability of TcPo2 measurements is 10% [Citation10]. Besides, measurements depend on the heating of the Clark electrode, which makes these measurements time-consuming, especially when examination of multiple locations at the lower extremity and foot are mandatory. Moreover, this technique seems less suitable to be used in home setting, which maybe an important feature given that telemonitoring will increase in next few years, especially in older frail patients.
The other techniques are still in their infancy regarding tissue perfusion determination and have some limitations.
One of the limitations of NIRS is the measurement of locations with more adipose tissue, which can cause inaccurate values [Citation27]. NIRS is also limited by tissue infection and inflammation. Furthermore, outcome values of NIRS are sensitive to both oxygen delivery and oxygen extraction [Citation30]. In PAD, using contact-free methods, such as HSI, LSCI, or MRI, may be preferable, especially when patients have foot ulcers. MR BOLD imaging is the most reliable technique to detect and stratify microvascular function at rest in PAD patients [Citation23]. Disadvantages of BOLD MRI are the limited availability and the high costs [Citation61]. In addition, patients are positioned in a cylindrical tube with high noise levels, which can cause claustrophobia [Citation62]. However, MRI enables visualization of 3D images in contrast to HSI and LSCI, both of which produce a two-dimensional color-coded map to examine the tissue perfusion in the foot [Citation10,Citation46].
HSI and LSCI devices are easy to use and can be applied at the patient’s bedside. One of the limitations of LSCI is the measurement of tissue perfusion at the dorsum of the foot. Most patients have a curvature that causes a reduced reflection of the laser, which results in inaccurate measurements [Citation46]. This is not the case in other techniques such as, CEUS and fluorescence imaging. However, these techniques use a contrast agent, by which the distribution of the contrast agent is dependent on for example, cardiac output [Citation15]. Nevertheless, development of these techniques is highly important to focus on a more accurate diagnostic method to measure tissue perfusion in patients with PAD.
5. Expert opinion
This review evaluated 10 diagnostic techniques for tissue perfusion measurements to determine their ability to diagnose PAD and chronic limb-threatening ischemia. Some of the devices show promising results, but the amount of evidence available is still insufficient to enable the routine implementation of any of the devices in clinical practice at this point.
Before a specific tissue perfusion measurement will be implemented on a large scale, it must meet a number of needs. First, it should determine tissue perfusion precisely and accurately with low intra-observer and inter-observer variability. Next, it should preferably be a noninvasive technique that, is contact free and low in cost. Last, it should be a device that can easily be used in the clinical setting as well as in the home setting. A diagnostic technique that complies with all of these conditions could be used to determine the severity of PAD and would be able to monitor tissue perfusion throughout the total treatment process.
When PAD is diagnosed based on clinical symptoms and a significant stenosis on CTA or MRA, tissue perfusion measurements should additionally be performed to determine the microcirculation, especially around ulcers and ischemic wounds. Tissue perfusion measurements after revascularization are also important, because a technically successful revascularization does not always lead to clinical improvement such as pain relief or ulcer healing.
Home monitoring or telemedicine will evolve over the coming years because of an increasing demand as a result of the aging patient population. The elderly patient population often suffers from cardiovascular diseases, causing frailty and low mobility. Therefore, home monitoring of tissue perfusion with non-invasive devices will become more and more important, not only in patients with PAD but also in patients with diabetes, who are prone to develop foot ulcers. Tissue perfusion measurements with LSCI or HSI could be potentially successful in accomplishing this, because they depend on non-invasive, non-contact measurement. Measurements should be performed in a standardized protocol by care providers to overcome variability and user dependency. It may be an illusion that patients will be able to determine their tissue perfusion themselves at home. However, if wound consultants or general practitioner can measure tissue perfusion in PAD patients the burden to expensive visits to outpatients clinics and hospitals may decrease.
In conclusion, there is a need to determine tissue perfusion in patients suffering with PAD and chronic limb-threatening ischemia. The ideal tissue perfusion measurement technique is non-invasive, with low inter-observer and intra-observer variability, inexpensive, and can be performed throughout the entire peri-procedural process. Continuation of tissue perfusion measurements in the first weeks postintervention at home may be important to evaluate clinical outcomes. So far, evidence is scarce regarding such techniques, and large prospective trials are necessary before tissue perfusion measurements are incorporated in daily vascular practice.
Article highlights
Assessment of peripheral arterial disease is mainly performed by determination of stenosis or occlusion in the large arteries and does not focus on microcirculation.
Available diagnostic techniques for measurement of tissue perfusion in the lower extremity that may be implemented in clinical and home settings are reviewed, including the quality of publications.
Declaration of interest
The authors report that they have no relevant relationships to disclose.
Additional information
Funding
References
- Alzamora MT, Fores R, Baena-Diez JM, et al. The peripheral arterial disease study (PERART/ARTPER): prevalence and risk factors in the general population. BMC Public Health. 2010;10:38–2458-10–38.
- Hirsch AT, Criqui MH, Treat-Jacobson D, et al. Peripheral arterial disease detection, awareness, and treatment in primary care. JAMA. 2001;286(11):1317–1324.
- Bartelink M, Elsman B, Oostindjer A, et al. NHG-standaard perifeer arterieel vaatlijden (tweede herziening). Huisarts Wet. 2014;57(2):81.
- Norgren L, Hiatt WR, Dormandy JA, et al. Inter-society consensus for the management of peripheral arterial disease (TASC II). J Vasc Surg. 2007;45(Suppl S):S5–67.
- Fowkes FG, Rudan D, Rudan I, et al. Comparison of global estimates of prevalence and risk factors for peripheral artery disease in 2000 and 2010: a systematic review and analysis. Lancet. 2013;382(9901):1329–1340.
- Brownrigg JR, Hinchliffe RJ, Apelqvist J, et al. Effectiveness of bedside investigations to diagnose peripheral artery disease among people with diabetes mellitus: a systematic review. Diabetes Metab Res Rev. 2016;32(Suppl 1):119–127.
- Aboyans V, Ricco JB, Bartelink MEL, et al. 2017 ESC guidelines on the diagnosis and treatment of peripheral arterial diseases, in collaboration with the European Society for Vascular Surgery (ESVS): document covering atherosclerotic disease of extracranial carotid and vertebral, mesenteric, renal, upper and lower extremity arteriesEndorsed by: the European Stroke Organization (ESO)The Task Force for the Diagnosis and Treatment of Peripheral Arterial Diseases of the European Society of Cardiology (ESC) and of the European Society for Vascular Surgery (ESVS). Eur Heart J. 2018;39(9):763–816.
- Moher D, Shamseer L, Clarke M, et al. Preferred reporting items for systematic review and meta-analysis protocols (PRISMA-P) 2015 statement. Syst Rev. 2015;4:1–4053-4–1.
- Whiting PF, Rutjes AW, Westwood ME, et al. QUADAS-2: a revised tool for the quality assessment of diagnostic accuracy studies. Ann Intern Med. 2011;155(8):529–536.
- Chiang N, Jain JK, Sleigh J, et al. Evaluation of hyperspectral imaging technology in patients with peripheral vascular disease. J Vasc Surg. 2017;66(4):1192–1201.
- Pawlaczyk-Gabriel K, Gabriel M, Krasiński Z et al. Influence of low and moderate grade leg ischaemia on the skin microcirculation parameters in peripheral arterial occlusive disease patients. Acta Angiolog. 2014;20(4):133–140.
- Lasker JM, Masciotti JM, Schoenecker M, et al. Digital-signal-processor-based dynamic imaging system for optical tomography. Rev Sci Instrum. 2007;78(8):083706.
- Blomley MJ, Cooke JC, Unger EC, et al. Microbubble contrast agents: a new era in ultrasound. BMJ. 2001;322(7296):1222–1225.
- Kundi R, Prior SJ, Addison O, et al. Contrast-enhanced ultrasound reveals exercise-induced perfusion deficits in claudicants. J Vasc Endovasc Surg. 2017;2(1):9.
- Duerschmied D, Zhou Q, Rink E, et al. Simplified contrast ultrasound accurately reveals muscle perfusion deficits and reflects collateralization in PAD. Atherosclerosis. 2009;202(2):505–512.
- Meneses AL, Nam MCY, Bailey TG, et al. Leg blood flow and skeletal muscle microvascular perfusion responses to submaximal exercise in peripheral arterial disease. Am J Physiol Heart Circ Physiol. 2018;315(5):H1425–H1433.
- Versluis B, Backes WH, van Eupen MG, et al. Magnetic resonance imaging in peripheral arterial disease: reproducibility of the assessment of morphological and functional vascular status. Invest Radiol. 2011;46(1):11–24.
- Mathew RC, Kramer CM. Recent advances in magnetic resonance imaging for peripheral artery disease. Vasc Med. 2018;23(2):143–152.
- Ogawa S, Lee T, Kay A, et al. Brain magnetic resonance imaging with contrast dependent on blood oxygenation. Proc Nat Acad Sci. 1990 Dec;87(24):9869–9872.
- Filli L, Boss A, Wurnig MC, et al. Dynamic intravoxel incoherent motion imaging of skeletal muscle at rest and after exercise. NMR Biomed. 2015;28(2):240–246.
- Jiji RS, Pollak AW, Epstein FH, et al. Reproducibility of rest and exercise stress contrast-enhanced calf perfusion magnetic resonance imaging in peripheral arterial disease. J Cardiovasc Magn Reson. 2013;15:14-429X-15–14.
- Englund EK, Langham MC, Li C, et al. Combined measurement of perfusion, venous oxygen saturation, and skeletal muscle T2* during reactive hyperemia in the leg. J Cardiovasc Magn Reson. 2013;15:70-429X-15–70.
- Suo S, Zhang L, Tang H, et al. Evaluation of skeletal muscle microvascular perfusion of lower extremities by cardiovascular magnetic resonance arterial spin labeling, blood oxygenation level-dependent, and intravoxel incoherent motion techniques. J Cardiovasc Magn Reson. 2018;20(1):18–018-0441–3.
- Jones S, Chiesa ST, Chaturvedi N, et al. Recent developments in near-infrared spectroscopy (NIRS) for the assessment of local skeletal muscle microvascular function and capacity to utilise oxygen. Artery Res. 2016;16:25–33.
- Vardi M, Nini A. Near-infrared spectroscopy for evaluation of peripheral vascular disease. A systematic review of literature. Eur J Vasc Endovasc Surg. 2008;35(1):68–74.
- Boezeman RP, Moll FL, Unlu C, et al. Systematic review of clinical applications of monitoring muscle tissue oxygenation with near-infrared spectroscopy in vascular disease. Microvasc Res. 2016;104:11–22.
- Boezeman RP, Boersma D, Wille J, et al. The significance of regional hemoglobin oxygen saturation values and limb-to-arm ratios of near-infrared spectroscopy to detect critical limb ischemia. Vascular. 2016;24(5):492–500.
- Mesquita RC, Putt M, Chandra M, et al. Diffuse optical characterization of an exercising patient group with peripheral artery disease. J Biomed Opt. 2013;18(5):57007.
- Kagaya Y, Ohura N, Suga H, et al. ‘Real angiosome’ assessment from peripheral tissue perfusion using tissue oxygen saturation foot-mapping in patients with critical limb ischemia. Eur J Vasc Endovasc Surg. 2014;47(4):433–441.
- Miller AJ, Luck JC, Kim DJ, et al. Blood pressure and leg deoxygenation are exaggerated during treadmill walking in patients with peripheral artery disease. J Appl Physiol. 2017;123(5):1160–1165. (1985).
- Sheffield PJ. Measuring tissue oxygen tension: a review. Undersea Hyperb Med. 1998;25(3):179–188.
- Kovacs D, Csiszar B, Biro K, et al. Toe-brachial index and exercise test can improve the exploration of peripheral artery disease. Atherosclerosis. 2018;269:151–158.
- Hypermed Imaging Inc. HyperViewTM User Manual. Memphis, TN. 2017.
- Greenman RL, Panasyuk S, Wang X, et al. Early changes in the skin microcirculation and muscle metabolism of the diabetic foot. Lancet. 2005;366(9498):1711–1717.
- Nouvong A, Hoogwerf B, Mohler E, et al. Evaluation of diabetic foot ulcer healing with hyperspectral imaging of oxyhemoglobin and deoxyhemoglobin. Diabetes Care. 2009;32(11):2056–2061.
- Mennes OA, van Netten JJ, Slart RHJA, et al. Novel optical techniques for imaging microcirculation in the diabetic foot. Curr Pharm Des. 2018;24(12):1304–1316.
- Yudovsky D, Nouvong A, Pilon L. Hyperspectral imaging in diabetic foot wound care. J Diabetes Sci Technol. 2010;4(5):1099–1113.
- Chin JA, Wang EC, Kibbe MR. Evaluation of hyperspectral technology for assessing the presence and severity of peripheral artery disease. J Vasc Surg. 2011;54(6):1679–1688.
- Jafari-Saraf L, Wilson SE, Gordon IL. Hyperspectral image measurements of skin hemoglobin compared with transcutaneous PO2 measurements. Ann Vasc Surg. 2012;26(4):537–548.
- Khaodhiar L, Dinh T, Schomacker KT, et al. The use of medical hyperspectral technology to evaluate microcirculatory changes in diabetic foot ulcers and to predict clinical outcomes. Diabetes Care. 2007;30(4):903–910.
- Humeau A, Steenbergen W, Nilsson H, et al. Laser Doppler perfusion monitoring and imaging: novel approaches. Med Biol Eng Comput. 2007;45(5):421–435.
- Fredriksson I, Larsson M, Stromberg T. Measurement depth and volume in laser Doppler flowmetry. Microvasc Res. 2009;78(1):4–13.
- Briers JD, Doppler L. Speckle and related techniques for blood perfusion mapping and imaging. Physiol Meas. 2001;22(4):R35–66.
- Laser Doppler Perfusion Monitoring [Internet]. Järfälla(Sweden): Perimed; [cited 2019 Apr 12]. Available from: https://www.perimed-instruments.com/
- Humeau-Heurtier A, Abraham P, Henni S. Bi-dimensional variational mode decomposition of laser speckle contrast imaging data: A clinical approach to critical limb ischemia? Comput Biol Med. 2017;86:107–112.
- Kikuchi S, Miyake K, Tada Y, et al. Laser speckle flowgraphy can also be used to show dynamic changes in the blood flow of the skin of the foot after surgical revascularization. Vascular. 2018;27(3):242-251.
- Draijer M, Hondebrink E, van Leeuwen T, et al. Review of laser speckle contrast techniques for visualizing tissue perfusion. Lasers Med Sci. 2009;24(4):639–651.
- Briers J Laser speckle contrast imaging for measuring blood flow. Optica Appl. 2007;37:1–2.
- Alander JT, Kaartinen I, Laakso A, et al. A review of indocyanine green fluorescent imaging in surgery Int J Biomed Imaging. 2012;2012:1–26.
- Swijnenburg RJ, Crane LM, Buddingh KT, et al. Intraoperative imaging using fluorescence. Ned Tijdschr Geneeskd. 2012;156(11):A4316.
- Igari K, Kudo T, Uchiyama H, et al. Indocyanine green angiography for the diagnosis of peripheral arterial disease with isolated infrapopliteal lesions. Ann Vasc Surg. 2014;28(6):1479–1484.
- Kang Y, Lee J, Kwon K, et al. Dynamic fluorescence imaging of indocyanine green for reliable and sensitive diagnosis of peripheral vascular insufficiency. Microvasc Res. 2010;80(3):552–555.
- Held M, Bender D, Krauss S, et al. Quantitative analysis of heel skin microcirculation using Laser Doppler flowmetry and tissue spectrophotometry. Adv Skin Wound Care. 2019;32(2):88–92.
- Rajbhandari SM, Harris ND, Tesfaye S, et al. Early identification of diabetic foot ulcers that may require intervention using the micro lightguide spectrophotometer. Diabetes Care. 1999;22(8):1292–1295.
- Beckert S, Witte MB, Konigsrainer A, et al. The impact of the micro-lightguide O2C for the quantification of tissue ischemia in diabetic foot ulcers. Diabetes Care. 2004;27(12):2863–2867.
- Jorgensen LP, Schroeder TV. Micro-lightguide spectrophotometry for tissue perfusion in ischemic limbs. J Vasc Surg. 2012;56(3):746–752.
- Khalil MA, Kim HK, Hoi JW, et al. Detection of peripheral arterial disease within the foot using vascular optical tomographic imaging: a clinical pilot study. Eur J Vasc Endovasc Surg. 2015;49(1):83–89.
- Spiliopoulos S, Theodosiadou V, Barampoutis N, et al. Multi-center feasibility study of microwave radiometry thermometry for non-invasive differential diagnosis of arterial disease in diabetic patients with suspected critical limb ischemia. J Diabetes Complications. 2017;31(7):1109–1114.
- Huang CL, Wu YW, Hwang CL, et al. The application of infrared thermography in evaluation of patients at high risk for lower extremity peripheral arterial disease. J Vasc Surg. 2011;54(4):1074–1080.
- Hauser CJ, Klein SR, Mehringer CM, et al. Assessment of perfusion in the diabetic foot by regional transcutaneous oximetry. Diabetes. 1984;33(6):527–531.
- Sorensen A, Peters D, Frund E, et al. Changes in human placental oxygenation during maternal hyperoxia estimated by blood oxygen level-dependent magnetic resonance imaging (BOLD MRI). Ultrasound Obstet. Gynecol. 2013;42(3):310–314.
- Dziuda L. Fiber-optic sensors for monitoring patient physiological parameters: a review of applicable technologies and relevance to use during magnetic resonance imaging procedures. J Biomed Opt. 2015;20(1):010901.
Appendix
Search strategy PubMed
(‘Peripheral Arterial Disease’[Mesh] OR ‘Peripheral Vascular Diseases’[Mesh:NoExp] OR peripheral arterial disease* [tiab] OR peripheral artery diseas* [tiab] OR peripheral occlusive disease* [tiab] OR peripheral vascular disease* [tiab] OR limb ischemia [tiab])
AND
(‘Diagnostic Imaging’[Mesh] OR ‘Diagnostic Techniques, Cardiovascular’[Mesh] OR imag*[tiab] OR non-invasive [tiab] OR diagnos* [tiab] OR test [tiab] OR tests [tiab] OR testing [tiab]OR monitor* [tiab] OR Skin perfusion pressure [tiab] OR spectrophotometry [tiab] OR Optoacoustic tomography [tiab] OR Optoacoustic spectroscopy [tiab] OR photoacoustic tomography [tiab] OR photoacoustic spectroscopy [tiab] OR transcutaneous partial pressure of oxygen [tiab] OR tcPO2 [tiab] OR transcutaneous oxygen measurement [tiab] OR transcutaneous oximetry [tiab] OR transcutaneous oxygen tension [tiab] OR transcutaneous oxygen pressure [tiab] OR near infrared spectroscopy [tiab] OR nirs [tiab] OR speckle [tiab] OR thermography [tiab] OR SPECT [tiab] OR Single photon emission computed tomography OR Contrast enhanced ultrasound [tiab]OR contrast enhanced ultrasonography [tiab] OR CEUS [tiab] OR digital subtraction angiography [tiab] OR digital subtraction angiogram [tiab] OR DSA [tiab] OR cone beam [tiab] OR 15O H2O Positron emission tomography [tiab] OR 15O H2O PET [tiab] OR Radiowater [tiab] OR perfusion CT [tiab] OR Perfusion computed tomography [tiab] OR Arterial Spin Labeling [tiab] OR Perfusion MR* [tiab] OR Perfusion Magnetic resonance Imaging [tiab] OR Dynamic Susceptibility Contrast [tiab] OR Dynamic contrast enhanced [tiab] OR Perfusion Weighted imaging [tiab])
AND
(‘Microcirculation’[Mesh] OR oxygenation [tiab] OR tissue saturation [tiab] OR oxygen [tiab] OR perfusion [tiab] OR microcircul*[tiab] OR oxyhemogl* [tiab] OR deoxyhemogl* [tiab] OR microperfusion [tiab])
AND
(‘Lower Extremity’[Mesh] OR foot [tiab] OR feet [tiab] OR lower extremit* [tiab] OR leg [tiab] OR legs [tiab] OR limb* [tiab] OR ankle* [tiab])
NOT
(‘animals’[MeSH] NOT ‘humans’[MeSH])