
 ?Mathematical formulae have been encoded as MathML and are displayed in this HTML version using MathJax in order to improve their display. Uncheck the box to turn MathJax off. This feature requires Javascript. Click on a formula to zoom.
ABSTRACT
Purpose
To assess the performance of a new device for the clinical determination of light discomfort on a large sample of healthy human subjects.
Methods
A total of 489 subjects ranging from 20 to 70 years old (241 men, 248 women) were evaluated with the LUMIZ™ 100 to determine light discomfort. Repeatability was assessed by means of within-subject standard deviation, coefficient of variation (CoV), and intraclass correlation coefficient (ICC). Repeated measures ANOVA, Kruskal-Wallis, and correlation analysis were applied to test for differences between repeated measures, and effect of age on reliability.
Results
Discomfort thresholds obtained are well distributed across the light intensity range available (25 to 10211 lux). Intrasession ICCs are higher than 0.849 for all thresholds, and 85% of CoV are below 10%. Thresholds obtained in the first set of measurements are highly correlated with the median of three sets (r2 > 0.8). Intersession, 64% of CoV are below 10%. Age does not affect discomfort thresholds (p = 0.30), nor affect reliability (variance on CoV, p = 0.368)
Conclusions
The new device provides good intrasession repeatability for the clinical determination of light discomfort thresholds, although variance is slightly greater between sessions. The system is useful for the clinical determination of light discomfort.
1. Introduction
Most people have experienced discomfort glare in everyday life, as this phenomenon helps protecting ourselves from potentially damaging light [Citation1].
Research on discomfort glare has been conducted mainly in two major areas: architecture and pathology/medicine. First studies on lighting started a century ago with the arrival of new lighting sources [Citation2–4]. Research in this field is still very active nowadays on glare indexes that compute light environments in order to evaluate comfort acceptance [Citation5–9]. These indexes are useful for creating comfortable lighting environments for a population but do not ensure self-perceived comfort of an individual [Citation10]. Studies on physiological parameters that can affect discomfort [Citation10] or as an indicator of discomfort [Citation11] in medicine explored photophobia, that is an extreme condition of discomfort glare. With photophobia, normal light levels produce or increase pain [Citation12,Citation13], and is often associated with neurological disorders like migraine or brain injury [Citation14,Citation15], ophthalmic disease [Citation16] (dry eyes or retina pathology), or as a secondary effect of drugs [Citation15].
To the authors’ knowledge, few studies have been conducted to evaluate diversity of discomfort glare sensitivity in non-pathological populations. Wolska and Sawicki [Citation17] explored the age effect in discomfort glare in non-pathologic populations. Evaluation was done under two lighting conditions in an office environment using a semantic scale, concluding that the lack of standardized measures reduced discomfort glare understanding in the non-pathologic population.
However, 20% of people declare to be ‘very sensitive’ or ‘extremely sensitive’ and 36% declare to be sensitive [Citation18]. The discrepancy between the amount of scientific work conducted and the amount of people concerned by this issue may be due to the lack of available tools to measure discomfort thresholds in large cohorts of people. The objective of the developed tool described here is to provide to the eye care professionals a fast and reliable light sensitivity measurement in order to individualize advice to their visual needs in their everyday life.
2. Background
2.1. Glare definitions
Glare is the loss of visual performance or discomfort caused by an intensity of light in the visual field above the intensity threshold to which the eyes are adapted, and can be therefore subdivided into discomfort and disability glare. Disability glare is a well-known consequence of intraocular straylight. Intraocular light scatter is light that has reflected, refracted, diffracted, or experienced multiple combinations of all three from particles along the optical path of travel [Citation19]. Fan-Paul et al. [Citation20] highlighted the fact that glare and disability glare are often confused in the literature. Glare refers to the light source whereas disability glare corresponds to the reduction in visual performance due to a glare source and is the result of forward light scattering [Citation21]. Considering that scattered light causes contrast loss in the final retinal image, the estimation of straylight becomes very important in clinical applications, such as diagnosing patients with complaints caused by large light scattering in the eyes such as lens opacities or corneal turbidity after laser corneal surgery [Citation22–24]. The principles behind it are well known, and several clinical devices have been developed over the years to evaluate straylight and disability glare [Citation24–26] and other related light disturbances [Citation24].
However, glare from a light source can also result in discomfort or even pain, not necessarily implying a reduction in vision [Citation27]. Discomfort glare is considered more subjective and can vary widely among people due to individual differences in sensitivity. Several optical factors are known to influence it, such as the size and intensity of the light source, the amount of light reaching the retina, or the luminance and size of the background [Citation28–32], the color temperature [Citation33] and spectral component [Citation34] but also factors within the pathways of light perception, like cortical hypersensitivity [Citation35], or psychological factors such as emotional status, making it a context-dependent parameter. Mainster and Turner [Citation12] describe ‘discomfort glare (psychological glare)’ as glare that causes annoyance, ‘the retina transmits information on illumination that is too intense or variable for a particular person, place, and time to key thalamic, somatosensory, visual, and associated brain centers’.
The two causes of discomfort glare described by Pierson et al. [Citation10] were:
‘The total amount of light reaching the observer’s eyes is too large’, meaning that ‘even if the source was seen under a proper contrast with the background, the observer would feel discomfort as his or her eyes could not adapt to the light’. They named this first cause of discomfort glare as saturation or absolute glare.
‘The contrast between the viewing direction (e.g. visual task) and a bright spot in the field of view is too strong’. This was explained as either an adaptation of the observer’s eyes to a relatively low luminance of the visual task, or being forced to adapt to a bright environment while perceiving the visual task as too dim. They named this first cause of discomfort glare as contrast or relative glare.
2.2. Discomfort glare evaluation methodology
To date, different methodologies aiming to determine discomfort glare have been set [Citation36,Citation37]. In relative evaluation, two or more lighting conditions are compared using forced choice, rank, or adjusting method according to subject perception. This method allows reliable evaluation of light factors (like light level, size and eccentricity, color, etc.) however, it does not allow the evaluation of light sensitivity.
Absolute evaluation needs a criteria definition to make the measurement. Either the light condition is labeled or the light condition is adjusted to reach a predefined label. Subjective scale is widely used [Citation36,Citation37], but other objective measurements such as pupil size can also be used [Citation11].
2.3. Objective measurements of discomfort glare
A review of different methodologies that explored physiological measurement of discomfort glare was published in 2019 by Hamedani et al. [Citation11] Absolute pupil size seems to be more linked to background illumination rather than discomfort, with reported significant correlations between pupil size and discomfort rating [Citation38,Citation39], but weak correlations (r2 < 0.5). Relative pupil size seems more of interest as it takes into account baseline pupil size but correlations are similar (r2 = 0.43) [Citation40]. Pupil size modification is the fastest process used by the eye to adapt to the light. However, pupil varies with multiple other factors such as accommodation [Citation41], emotion [Citation42], cognitive tasks [Citation43], drugs, or coffee intake [Citation44]. These factors may decrease the reliability of pupil size as a marker of light comfort/discomfort.
Research on blinking rate, palpebral aperture, and eye gaze has been also conducted but none demonstrated any strong relationship with glare rating [Citation11,Citation38–40]. The most promising objective measurement of discomfort glare has been developed by Murray et al. [Citation45] using electromyogram around the eye, although the method is invasive and therefore has reduced applicability as a routine assessment in clinical settings.
To the authors’ knowledge, no robust and easy objective measurement of discomfort is available yet, explaining the wide use of discomfort glare scale.
2.4. Discomfort glare scale
Discomfort glare scales have been used for a long time to assess discomfort under a given condition. In 1925, Luckiesh and Holladay [Citation46] described a 12-point scale named ‘Psycho-Physiological Effects of Light-Sources’. This scale ranges from scarcely noticeable, through pleasantness and comfort, to unbearable and irritating discomfort. In a later study, Lukiesh & Guth [Citation2] preferred to use a single level of light condition comparison that was borderline between comfort and discomfort (BCD) for simplicity, universality, and meaningfulness to evaluate lighting conditions in large cohorts of subjects. Hopkinson (1940) [Citation3] developed a 4-level scale which emphasized change in sensation, carefully defining each level: A. Just intolerable/B. Just uncomfortable/C. Satisfactory/D. Just not perceptible.
The de Boer scale (or an adaptation of it) is the most widely used in the literature [Citation47]. It is a 9 point scale labeled on odd numbers (1 = unbearable, 3 = disturbing, 5 = just acceptable, 7 = satisfactory and 9 = just noticeable) [Citation48]. Different authors [Citation47,Citation49] highlighted the fact that understanding may differ from person to person. Moreover, it seems difficult to remember and multiple parameters are evaluated (satisfaction versus acceptance versus disturbance) within the same scale, having an impact on the reliability of the output.
It is therefore important to provide clearly define a limited number of thresholds to ensure robustness of the measurement.
2.5. Light sensitivity tools
Questionnaires are tools that can be easily applied and widely available. First questionnaires on light sensitivity were developed to assess photophobia symptoms. The 8-item photophobia questionnaire developed at the Korea University Medical Center (KUMC-8) rates symptoms during migraine attack [Citation50], whereas the 12-item Utah Photophobia Symptom Impact Scale (UPSIS-12) evaluates light sensitivity mostly in headache-free periods [Citation51]. More recently, the Visual Light Sensitivity Questionnaire-8 (VLSQ-8) has been developed for application in large cohorts of subjects, i.e. not specifically for subjects with pathological conditions [Citation1]. This questionnaire records glare symptoms frequency within the past month.
Different set-ups or discomfort threshold measurement methods using light adjustment have been described in literature using various types of light. Some of them were relatively close in concept to the system described and assessed in the present study, and are briefly described here in terms of stimuli and discomfort scale, but, to the authors’ knowledge, none is available on the market.
Hopkinson [Citation3] proposed in 1940 a method for discomfort glare evaluation based on light level adjustments and a discomfort scale to evaluate discomfort glare produced by street lamps at night. Observers had to adjust their own light level to reach different levels of glare discomfort. Later, Vanagaite et al. [Citation14] used a light slab (12 cm diameter at 62 cm) with illuminance ranging from 50 lux to 23,000 Lux in 33 steps, in a ‘2 seconds on/2 seconds off’ sequence, in a dark room. Subjects evaluated two thresholds: when condition became uncomfortable and when condition produced pain or could not be tolerated anymore. Similar tool was developed by Adams et al. [Citation15] but modifying the times between stimuli 1 second.
A more advanced device developed for this purpose is the Ocular Photosensitivity Analyzer. OPA is a ‘subjective functional measure of visual photosensitivity’ [Citation1,Citation52] composed of a concave array panel (210 LEDs) at 50 cm distance (14–9200 lux divided into 25 levels, 2 sec exposure at 4 sec inter-stimulus interval). Threshold between comfort & discomfort is determined using the Garcia-Perez staircase technique after 10 response reversal.
All these tools use a light panel that requires a dedicated room where light can be controlled. The use of a headset relieves this constrain.
3. Tool description
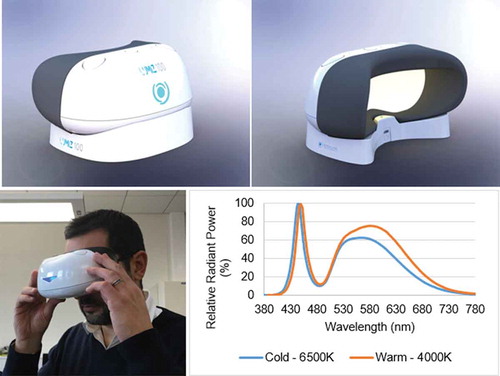
The LUMIZ™ 100 consists on a handheld device () that is coupled wireless with a tablet or smartphone through a custom-made application. The device is composed of a spherical white surface illuminated by LEDs that allows uniform illumination in the entire field of view of the user without using direct light. Photometry is reliably controlled by the headset configuration that blocks any environmental parasite light. Illumination includes two different LED sources: a so-called Warm light (4000°K) and a Cold light (6500°K) (). These color temperatures aim to mimic natural light and artificial light. These sources provide illumination from 10 Lux (Log10 (Lux) = 1) to 10,211 Lux (Log10 (Lux) = 4.01) Lux at eyes’ level. The device has three LEDs per color temperature placed in periphery in order to avoid any direct source observation during the measurement. The white surface has been optimized to get isotrope characteristics in order to ensure uniform distribution of light. The uniformity is checked using a videoluminancemeter. It also has two buttons on top for the subject to respond when any of the two thresholds to be determined (just perceptible discomfort and really disturbing discomfort, as described below) is reached.
Figure 1. The LUMIZTM discomfort light sensitivity system (top left: front side; top right: back-illuminated side) being used by a subject (bottom left), as well as the two LEDs spectra used for illumination (bottom right): Warm light (4000°K) in orange and a Cold light (6500°K) in blue
Discomfort threshold definitions are of utmost importance for measurement reliability [Citation3,Citation47,Citation49]. To ensure threshold definition understanding by the user, measurement was limited to two thresholds, presented to the subject by means of a video. To facilitate understanding by the subjects, threshold definitions include examples of symptoms that can be felt.
‘Just perceptible discomfort threshold (JD): the moment you feel a start of tension in your eyelids or a start of tingling’.
‘Really disturbing discomfort threshold (RD): which requires an effort to keep your eyes open’.
According to this setup, the discomfort glare quantified by the system would be the ‘saturation’ or ‘absolute’ glare, as per Pierson description [Citation10] previously mentioned, also agreeing with the description by Mainster and Turner [Citation12]. In order for the user not to face intolerable glare, ascendant method is used. Light increase is automatic, as manual adjustments may induce bias in the measurement and reduce reliability in between-subjects comparison. Moreover, when light reaches the second discomfort threshold (RD) or the maximum intensity of the tool, the light automatically turns off. Vertical illuminance at eye level that produced discomfort thresholds is provided in Lux. According to the Weber-Fechner law, the intensity of a sensation is proportional to the logarithm of the intensity of the stimulus causing it, thus the choice for the increments in percentage of intensity [Citation53]. Two methods of light increase are used (both described in the literature, see epigraph 2.5). For continuous increase, light starts at 25 Lux for 5 seconds and increases every second using a 20% increase step. The continuous ramp contains 34 steps and maximum time duration is 38 seconds. This progressive increase (also used by Adams et al. [Citation15]) allows the visual system to adapt a little. The second method is flashing increase. The light starts at 10 Lux for 5 seconds before increases instantaneously to 25 Lux for half a second and goes back to 10 Lux for 2 seconds before the next stimuli. Increase between each step is 44% in order to have similarity in light levels prevented in the method of light increase without a too-long duration of the flashing ramp. The flashing ramp includes 17 levels and a maximum duration of 43 seconds (to reach 8509 Lux). This flashing increase (also used by Vanagaite et al. [Citation14]) does not provide enough time for the visual system to adapt. These two methods have been selected in order to reflect the most bothering situations in everyday life.
Methodology also includes a mockup measurement that is also of utmost importance for reliability of the measurement because this blank measurement allows the user to decrease apprehension of the measurement, to feel sensation in order to better measure discomfort thresholds in next conditions.
The full sequence of light discomfort thresholds (using JP & RD instructions) consists of the following light conditions:
Mockup measurement (using continuous increase warm light).
Continuous increase warm light
Continuous increase cold light
Flashing increase warm light
Subjects were asked to click one of the two buttons of the device to indicate their discomfort thresholds (1st click: Just Perceptible & 2nd click: Really Disturbing). When a light condition is completed, investigator asks the subject before the launch of the next condition.
4. Methods
4.1. Sample details
Four hundred and eighty-nine healthy subjects (241 males and 248 females) with ages ranging between 20 and 70 years were consecutively recruited for this prospective study by advertising using University dissemination channels, for campus personnel and students, as well as in local public entities in nearby towns. Fifty-three of these subjects participated in a second visit, balanced across gender and age group (20 to 70 years of age).
Inclusion criteria considered volunteer healthy participants willing to follow the protocol and able to read, comprehend, and sign the informed consent form. A complete clinical assessment was carried out to ensure that subjects met the requirements for enrollment. Subjects who were participating in another study which might influence vision or interfere with study assessments were excluded. As specific inclusion criteria would be age between 20 and 70 years, a best distance-corrected visual acuity (BCVA) was set at +0.10 logMAR or better in each eye. Exclusion criteria included aphakia or pseudophakic multifocal intraocular lens (IOL), any current or evolving pathology manifested in the eye or the appendages which might have an influence on vision, or interfere with study assessments (e.g. age macular degeneration or glaucoma), any previous ocular surgery, any untreated and/or uncontrolled systemic conditions which might have an influence on vision, or interfere with study assessments (e.g. uncontrolled diabetes or uncontrolled high blood pressure), any medical treatment, or medication which might have an influence on vision or interfere with study assessments (e.g. antidepressants, tranquilizers, antipsychotics, or drugs with atropinic effects), migraine, or epilepsy. Although monofocal IOLs were not considered an exclusion criterium during recruitment, only two male subjects within the 60–70 years-old group had monofocal IOL implanted bilaterally.
The Ethics Committee of the University of Valencia approved the study protocol that followed the tenets of the Declaration of Helsinki. Informed consent was signed by every patient after they were provided a verbal and written explanation of the purpose of the study, measurement process details, and data treatment. For each subject, a preliminary exam was performed in order to assess suitability for inclusion in the study by determining the refractive status (objective and subjective refraction), BCVA, and ocular biometric and optical quality parameters.
4.2. Acquisition process
Acquisition of light discomfort thresholds was obtained binocularly and without refractive correction. The subject set comfortably holding the LUMIZ™ 100 in front of both eyes, making sure that one of his/her fingers reaches the button for responding when the thresholds were attained. In order to avoid any bias due to the explanation of the procedures made by each examiner, instructions were given to the subjects by means of a recorded video explaining the procedures prior to acquisition.
Three consecutive sets of measurements (Continuous increase warm light/Continuous increase cold light/Flashing increase warm light represents a set) within the session were carried out in order to evaluate intrasession repeatability. A period between measurements was allowed for the subject to get ready for the next measurement, ranging between 30 seconds to 1 minute at the subject’s discretion.
4.3. Statistical analysis
As previously mentioned, photosensitivity bears a logarithmic relation to light intensity [Citation53]; therefore, the lux thresholds were log-transformed, and all statistical analyses of the thresholds were performed using the log10 (Lux) thresholds, as in previous studies [Citation1]. In case a threshold was not reached at 10,211 Lux, the next level (12,253 Lux) was then arbitrarily assigned.
Statistical processing of data was carried out by SPSS software v.26.0 for Windows (IBM Corp., Armonk, New York, USA), while plots and box-plots were built using Dell Statistica V13 (Dell Inc., Round Rock, Texas, USA). The p-value was considered statistically significant when it was less than 0.05. The following reliability indexes were calculated: within subject standard deviation (Sw), coefficient of variation (CoV), and intraclass correlation coefficient (ICC). Sw is the result of the square root of the mean variance between subjects. CoV was calculated as the ratio between Sw and the average value . And finally, ICC was calculated to evaluate the absolute agreement. The ICCs were classified using a system suggested by McGraw and Wong [Citation54] as follows: (1) less than 0.75 – poor agreement; 0.75 to less than 0.90 – moderate agreement; (3) 0.90 or greater – high agreement. Precision was also evaluated according to recommendations from Mc Alinden, Khadka, and Pesudovs [Citation55]. ‘Repeatability refers to the variability in repeated measurements by one observer when all other factors are assumed constant’ and ‘Reproducibility refers to the variability in repeated measurements when one or more factors, such as observer, instrument, calibration, environment or time is varied.’ Repeatability was computed for each condition using three measurements of 489 subjects of visit 1. Reproductibility was computed for each condition using 6 measurements of 53 subjects who attended 2 examination visits (3 measurements of visit 1 and 3 measurements of visit 2).
Repeated measures ANOVA was carried out to test for differences between repeated measures of sensitivity thresholds, and Kruskal-Wallis test when categorical data were included. Correlation analysis was carried out to determine the agreement between repeated measures.
The effect of age and gender on the threshold values obtained was address using the mean of six thresholds (three light conditions per two thresholds each) in Log10(lux) from the first set of measurements and Kruskal-Wallis test was applied.
5. Results
5.1. Data description
shows the main characteristics of the whole sample evaluated. Out of those using ophthalmic correction, 95% used clear lenses, and 5% Photochromic lenses.
Table 1. Descriptive statistics of the sample examined (Age, gender, equipment)
A 37% of the subjects comprising the whole sample do not use sunglasses.
Discomfort thresholds obtained are well distributed across the range of light intensity available (From 25 lux to 10,211 lux) (). For RD discomfort threshold, 25% of subjects have not reached discomfort at 10,211 Lux (Log10 (Lux) = 4.01) (). Flashing ramp produces lower discomfort threshold than continuous warm, which produces lower discomfort thresholds than continuous cold (ANOVA, p < 0.0001; LSD Post-hoc p < 0.004). Good correlations between JP and RD discomfort thresholds are found for each light condition (r2 > 0.6), as well as good correlations between cold and warm light discomfort thresholds (r2 > 0.8).
Figure 2. Box-plot describing repartition (Median/Quartile/Min-Max) of discomfort thresholds in rank of measurement (Continuous warm in orange, continuous cold in blue, flashing warm in orange dashed line; JP threshold lighter colors and RD threshold darker colors)
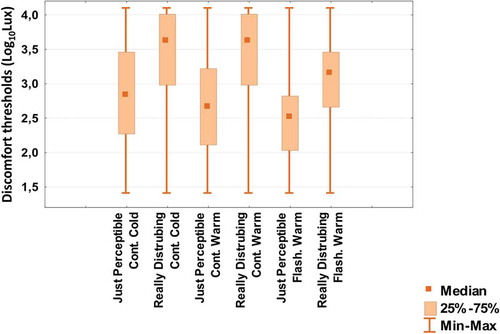
Table 2. Light sensitivity thresholds repartition for three light increase conditions (Continuous warm, continuous cold, flashing warm) and two threshold levels (just perceptible (JP) and really disturbing (RD)) measured for the first set of the first visit
5.2. Intrasession repeatability
Three sets of measurements were carried out during the first session. Repeatability is assessed by calculating the ICC using the three repeated measurements obtained for each of the thresholds determined. ICCs obtained show moderate to high agreement between the repeated measures for each subject (). Within session, using three sets of measurements, 85% of the CoV were below 10% ().
Figure 3. Box plot representing the distribution of coefficient of variation (CoV) (Median/Quartile/Min-Max) per subject within the first visit for the 6 different thresholds in rank of measurement (Continuous warm in orange, continuous cold in blue, flashing warm in orange dashed line; JP lighter colors and RD darker colors)
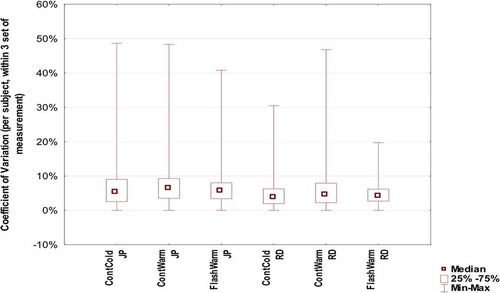
Table 3. Intrasession intraclass correlation coefficients obtained for each of the six thresholds measured (95% confidence interval in bracket)
Repeated measures ANOVA showed that JP values are more dispersed than RD values (ANOVA, p < 0.0001). It also showed that responses to continuous warm light conditions are more dispersed than the other two conditions (ANOVA, p < 0.0001), which might be due to the fact that continuous warm was always the first condition measured.
Using McAlinden, Khadka, and Pesudovs method [Citation55], repeatability (95% confidence interval) () is comprised between ±0,48 Log10(Lux) for Flashing Warm RD condition and ± 0.78 Log10(Lux) for Continuous Warm JP condition.
Table 4. Intrasession repeatability and intersession reproducibility for each of six conditions
Within a visit, the range of threshold for one condition and one subject can be as high as 2.7 Log10(Lux) (i.e. as high as the full range of light intensity proposed). When comparing the first set of measurements with the median of three consecutive measurements, correlations for all thresholds are high (r2 > 0.8), implying that the thresholds obtained in the first set of measurements are representative of the median of three sets.
5.3. Intersession reproducibility
Of those 53 subjects who attended both visits, using mean value of 6 measurements from the first set, 95% of values for second visit are ±0.72 Log10(Lux) from those obtained in the first visit. Using CoV values between sessions (first set of measurement), 64% of all measurements are below 10%.
Using McAlinden, Khadka and Pesudovs method [Citation55], reproducibility (95% confidence interval) () is comprised between ±0.66 Log 10(Lux) for Flashing Warm RD condition and ± 1.02 Log 10(Lux) for Continuous Warm JP condition.
5.4. Need for initial mockup
Prior to the actual threshold measurement, a mockup measurement of both JP and RD thresholds, using continuous increase warm light, is taken to allow the subject to familiarize with the acquisition procedure. When analyzing the outcomes of the mockup against the first threshold measurement, the scatter of the values () obtained shows the need for the mockup session prior to acquisition.
Figure 4. Scatterplot of mockup values against 1st set of values (both conditions using continuous warm increase) for JP [A] and RD [B] thresholds with regression line
![Figure 4. Scatterplot of mockup values against 1st set of values (both conditions using continuous warm increase) for JP [A] and RD [B] thresholds with regression line](/cms/asset/3beea51d-3e93-42c0-bf7c-b3cd67d28613/ierd_a_1837623_f0004_oc.jpg)
5.5. Effect of age and gender
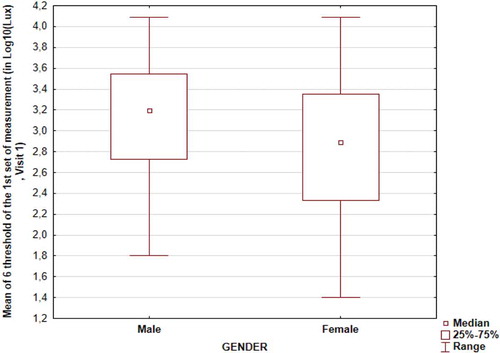
There is no age effect on discomfort light thresholds (r2 < 0.1, Kruskal-Wallis test, p = 0.30). Age did not affect the reliability of the measurements either (variance on CoV, Kruskal-Wallis test, p = 0.368). For the considered population, women have lower discomfort thresholds than men (Kruskal-Wallis test, p < 0.001) ().
Figure 5. Boxplot describing repartition (Median/Quartile/Min-Max) of mean of 6 different thresholds measured (1st Set of measurements, visit 1)
6. Discussion
Discomfort glare is a parameter difficult to quantify in clinical settings, as it involves not only optical but also perceptual and psychological components, depending on the case. Its clinical determination has, however, a significant range of applications, since a good number of conditions result in increased sensitivity to light (see Digre and Brennan [Citation16] for a review), and determining the thresholds and the change in those thresholds after treatment would be of great impact in clinical practice. In optician establishments, discomfort threshold determination would be of great value as an aid in the advice and selection of appropriate filters for ophthalmic lenses, as well as potential applications in the assessment and follow up of alterations that cause an increase in light sensitivity.
The LUMIZ™ 100 system provides direct measure of the light sensitivity thresholds by means of a simple procedure implying two responses from the subject, one when discomfort is just perceived, and a second time when the light is really disturbing based on adapted De Boer scale [Citation49]. The outcomes over a large sample of healthy subjects across age displayed moderate to high intrasession repeatability for the three conditions using two different light sources. The first set of values is representative of median of three sets, as shown by correlation coefficients greater than 0.8 in all cases. According to this, one set of measurements seems sufficient to provide reliable data, therefore avoiding the need for multiple measurements that could add undesired effects of tiredness in some cases. The intersession reproducibility is lower than intrasession repeatability. One possible explanation is the impact of some factors like tiredness, concentration, or emotional state modification on human variation of perception and evaluation that produce intra-individual variability. Intrasession ICCs are of the same level as those reported by Verriotto et al. [Citation1]. JP values are more dispersed than RD values, which is in agreement with reports from some subjects who found RD thresholds as easier to define. It might be also produced by the arbitrary attribution of 12,253 Lux threshold when the discomfort threshold exceeds 10,211 Lux, which limits coefficient of variation as for subjects who have discomfort threshold over the highest light level provided by the tool.
Discomfort glare values obtained in the sample examined for the present study do not display differences with age. As opposed to disability glare, i.e. straylight, values which have been shown as strongly dependent on subject’s age [Citation56], discomfort glare has shown large interindividual variations across all age groups. During a desk task condition, younger participants of Wolska and Sawichi [Citation17] study reported more discomfort with light than older. The protocol difference may explain the difference in results between studies. The lack of age effect is in accordance with Pierson review [Citation10], where they reviewed 15 studies that have explored age effect on discomfort glare concluding that if there is an age effect, it would be ‘weak or even negligible’. Reliability metrics did not display differences between age groups, showing similar variance for repeated measures across age, which agrees with reliability across age of disability glare measures using psychometrical methods [Citation26].
Gender did have an effect on the values obtained, showing lower thresholds (i.e. greater discomfort) for women. This is not in accordance with Pierson review [Citation10]. They reviewed eight studies exploring gender effects on discomfort glare, with none of them finding differences between men and women, and concluding that the gender effect is ‘almost certainly null’. The type of measurements and sample size might explain the difference. Moreover, differences in gender could be in part related to factors not considered in inclusion/exclusion criteria, nor in the data analysis, that could potentially affect the outcomes [Citation10]. Another hypothesis could be the higher prevalence of migraine in women. Even though migraine was included in the exclusion criteria, undiagnosed or misdiagnosed migraine might be in part behind this gender effect.
For each light condition, about a quartile of the population did not reach their RD discomfort threshold at 10,211 Lux (Log10 (Lux) = 4.01). It would have been of interest to have a higher level of light available. However, keeping in mind that the aim of the instrument (determination of light sensitivity for aiding in the advice regarding ophthalmic lens filtering and assessment of pathology-related increase in light sensitivity), as well as safety issues in case of discretional use, and the little clinical benefit of measuring light sensitivity in subjects with high discomfort thresholds, it has been decided not to provide light greater than 10,211 Lux.
Future studies applying this methodology controlling for the variability of different factors considered to have an influence in discomfort glare would yield more knowledge as to how discomfort thresholds are affected and the influence on the reliability of the measures obtained.
7. Conclusion
The results of the present study show that the clinical determination of light discomfort using the LUMIZ™ 100 device is useful for the quantification of sensitivity thresholds. The characteristics of the measurement acquisition make the system suitable for determination of light sensitivity over large population cohorts.
Article highlights
The aim of this study was to assess the light discomfort in an adult healthy population by means of a new clinical device.
The results of the present study suggest that the repeatability of the LUMIZ™ 100 for the clinical determination of light discomfort is good.
Reliability measures were consistent across age groups.
Declaration of interest
Sarah Marié is employed by Essilor International, manufacturer of the tool presented in this article. The authors have no other relevant affiliations or financial involvement with any organization or entity with a financial interest in or financial conflict with the subject matter or materials discussed in the manuscript apart from those disclosed.
Reviewer disclosures
One peer reviewer is an employee of Axon Optics. Peer reviewers on this manuscript have no other relevant financial relationships or otherwise to disclose.
Authors contributions
Robert Montés-Micó: Conception and design of the study; Analysis and interpretation of the data; Paper drafting; Final approval of the last version.
Alejandro Cerviño: Conception and design of the study; Analysis and interpretation of the data; Paper drafting; Final approval of the last version.
Noelia Martínez-Albert: Analysis and interpretation of the data; Paper drafting; Final approval of the last version.
José V. García-Marqués: Analysis and interpretation of the data; Paper drafting; Final approval of the last version.
Sarah Marié: Conception and design of the study; Analysis and interpretation of the data, Paper drafting; Final approval of the last version.
Additional information
Funding
References
- Verriotto JD, Gonzalez A, Aguilar MC, et al. New methods for quantification of visual photosensitivity threshold and symptoms. Transl Vis Sci Technol [Internet]. 2017 [cited 2018 Nov 30];6. Available from: https://www.ncbi.nlm.nih.gov/pmc/articles/PMC5566267/
- Luckiesh M, Guth SK. Brightnesses in visual field at borderline between comfort and discomfort. Illum Eng. 1949;44:650–670.
- Hopkinson RG. Discomfort glare in lighted streets. Trans Illum Eng Soc. 1940;5:1–32.
- Petherbridge P, Hopkinson RG. Discomfort glare and the lighting of buildings. Trans Illum Eng Soc. 1950;15:39–79.
- Carlucci S, Causone F, De Rosa F, et al. A review of indices for assessing visual comfort with a view to their use in optimization processes to support building integrated design. Renewable Sustainable Energy Rev. 2015;47:1016–1033.
- Scheir G, Hanselaer P, Van de Perre L, et al. Effect of luminance contrast on the perception of discomfort. Proceedings of 28th CIE session; Manchester, United Kingdom. 2015. p. 1870–1876.
- Tyukhova Y. Glare discomfort from small, high luminance light sources in outdoor nightime environments. Archit Eng Diss Stud Res [ Internet]. 2015. Available from: http://digitalcommons.unl.edu/archengdiss/36
- Amundadottir ML, Rockcastle S, Khanie MS, et al. A human-centric approach to assess daylight in buildings for non-visual health potential, visual interest and gaze behavior. Build Environ [ Internet]. 2016 [cited 2016 Oct 10]. Available from: http://linkinghub.elsevier.com/retrieve/pii/S0360132316303869
- Pierson C, Wienold J, Bodart M. Daylight discomfort glare evaluation with evalglare: influence of parameters and methods on the accuracy of discomfort glare prediction. Buildings. 2018;8:94.
- Pierson C, Wienold J, Bodart M. Review of factors influencing discomfort glare perception from daylight. LEUKOS. 2018;14:111–148.
- Hamedani Z, Solgi E, Skates H, et al. Visual discomfort and glare assessment in office environments: A review of light-induced physiological and perceptual responses. Build Environ. 2019;153:267–280.
- Mainster MA, Turner PL. Glare’s causes, consequences, and clinical challenges after a century of ophthalmic study. Am J Ophthalmol. 2012;153:587–593.
- Albilali A, Dilli E. Photophobia: when light hurts, a review. Curr Neurol Neurosci Rep. 2018;18:62.
- Vanagaite J, Pareja J, St⊘ren O, et al. Light-induced discomfort and pain in migraine. Cephalalgia. 1997;17:733–741.
- Adams WH, Digre KB, Patel BCK, et al. The evaluation of light sensitivity in benign essential blepharospasm. Am J Ophthalmol. 2006;142(82–87.e8). DOI:https://doi.org/10.1016/j.ajo.2006.02.020
- Digre KB, Brennan KC. Shedding light on photophobia. J Neuro-Ophthalmol Off J North Am Neuro-Ophthalmol Soc. 2012;32:68–81.
- Wolska A, Sawicki D. Evaluation of discomfort glare in the 50+ elderly: experimental study. Int J Occup Med Environ Health. 2014;27:444–459.
- Marié S, Scherlen A-C, Lahssini B. Sensitivity to light: the effects of country, gender & lighting conditions on perceived discomfort. Invest Ophthalmol Vis Sci. 2019;60:3629.
- van den Berg TJ. On the relation between glare and straylight. Doc Ophthalmol Adv Ophthalmol. 1991;78:177–181.
- Fan-Paul NI, Li J, Miller JS, et al. Night vision disturbances after corneal refractive surgery. Surv Ophthalmol. 2002;47:533–546.
- van den Berg TJ. On the relation between intraocular straylight and visual function parameters. Invest Ophthalmol Vis Sci. 1994;35:2659–2661.
- Cerviño A, Gonzalez-Meijome JM, Linhares JMM, et al. Effect of sport-tinted contact lenses for contrast enhancement on retinal straylight measurements. Ophthalmic Physiol Opt J Br Coll Ophthalmic Opt Optom. 2008;28:151–156.
- Cerviño A, Hosking SL, Montés-Micó R, et al. Retinal straylight in patients with monofocal and multifocal intraocular lenses. J Cataract Refract Surg. 2008;34:441–446.
- Cerviño A, Villa-Collar C, Gonzalez-Meijome JM, et al. Retinal straylight and light distortion phenomena in normal and post-LASIK eyes. Graefes Arch Clin Exp Ophthalmol Albrecht Von Graefes Arch Klin Exp Ophthalmol. 2011;249:1561–1566.
- van Rijn LJ, Nischler C, Gamer D, et al. Measurement of stray light and glare: comparison of Nyktotest, Mesotest, stray light meter, and computer implemented stray light meter. Br J Ophthalmol. 2005;89:345–351.
- Cerviño A, Montes-Mico R, Hosking SL. Performance of the compensation comparison method for retinal straylight measurement: effect of patient’s age on repeatability. Br J Ophthalmol. 2008;92:788–791.
- Boyce PR. Human factors in lighting. 3rd ed. Boca Raton (Florida): CRC Press; 2014.
- Bullough J, Brons J, Qi R, et al. Predicting discomfort glare from outdoor lighting installations. Light Res Technol. 2008;40:225–242.
- Bullough JD Luminance versus luminous intensity as a metric for discomfort glare. 2011 [cited 2018 Oct 3]. Available from: http://papers.sae.org/2011-01-0111/.
- Bullough J, Sweater Hickcox K. Interactions among light source luminance, illuminance and size on discomfort glare. SAE Int J Passenger Cars Mech Syst. 2012;5:199–202.
- CIE (International Commission on Illumination). Discomfort glare in interior lighting. Vienna: CIE Central Bureau; 1995.
- CIE (International Commission on Illumination). Internationale Beleuchtungskommission, editor. CIE collection on glare: 2002. Vienna: CIE, Central Bureau; 2002.
- Huang W, Yang Y, Luo MR. Discomfort glare caused by white LEDs having different spectral power distributions. Light Res Technol. 2018;50:921–936.
- Bullough JD. Spectral sensitivity for extrafoveal discomfort glare. J Mod Opt. 2009;56:1518–1522.
- Mulleners WM, Aurora SK, Chronicle EP, et al. Self-reported photophobic symptoms in migraineurs and controls are reliable and predict diagnostic category accurately. Headache J Head Face Pain. 2001;41:31–39.
- Fotios S, Chan A, Engelke U, et al. Guidance towards best practice in psychophysical procedures used when measuring relative spatial brightness. CIE; 2014. (Report No.: CIE 212:2014).
- Iodice M, Jost S, Dumortier D Testing experimental methods for discomfort glare investigations. Proceedings of 29th quadrenn session CIE [ Internet]. Washington (DC): International Commission on Illumination, CIE; 2019 [cited 2020 Mar 31]. p. 317–324. Available from: http://files.cie.co.at/x046_2019/x046-OP43.pdf.
- Stringham JM, Garcia PV, Smith PA, et al. Macular pigment and visual performance in glare: benefits for photostress recovery, disability glare, and visual discomfort. Invest Ophthalmol Vis Sci. 2011;52:7406–7415.
- Lin Y, Fotios S, Wei M, et al. Eye movement and pupil size constriction under discomfort glare. Invest Ophthalmol Vis Sci. 2015;56(3):1649–1656.
- Tyukhova Y, Waters C. Subjective and pupil responses to discomfort glare from small, high-luminance light sources. Light Res Technol. 2019;51:592–611.
- Mathur A, Gehrmann J, Atchison DA. Influences of luminance and accommodation stimuli on pupil size and pupil center location. Invest Ophthalmol Vis Sci. 2014;55:2166–2172.
- Partala T, Surakka V. Pupil size variation as an indication of affective processing. Int J Hum Comput Stud. 2003;59:185–198.
- van der Wel P, van Steenbergen H. Pupil dilation as an index of effort in cognitive control tasks: A review. Psychon Bull Rev. 2018;25:2005–2015.
- Wilhelm B, Stuiber G, Lüdtke H, et al. The effect of caffeine on spontaneous pupillary oscillations. Ophthalmic Physiol Opt. 2014;34:73–81.
- Murray I, Plainis S, Carden D. The ocular stress monitor: a new device for measuring discomfort glare. Light Res Technol. 2002;34:231–239.
- Luckiesh M, Holladay L. Glare and visibility. Trans Illum Eng Soc. 1925;XX:D.221.
- Fotios S. Research note: uncertainty in subjective evaluation of discomfort glare. Light Res Technol. 2015;47:379–383.
- de Boer JB, Schreuder DA. Glare as a criterion for quality in street lighting. Light Res Technol. 1967;32:117–135.
- Gellatly AW, Weintraub DJ. User reconfigurations of the De Boer rating scale for discomfort glare. 1990. University of Michigan, Ann Arbor, Transportation Research Institute.
- Choi J-Y, Oh K, Kim B-J, et al. Usefulness of a photophobia questionnaire in patients with migraine. Cephalalgia. 2009;29:953–959.
- Cortez MM, Digre K, Uddin D, et al. Validation of a photophobia symptom impact scale. Cephalalgia. 2019;39:1445–1454.
- Aguilar MC, Gonzalez A, Rowaan C, et al. BPEI photosensitivity tester: instrument design and test results in healthy subjects. Invest Ophthalmol Vis Sci. 2014;55:4108.
- Thurstone LL. Psychophysical analysis. Am J Psychol. 1927;100:587–609.
- McGraw KO, Wong SP. Forming inferences about some intraclass correlation coefficients. Psychol Methods. 1996;1:30–46.
- McAlinden C, Khadka J, Pesudovs K. Statistical methods for conducting agreement (comparison of clinical tests) and precision (repeatability or reproducibility) studies in optometry and ophthalmology. Ophthalmic Physiol Opt J Br Coll Ophthalmic Opt Optom. 2011;31:330–338.
- Rozema JJ, Van den Berg TJTP, Tassignon M-J. Retinal straylight as a function of age and ocular biometry in healthy eyes. Invest Opthalmol Vis Sci. 2010;51:2795.